

oatawa/iStock via Getty Images
BigCommerce Holdings, Inc. (NASDAQ:BIGC) is an e-commerce software company with a market share of 3% according to Tool Tester. While the company had robust revenue growth with a 3-year average of 34%, it had never achieved positive profitability, thus we determined its profitability outlook by analyzing its expenses and profit margins and compared to its competitors.
Gross And Net Margins
|
Earnings & Margins |
2018 |
2019 |
2020 |
2021 |
|
Revenue |
92 |
112 |
152 |
220 |
|
Revenue Growth |
21.98% |
35.95% |
44.29% |
|
|
Gross Profit |
70 |
85 |
118 |
171 |
|
Gross Margin (%) |
76.06% |
75.91% |
77.56% |
77.94% |
|
Net Earnings |
(39) |
(43) |
(38) |
(77) |
|
Net Margin (%) |
-42.33% |
-38.00% |
-24.67% |
-34.88% |
Source: BigCommerce, Khaveen Investments
Based on the table above, the company’s gross margins had increased over the past 4 years and were positive in all years with an average of 76.9%. However, its net margins were negative in the past 4 years, with an average of -35%. While its net margins had improved since 2018, it declined in 2021 to -34.9%. To determine the factors weighing down on its profitability, we examined its expense analysis breakdown.
BigCommerce, Khaveen Investments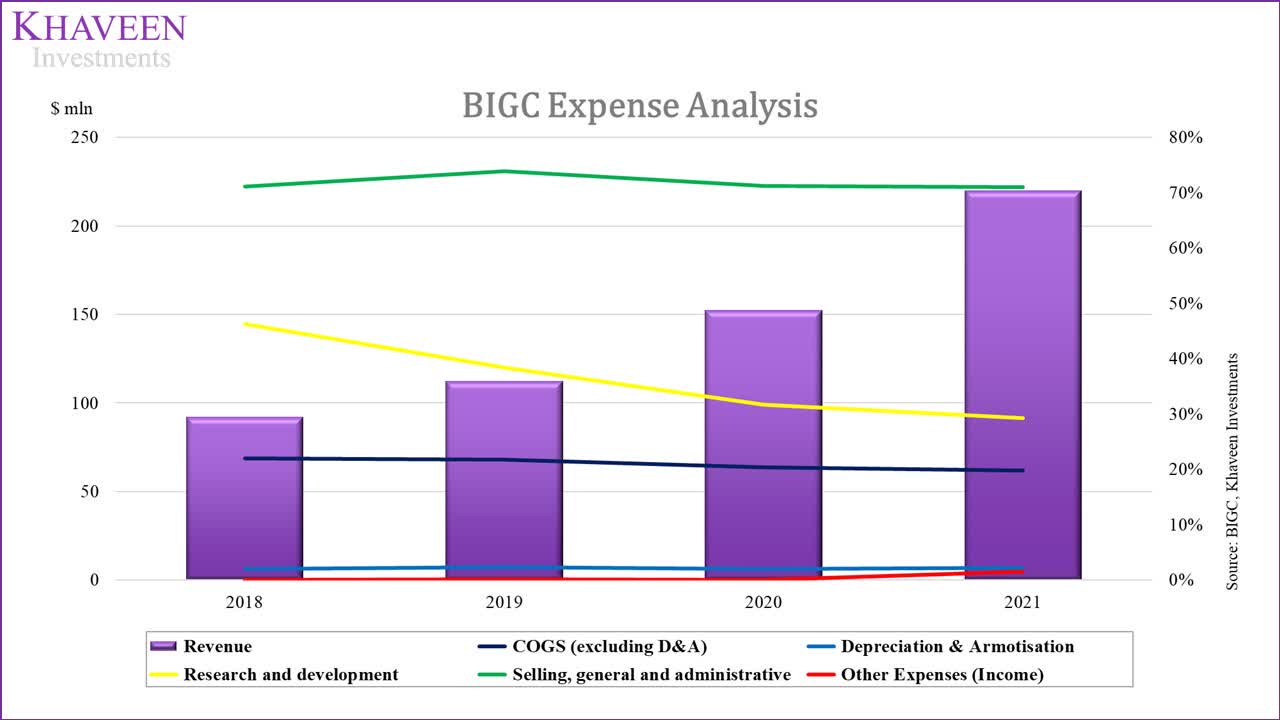
Based on the chart, its SG&A expense was the largest contributor to its total expenses, representing 71.03% of revenue in 2021. In the past 4 years, it had remained around the same level, with only a minor increase in 2019 to 73.9%. However, its R&D expenses, which are its second-largest expense, as a % of revenue had declined over the past 4 years from 46.3% in 2018 to 29.3% in 2021. This represented an average decline of 13.96% of its R&D expense as a % of revenue in the past 3 years.
According to the company’s annual report, its R&D expenses are primarily personnel-related expenses to maintain its platform and allocated overhead costs. Also, the company expects the costs as a % of revenue to continue decreasing as it expands overseas in “lower-cost international locations”. We forecasted its margins assuming its R&D expense as a % of revenue continues to decline based on its 3-year average rate of -13.96% to 17.18% of revenue in 2026. However, we assumed its SG&A, which consists primarily of personnel-related costs and commissions to promote its brand, as a % of revenue to remain stagnant at 71.85% based on its 3-year average. In its annual report, the company also highlighted its plan to increase investment in SG&A by increasing its hiring.
BigCommerce, Khaveen Investments
Overall, we projected its gross and net margin to improve to 81.4% and -8% by 2026 but remain unprofitable as we expect its R&D expenses as a % of revenue to continue declining to 17.18% by 2026 but its SG&A expenses remain stagnant at 71.85% of revenues based on its 3-year average as it focuses on promoting and expanding its business with increased investments in SG&A activities.
FCF Margins
|
FCF ($ mln) |
2018 |
2019 |
2020 |
2021 |
|
Operating Cash Flow |
-31 |
-40 |
-27 |
-40 |
|
Capital Expenditure |
-27 |
18 |
-2 |
-187 |
|
Free Cash Flow Margin (%) |
-62.32% |
-19.98% |
-19.13% |
-103.39% |
Source: BigCommerce, Khaveen Investments
Furthermore, the company had negative free cash flow margins in the past 4 years as seen in the table above with an average of -51.2% as its operating cash flows were weighed down by its negative profit margins. However, its capex in the past 4 years was only 2.8% as a % of revenue excluding acquisitions of B2B Ninja and Bundle B2B and investments in marketable securities totalling $183 mln in 2021.
|
Profitability Analysis |
2019 |
2020 |
2021 |
Average |
|
ROA |
-72.1% |
-67.0% |
-27.7% |
-55.6% |
|
ROE (Total) |
-852.0% |
112.2% |
-35.4% |
-258.4% |
Source: BigCommerce, Khaveen Investments
Additionally, from the table above, its profitability analysis shows that its ROA while negative in the past 3 years, it had been improving as its net margins improved faster than its asset growth. Whereas its ROE had been volatile in the past 3 years improving in 2020 but returning to negative in 2021.
BigCommerce, Khaveen Investments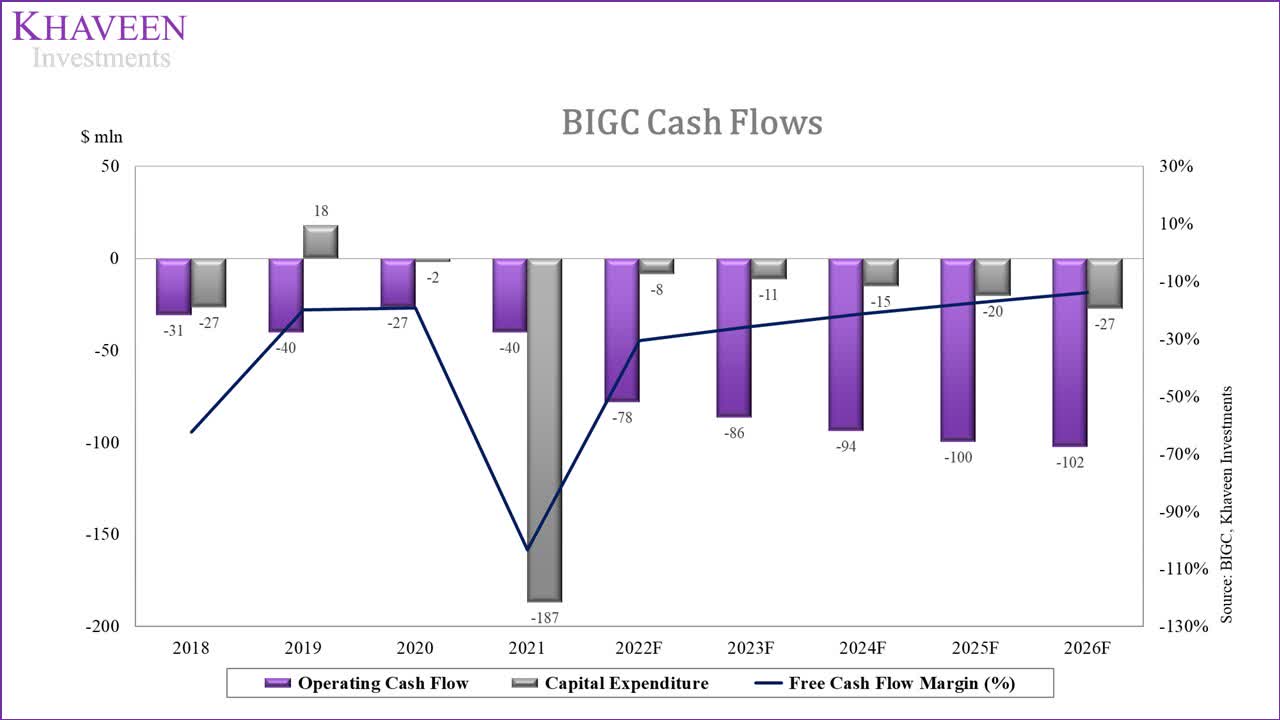
All in all, we expect the company’s FCF margins to improve with the rise of its profitability and low capex requirements. However, we do not see the company generating positive free cash flows in our forecast to 2026 at only -13.97%.
Comparison To Competitors
Moreover, we compared the company against its competitors based on its revenue, growth rate and margins to determine its profitability outlook.
|
Company |
Revenue ($ mln) |
5-yr Revenue CAGR |
Gross Margins |
Net Margins |
FCF Margins |
|
Shopify (SHOP) |
4,826.80 |
61.16% |
54.86% |
9.77% |
3.71% |
|
Salesforce (CRM) |
27,940.00 |
25.79% |
74.19% |
7.51% |
29.37% |
|
BigCommerce* |
182.9 |
34.07% |
76.87% |
-34.97% |
-51.20% |
|
Wix (WIX) |
1,310.50 |
32.49% |
74.34% |
-11.85% |
18.09% |
|
Squarespace** (SQSP) |
812.2 |
22.33% |
83.27% |
-41.97% |
48.65% |
|
SAP (SAP) |
31,608.60 |
4.78% |
70.64% |
16.67% |
21.05% |
|
Oracle (ORCL) |
41,827.00 |
2.25% |
79.89% |
23.62% |
26.14% |
|
Average |
15,501.14 |
26.1% |
73.4% |
-4.5% |
13.7% |
*3 years
**1 year
Source: Seeking Alpha, Khaveen Investments
Based on the table above, the company is the smallest compared to its competitors based on its revenues of $182.9 mln and has negative profit margins. Also, competitors with higher revenues such as Wix and Squarespace do not have positive net margins. In comparison, Shopify, which has $4.8 bln in revenue or 20 times greater than BigCommerce, and larger companies such as Salesforce, SAP and Oracle had positive gross and net margins.
Although BigCommerce has not achieved positive net profits, its average revenue growth (34%) had been higher than average (26.1%). That said, Shopify had the highest revenue growth (61.2%) among its competitors, even with greater revenues than BigCommerce.
Overall, comparing the company against larger competitors, we believe the company could become eventually become profitable as it grows larger. However, as the company’s small scale and revenue pale in comparison with larger competitors such as Shopify, which also has higher revenue growth, we do not expect the company to reach profitability in the near future.
Risk: Competition With Shopify
Shopify was the market leader in the e-commerce software market according to ToolTester with a 38% market share. As a larger company with higher revenue growth, we believe BigCommerce could face tough competition against Shopify, which could affect its profitability outlook to remain competitive. Additionally, there are 285 e-commerce software according to G2, which highlights the fragmented market.
Verdict
Although the company had robust revenue growth of a 5-year CAGR of 34.07%, we expect its profitability outlook to be weighed down by high SG&A expenses as the company focuses on expanding and promoting its brand with a forecasted gross and net margin of 81.4% and -8% respectively by 2026. Moreover, we believe larger and faster-growing competitors such as Shopify could pose a competitive threat to its growth outlook. Also, we do not expect the company to generate positive free cash flows by 2026 at an FCF margin of -13.97%. Based on the analyst consensus price target of $29.00, this represents an upside of 68%, which reflects that the stock price had declined by 73% over the past 1 year.
Be the first to comment