

Justin Sullivan
By Valuentum Analysts
NVIDIA (NASDAQ:NVDA) is facing headwinds from supply chain hurdles and inflation, gaming revenue weakness, and elevated inventory levels, though we continue to believe its long-term growth outlook is bright, especially across its ‘Data Center’ operations, where revenue advanced 31% in its most recently-reported fiscal third quarter from a year ago. That said, we’ve cut our fair value estimate of shares since our last update to account for near-term recessionary conditions, particularly in its gaming business, and more conservative assumptions within our discounted cash flow framework.
Our more conservative near-term assumptions, particularly with respect to Nvidia’s gaming sales, impact our longer-term mid-cycle assumptions (in Year 5, for example), which has a cascading impact on our valuation and has had a large impact on the fair value we ascribe to Nvidia’s shares. As with our fair value estimate cut on Salesforce (CRM) more recently here, mid-cycle expectations can sometimes change fast (having an outsize impact on a fair value estimate change), even within a long-term modeling framework.
When we last wrote about Nvidia in December 2021 on Seeking Alpha, for example, the cryptocurrency space was holding up, disruptive innovation stocks hadn’t been completely pummeled (only slightly at that time), gaming still looked okay, interest rates were still benign –especially the 10-year rate — and tech spending looked solid. Layoffs weren’t even on Silicon Valley’s mind at the time (unlike today, where we’re hearing layoffs by the tens of thousands), and neither were export restrictions on China. These things impact mid-cycle considerations, to varying degrees.
In factoring in the current more-uncertain economic backdrop, which translates into much more conservative mid-cycle assumptions (as in the case of Salesforce, as well), we’ve substantially lowered our fair value estimate of Nvidia. Shares of Nvidia are trading at ~$160 per share at the moment, but we’re being extra cautious and believe the best way to view Nvidia’s fair value is through our fair value range that falls between $95-$163 per share (more on the fair value range later). The fair value estimate range can be best viewed in the context of a margin of safety, where value investors look to get shares at a steep discount to their estimate of intrinsic value.
With all of this said, let’s now dig into this valuation update on Nvidia. For those new to the story, Nvidia is a computer graphics company [GPU]. Its business is based on two technologies: the GPU and the Tegra processor. GPUs are the engine of visual computing. Tegra processors incorporate multi-core GPUs and CPUs together with audio and video capabilities.
Nvidia’s Key Investment Considerations
Investment Considerations (Valuentum)
Gaming had been a strong point for Nvidia as rapid demand growth in deep learning is pushing GPU revenue higher. However, the firm’s most recent quarterly report showed a big slowdown in gaming sales as the firm continues to work through inventory levels. Its high-end graphics rendering platform, Nvidia RTX, is nonetheless setting new standards in gaming technology.
Our valuation model assumes double-digit annual revenue growth and strong margin performance in the coming fiscal years. This forecast is underpinned by Nvidia’s relentless focus on innovation, secular growth tailwinds, and its successes in the realm of gaming, data centers, and AI (artificial intelligence). As we noted previously, however, due to the sensitivity of long-term assumptions in our discounted cash flow modeling framework, should Nvidia’s outlook stumble for any reason, its intrinsic value would face serious headwinds (but perhaps not as much from these currently-revised levels).
Nvidia expects to be a significant player in autonomous driving. Hundreds of companies use its DRIVE AGX open computing platform, and the list includes many of the top names in next-gen car and truck manufacturing. Nvidia tabs autonomous vehicles as a $60 billion opportunity by 2035. In April 2020, Nvidia completed its ~$7 billion acquisition of Mellanox. Nvidia announced that its deal for Arm Limited had been terminated in February 2022 as regulatory hurdles prevented the acquisition from going through as planned. We expect Nvidia to remain active in finding complementary technologies.
On November 16, Nvidia reported mixed fiscal third-quarter results that showed a beat on the top line, despite a 16.5% decline in revenue, but a miss on the bottom line. The firm issued revenue guidance for the fiscal fourth quarter that, at its midpoint, came in a little lighter than what the Street had been expecting. Nvidia noted that new export restrictions on China impacted the company’s business, and we’ll be watching developments on this front closely as geopolitical tensions between the U.S. and China continue to increase.
The Dividend Cushion ratio is one of the most powerful financial tools an income or dividend growth investor can use in conjunction with qualitative dividend analysis. The ratio is one-of-a-kind in that it is both free-cash-flow based and forward looking. Since its creation in 2012, the Dividend Cushion ratio has forewarned readers of approximately 50 dividend cuts. We estimate its efficacy at ~90%. (Valuentum)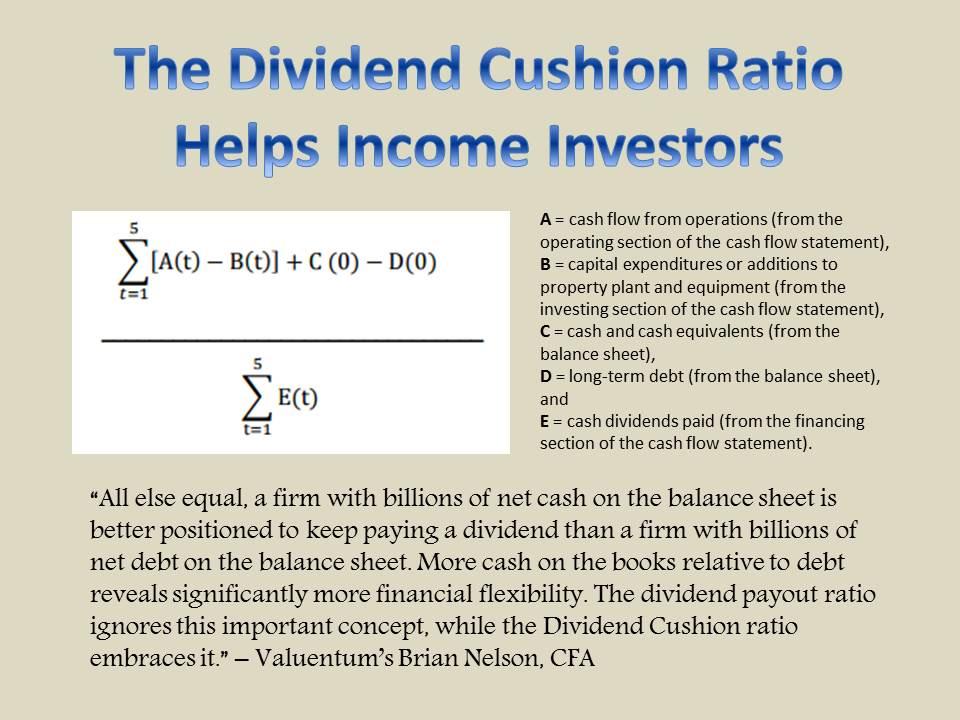
Nvidia’s free cash flow generation is supported by its capital-light business model, which helps drive its excellent Dividend Cushion ratio. Free cash flow has traditionally averaged a multiple of the firm’s annual run rate cash dividend obligations. Though management has been shareholder-friendly of late, the company’s dividend yield is not noteworthy. This has the potential to change in coming years given its free cash flow-generating prowess, but Nvidia continues to prioritize business growth and acquisitions over dividend growth.
Dividend Cushion Bridge (Valuentum)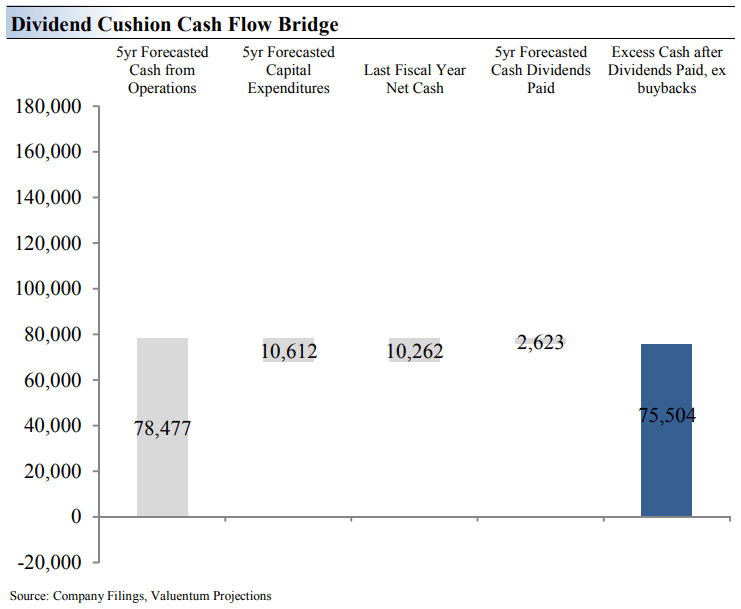
The Dividend Cushion Cash Flow Bridge, shown in the image above, illustrates the components of the Dividend Cushion ratio and highlights in detail the many drivers behind it. Nvidia’s Dividend Cushion Cash Flow Bridge reveals that the sum of Nvidia’s 5-year expected cumulative free cash flow generation, as measured by cash flow from operations less all capital spending, plus its net cash/debt position on the balance sheet, as of the last fiscal year, is greater than the sum of the next 5 years of expected cash dividends paid.
Because the Dividend Cushion ratio is forward-looking and captures the trajectory of the company’s free cash flow generation and dividend growth, it reveals whether there will be a cash surplus or a cash shortfall at the end of the 5-year period, taking into consideration the leverage on the balance sheet, a key source of risk. On a fundamental basis, we believe companies that have a strong net cash position on the balance sheet and are generating a significant amount of free cash flow are better able to pay and grow their dividend over time.
Firms that are buried under a mountain of debt and do not sufficiently cover their dividend with free cash flow are more at risk of a dividend cut or a suspension of growth, all else equal, in our opinion. Generally speaking, the greater the ‘blue bar’ to the right is in the positive, the more durable a company’s dividend, and the greater the ‘blue bar’ to the right is in the negative, the less durable a company’s dividend. Nvidia’s dividend looks solid based on the Dividend Cushion ratio.
Nvidia’s Economic Profit Analysis
The best measure of a firm’s ability to create value for shareholders is expressed by comparing its return on invested capital [ROIC] with its weighted average cost of capital [WACC]. The gap or difference between ROIC and WACC is called the firm’s economic profit spread. Nvidia’s 3-year historical return on invested capital (without goodwill) is 72.3%, which is above the estimate of its cost of capital of 9.7%.
As such, we assign the firm a ValueCreation rating of EXCELLENT. In the chart below, we show the probable path of ROIC in the years ahead based on the estimated volatility of key drivers behind the measure. The solid grey line reflects the most likely outcome, in our opinion, and represents the scenario that results in our fair value estimate. Despite the near-term challenges and fair value estimate revision, Nvidia is expected to remain a strong economic-value generator.
Adjusted Return on Invested Capital (Image Source: Valuentum)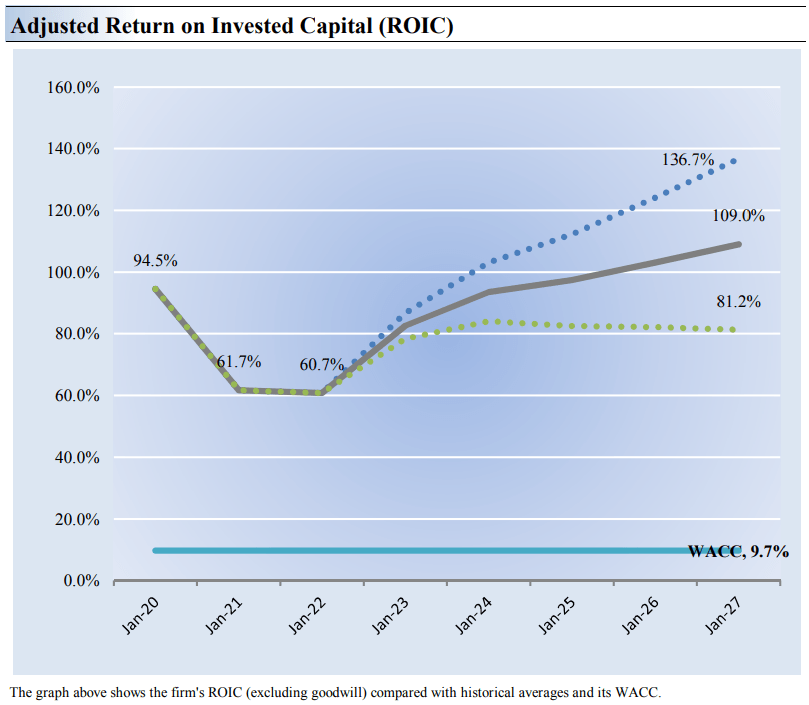
Nvidia’s Cash Flow Valuation Analysis
Image Source: Valuentum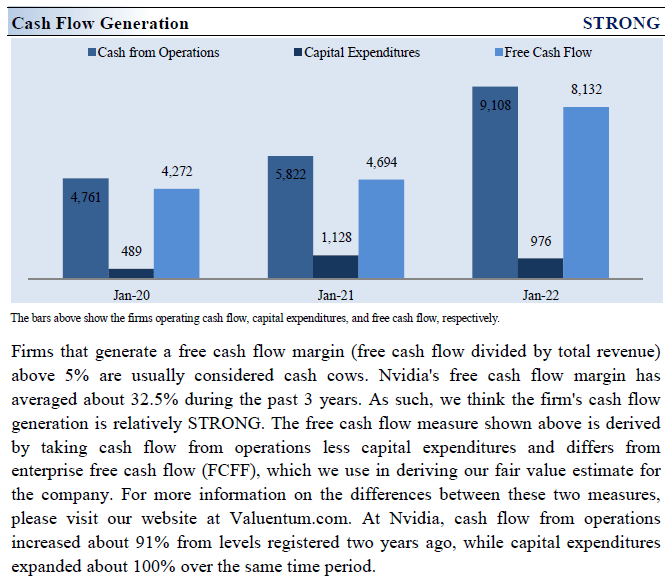
We think Nvidia is worth $129 per share with a fair value range of $95.00-$163.00. This is below where shares are currently trading at the moment, and significantly below where our fair value estimate stood upon our latest update.
The margin of safety around our fair value estimate is driven by the firm’s MEDIUM ValueRisk rating, which is derived from an evaluation of the historical volatility of key valuation drivers and a future assessment of them.
Our near-term operating forecasts, including revenue and earnings, do not differ much from consensus estimates or management guidance. Our model reflects a compound annual revenue growth rate of 10.9% during the next five years, a pace that is lower than the firm’s 3-year historical compound annual growth rate of 31.9%.
Our valuation model reflects a 5-year projected average operating margin of 44.1%. Beyond year 5, we assume free cash flow will grow at an annual rate of 6.9% for the next 15 years and 3% in perpetuity. For Nvidia, we use a 9.7% weighted average cost of capital to discount future free cash flows.
Valuation Assumptions (Image Source: Valuentum)
Nvidia’s Margin of Safety Analysis
Margin of Safety (Valuentum)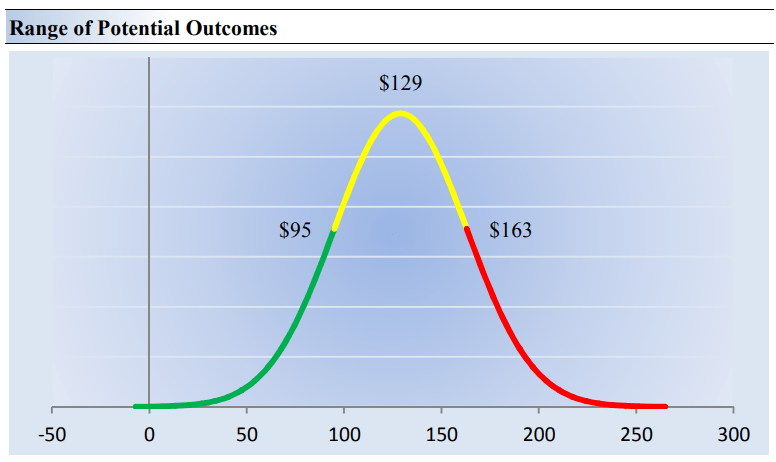
Our discounted cash flow process values each company on the basis of the present value of all future free cash flows. Although we estimate Nvidia’s fair value at about $129 per share, every company has a range of probable fair values that’s created by the uncertainty of key valuation drivers (like future revenue or earnings, for example). After all, if the future were known with certainty, we wouldn’t see much volatility in the markets as stocks would trade precisely at their known fair values.
Our ValueRisk rating sets the margin of safety or the fair value range we assign to each stock. In the graph above, we show this probable range of fair values for Nvidia. We think the firm is attractive below $95 per share (the green line), but quite expensive above $163 per share (the red line). The prices that fall along the yellow line, which includes our fair value estimate, represent a reasonable valuation for the firm, in our opinion. Shares of Nvidia are currently trading near the high end of our updated fair value estimate range.
Concluding Thoughts
With such strong free cash flow generation, there seems to be little hindering the financial health of Nvidia, but that doesn’t mean its share price cannot face pressure as investors adjust future expectations regarding mid-cycle performance. The company’s gaming business is stumbling these days, and this in part has prompted us to reevaluate our fair value estimate for shares, particularly in light of what has changed since our last update of Nvidia on Seeking Alpha — rising discount rates, export restrictions on China, weakening economy, inventory issues, etc. We believe the best way to view a fair value of Nvidia is via a fair value estimate range, and we would only view Nvidia’s shares as a bargain near the lower end of our fair value estimate range (~$95 per share). Though shares may never reach those levels, uncertainty has increased materially, and we’ve taken note.
This article or report and any links within are for information purposes only and should not be considered a solicitation to buy or sell any security. Valuentum is not responsible for any errors or omissions or for results obtained from the use of this article and accepts no liability for how readers may choose to utilize the content. Assumptions, opinions, and estimates are based on our judgment as of the date of the article and are subject to change without notice.
Be the first to comment