
Muhammad Ahmad Jumasa/iStock via Getty Images
DISCLAIMER: This note is intended for US recipients only and, in particular, is not directed at, nor intended to be relied upon by any UK recipients. Any information or analysis in this note is not an offer to sell or the solicitation of an offer to buy any securities. Nothing in this note is intended to be investment advice and nor should it be relied upon to make investment decisions. Cestrian Capital Research, Inc., its employees, agents or affiliates, including the author of this note, or related persons, may have a position in any stocks, security, or financial instrument referenced in this note. Any opinions, analyses, or probabilities expressed in this note are those of the author as of the note’s date of publication and are subject to change without notice. Companies referenced in this note or their employees or affiliates may be customers of Cestrian Capital Research, Inc. Cestrian Capital Research, Inc. values both its independence and transparency and does not believe that this presents a material potential conflict of interest or impacts the content of its research or publications.
A Time To Be Brave (Whilst Armed With A Stop Loss!)
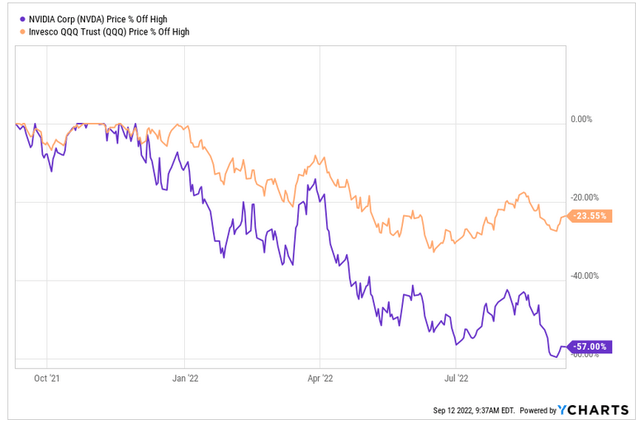
NVIDIA (NASDAQ:NASDAQ:NVDA) Corporate stock has had a truly dreadful run of late. Hit by the collapse in valuation multiples that rate-rises have wrought upon tech stocks, hit by the collapse in sell-through volumes of gaming and crypto end market tools, and finally hacked at the knees by news of the coming ‘Cyber’ nationalist rallying cry in the US. The last year has look liked this:
NVDA vs QQQ (YCharts)
Nasdaq bad, very bad. Nvidia, worse, very much worse.
Unless you truly believe the various doomsayers that have taken to roam the halls of FinTwit though, do you really think that this critical provider of semiconductor devices – specifically the device types essential to the next generation of computing – is going to fall back into obscurity? We don’t think that. We think that the stock is going to move up again.
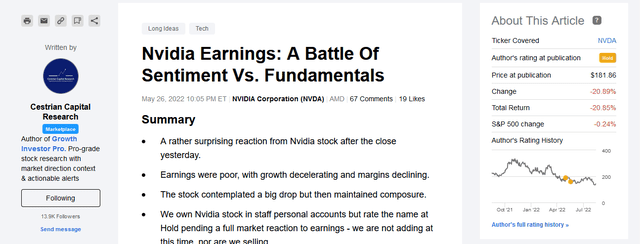
After Q1 earnings we rated NVDA at ‘Hold’.
Our recent NVDA note (Seeking Alpha, Cestrian Capital Research)
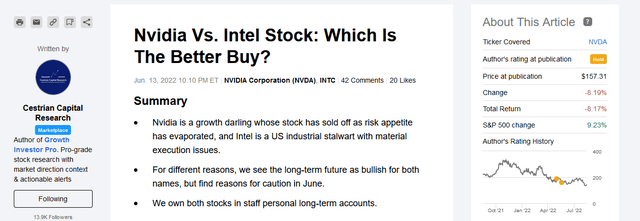
We re-iterated that view in June.
Another recent NVDA note of ours (Seeking Alpha, Cestrian Capital Research)
On both occasions the stock has since given up ground both in absolute and relative terms.
But we now have the stock rated at ‘Accumulate’ i.e., we think it justifiable to be building up a position in the name, slowly, carefully, in anticipation of a longer-term rally to come. Let’s walk through the logic here. (You may wish to read those “Hold” notes from May and June this year – you can find them here and here. )
NVDA Stock Key Metrics
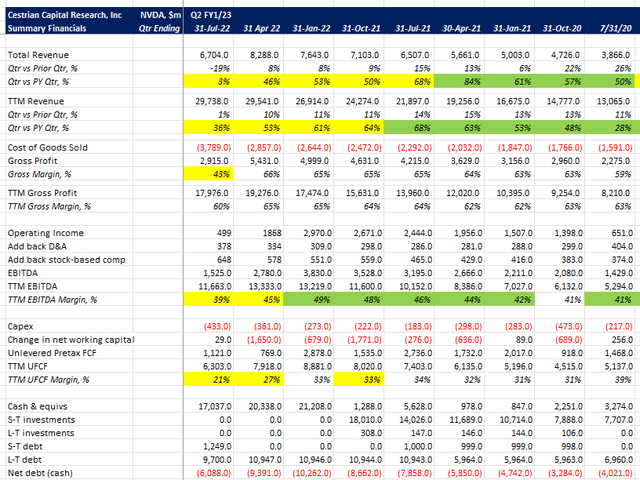
First, the fundamentals – which are truly weak following recent earnings.
NVDA Fundamentals (Company SEC filings, YCharts, Cestrian Analysis)
Growth flat, margins way down and cash pile declining. It’s not a good look. And although the stock is beaten down, the fundamental valuation multiples remain elevated.
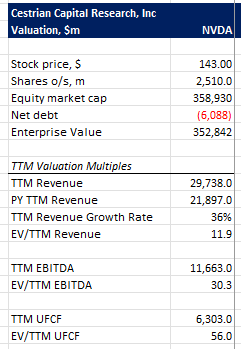
NVDA Valuation (Company SEC filings, YCharts, Cestrian Analysis)
12x TTM revenue and 56x TTM unlevered pre-tax free cashflow for no growth and declining cashflow margins? Yikes.
The thing is though, since stock prices run ahead of fundamentals not behind them, ahead of popular sentiment and not in pursuit of it, we believe the stock chart is rather telling.
The stock looks to have bottomed and be moving up. And if so, we believe that is because the bad news is in. CHIPS Act/China, crypto winter, gaming slowdown vs. lockdown times, all that. Let’s look at the chart a couple different ways using different wave counts. First, let’s say the stock is in the early days of a 5th wave up, like this:
(You can open a full page version of this chart, here.)
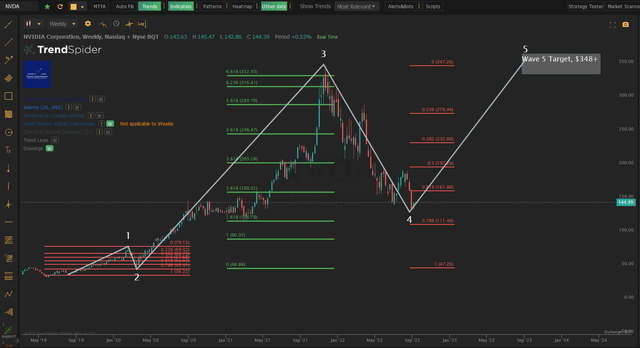
NVDA Chart (TrendSpider, Cestrian Analysis)
Using this lens the stock put in a Wave 1 up from the 2019 lows peaking right before the Covid crisis; then a 78.6% retrace into the Wave 2 low in the depths of the crisis. Followed by what can only be described as a Yuge Move Wave 3 that peaks above the 6.618 extension of Wave 1, before falling into a Wave 4 down that looks to have troughed a little above the 78.6% retracement of that Yuge Wave 3. If that count is correct then NVDA is early in a Wave 5 up, but, this can be what highly advanced technicians refer to as a Nuts Wave 5 up because the pattern suggests it will make a new high in that Wave 5 – a target of $350 or better in fact. Which means an explosive move upwards from here. OK, no one knows for sure but the chart logic is sound i.e. applying standard Elliott Wave and Fibonacci patterns, that’s a not-unreasonable expectation for what may happen with NVDA stock. If you are interested by the way, the reason we think that huge W3 is one single wave and it’s not the conclusion of a Wave 5 itself, is that there’s no real Wave 4 drop all the way from the Covid lows to the 2021 highs.
Let’s say we can’t count however and let’s say that whole 2019 to 2021 move is a complete 5-wave cycle. We don’t think it is, but it’s such a whopping move up maybe we are wrong. So let’s say it’s a complete 5-wave cycle – meaning a larger-degree Wave One up. In which case the big drop that happened since that time is a Wave Two down. So let’s see what that implies for the next move. (Full page version, here.)
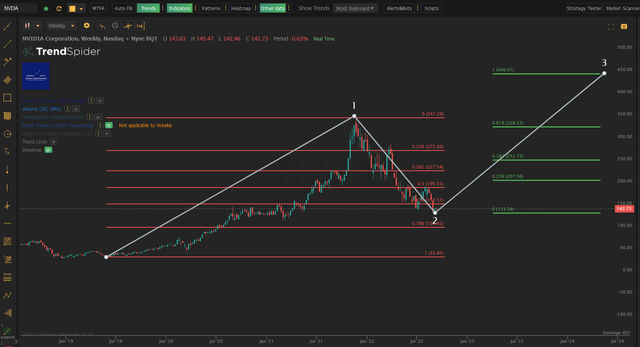
NVDA Chart II (TrendSpider, Cestrian Analysis)
Well, that looks still more fantastical – a minimum target of $350 to make a new high (Wave 3s have to peak above Wave 1s to be a Wave 3) and in fact a more likely target if this pattern is correct of $446 – that’s the 100% extension of Wave 1 (meaning, add the price movement in Wave 1 to the price level at the bottom of Wave 2).
Now it could be that all these charts are nonsense. Quite possible. But we don’t think they are. NVDA trades with sentiment in extremis – hence those crazy moves in 2020-21 – and stocks that trade that way suit the Elliott Wave & Fibonacci lens rather well, since those tools are designed to measure sentiment.
What To Look For In Nvidia’s Long-Term Outlook?
What could torpedo NVDA stock? What should you be looking for? The number one issue to our eyes is competition. Not AMD. There’s enough room in the GPU market for two strong competitors – that’s enough to have both grow revenue and not attract undue attention from the FTC. No, what we have in mind is something coming out of left-field like Risc V has for ARM. A new, low-cost, fundamentally different way of giving customers the raw compute power they crave. No doubt there are many startups working on just that right now but we don’t know of any which are set to hit hyperscale like NVDA – any upon which a major enterprise or consumer-facing Internet business would rely in their mission-critical datacenter infrastructure.
And the CHIPS Act? Good or bad? Well, NVDA is a US based semiconductor business upon which the world has come to rely. The CHIPS Act is a protectionist move designed to limit competition for US based critical semiconductor companies. So we think that net-net it won’t hurt NVDA too much and it may even help some.
The other thing is a breakdown of that chart logic. No matter which chart you think works, if either method is even half right then a breakdown in the stock beneath say $100 tells you that the story is likely to play out differently to the above. The trouble is, that’s a major drop from here, so it’s not much use as a stop-loss for if it trips you already lost a lot of money from today. $125 is probably a more useful level to watch – that’s just below its recent lows.
Is NVDA Stock a Good Investment Long-Term?
We don’t really do buy and hold forever at Cestrian Towers. It’s too much a mantra chanted over and over by asset managers who wish you to, er, have them manage your assets … forever. Meaning, management fees, forever. We do have a 20-year horizon account in the mix in staff personal accounts however, and NVDA is a core holding in there. Because compute requirements are like stocks in Dave Portnoy’s day, meaning, they only go up; because the more graphical and immersive the Internet becomes the more you need parallel processing; because thus far there is only very limited competition for NVDA products; and because sentiment in tech in general and NVDA in particular is so awful that we can’t help but think that now is a compelling time to buy and hold.
Is NVDA Stock A Buy, Sell, or Hold?
We believe NVDA is a Buy. We think this can be played long term – as we are doing in our 20+ year horizon staff personal account – and shorter term too. If you are thinking of trading NVDA over the course of a few months, our plan would likely be something like – buy now, set a stop-loss at around $120-$125, and aim for an upside target of $350, but if the stock does move up from here, place a wide trailing stop beneath your holding. Wide because this thing is and has always been volatile. Not less than a 10% trailing stop would be our own opinion.
So – in short – with a months / years timeframe we think, buy now, upside target $350, downside stop-loss $125, that’s about a 10:1 risk:reward ratio (if that sounds nuts, it’s because of the recent rapid rise and vertiginous selloff), and if it starts moving up, protect your gains with a stop as the thing rises.
Cestrian Capital Research, Inc – 12 September 2022.


Be the first to comment