

Daniel Chetroni
Thesis
NVIDIA (NASDAQ:NASDAQ:NVDA) is currently in an interesting spot. As a deeply cyclical stock, it responded more violently to the different phases of the business cycle as you can see from the following chart. At the beginning of the year, the stock was trading in bubble territory with a P/E of almost 90x. Since then, its stock prices have plunged by more than 51% YTD and by more than 57% off its recent peak. In contrast, its close peer AMD (AMD) “only” lost m41 YTD. And both NVDA and AMD’s losses are far worse than the tech sector represented by QQQ.
At the same time, such a large price correction has deflated the bubble to a large extent and there are many positives to be said about the stock. First, due to the large price corrections, the valuation is much more reasonable now (around 47x P/E as to be elaborated on later). Second, the business fundamentals remain strong and growth prospects robust once the contracting phase is over. It is planning on introducing a host of new GPU, CPU, DPU, and robotics processors in the near future. It recently just reported record data center and gaming volumes. And such a large volume can help to greatly improve cost absorption once the demand picks up again.
The remainder of this article will weigh the pros and cons more closely. But overall, my overall conclusion is that long-term investors like myself can wait for a better opportunity, while swing investors can prepare for a trading window between $125 and $200 (translating into a P/E in the range of about 25x to 40x) in the next 1 or 2 years.
Source: Seeking Alpha Source: Yahoo Finance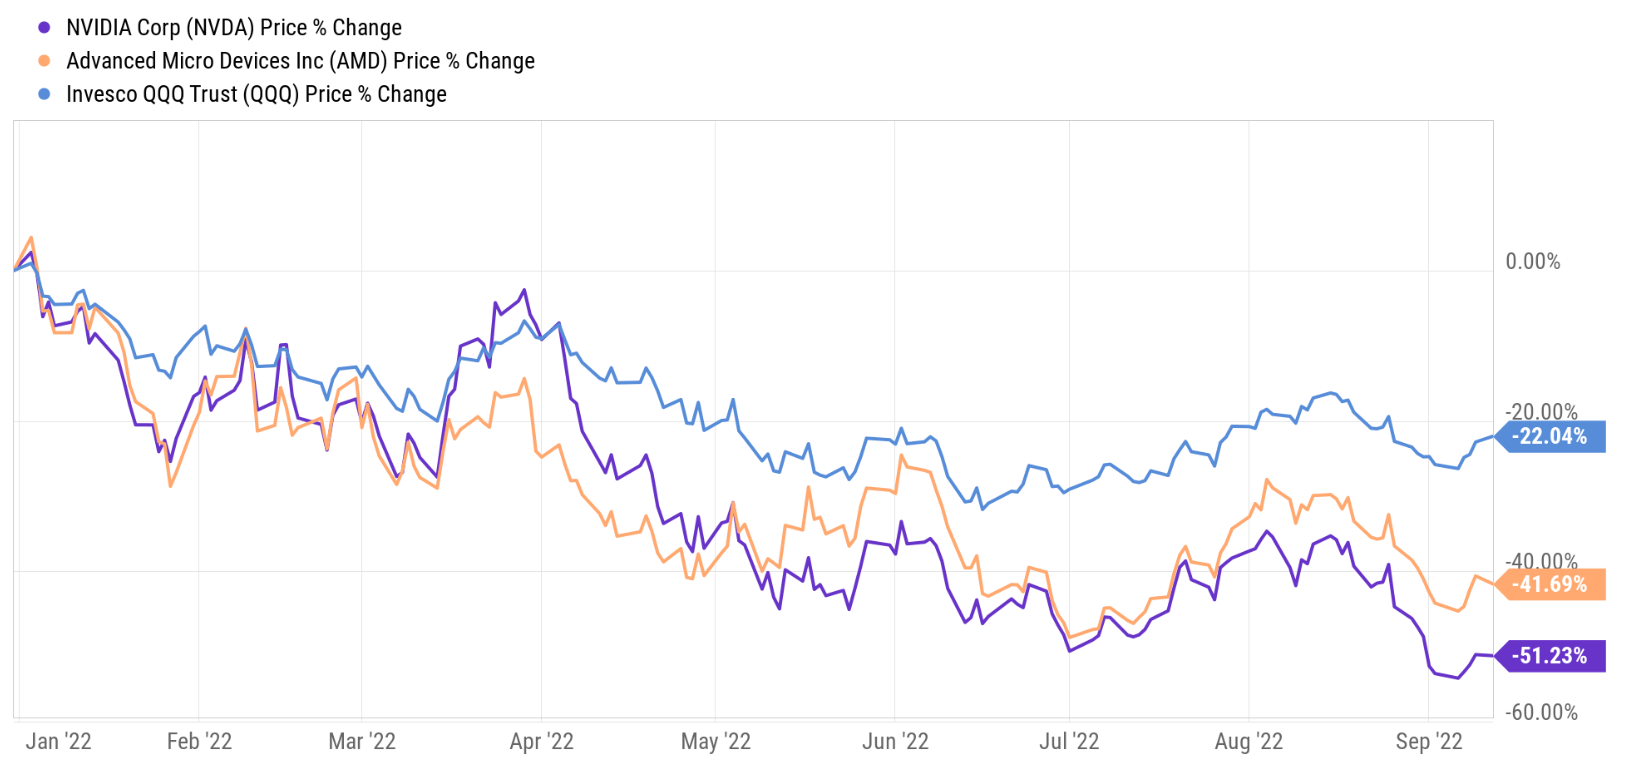

The positives
As mentioned above, there are plenty of positives to be said about the stock. Here I will just point out a few highlights that are less talked about by other SA authors.
First, NVDA enjoys tremendous capital allocation flexibility, and the business is in such a strong financial position even as the demand slows recently. The following chart provides a summary of NVDA maintenance and growth CAPEX spending (details of these concepts can be found in my earlier article here) in the past few years on a quarterly basis. As a result, the business consistently reinvests more than its maintenance and CAPEX requirements. Its CAPEX expenditures have been consistently above $200M since 2020. And it reached a peak of $480M in 2020 and currently stands at $433M, very close to the peak.
Source: Seeking Alpha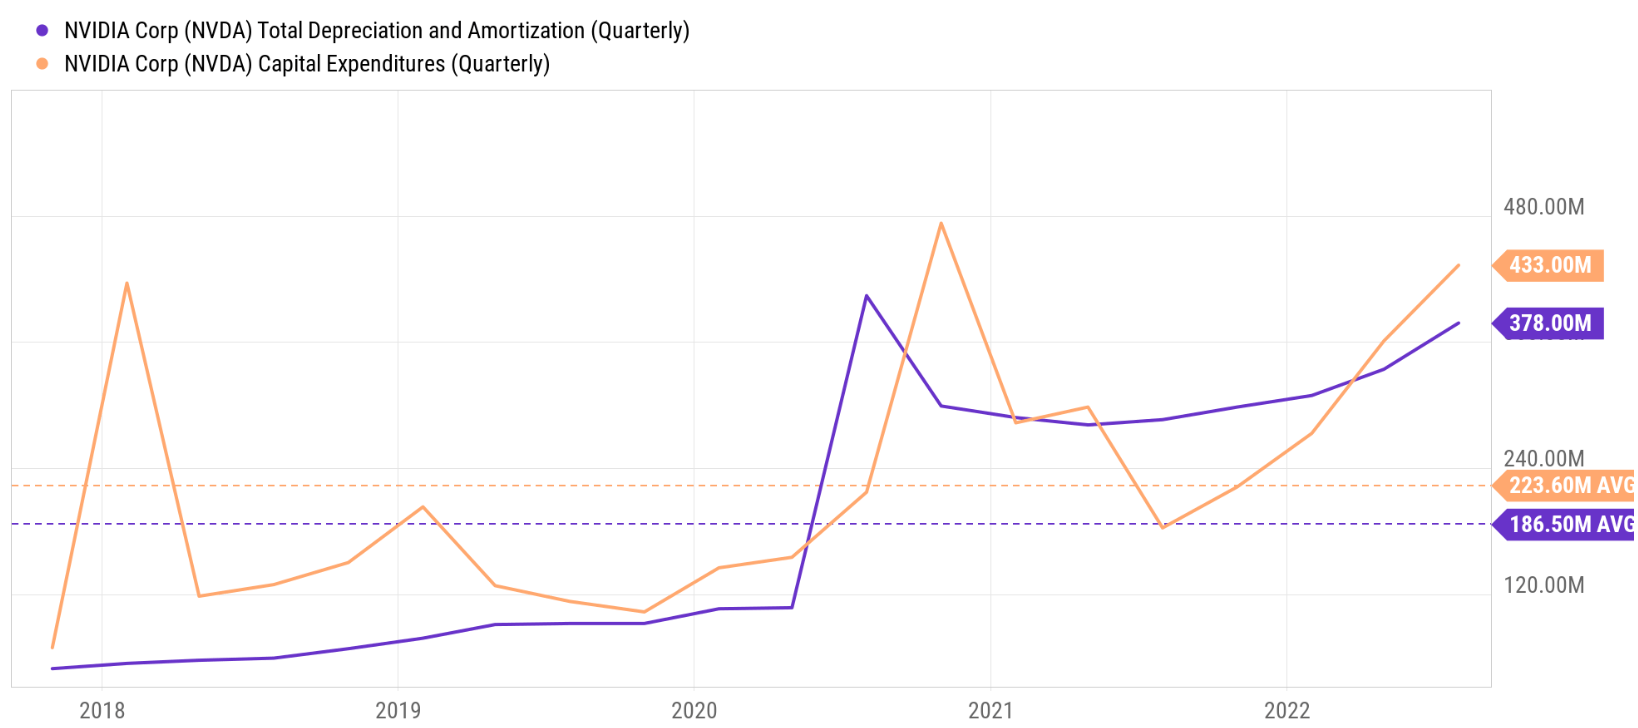
Second, the beauty of NVDA is that it does not need to spend too much on maintenance CAPEX. And hence, a large part of its CAPEX spending is growth CAPEX. Its maintenance CAPEX (approximated by the total amount of depreciation and amortization) has been on average $186M since 2018. And its total CAPEX has been on average $223M. As a crude approximation, the difference of $37M per quarter is on average the amount of growth CAPEX it reinvests to fuel growth. Hence, the growth CAPEX is about 20% of the total CAPEX spending. As a result, its owners’ earnings are much higher than its accounting earnings because the growth CAPEX should be added back to its owners’ earnings, which leads us to the 3rd point below.
Third, its P/E is lower than on the surface once its owners’ earnings, instead of accounting earnings, are considered. The following chart shows NVDA’s true economic earnings compared to its accounting EPS using a more rigorous method as detailed in my earlier article here. The method used a method detailed in Greenwald’s book entitled Value Investing. As seen, NVDA’s owners’ earnings have consistently exceeded its accounting earnings. And the ratio between them has been on average 174% since 2017. Its current OE to EPS ratio is 132%. Its current P/E is about 47x on an accounting basis. And after correcting for the growth CAPEX, its P/E based on owners’ earnings is “only” about 35.6x.
Source: Author based on Seeking Alpha Data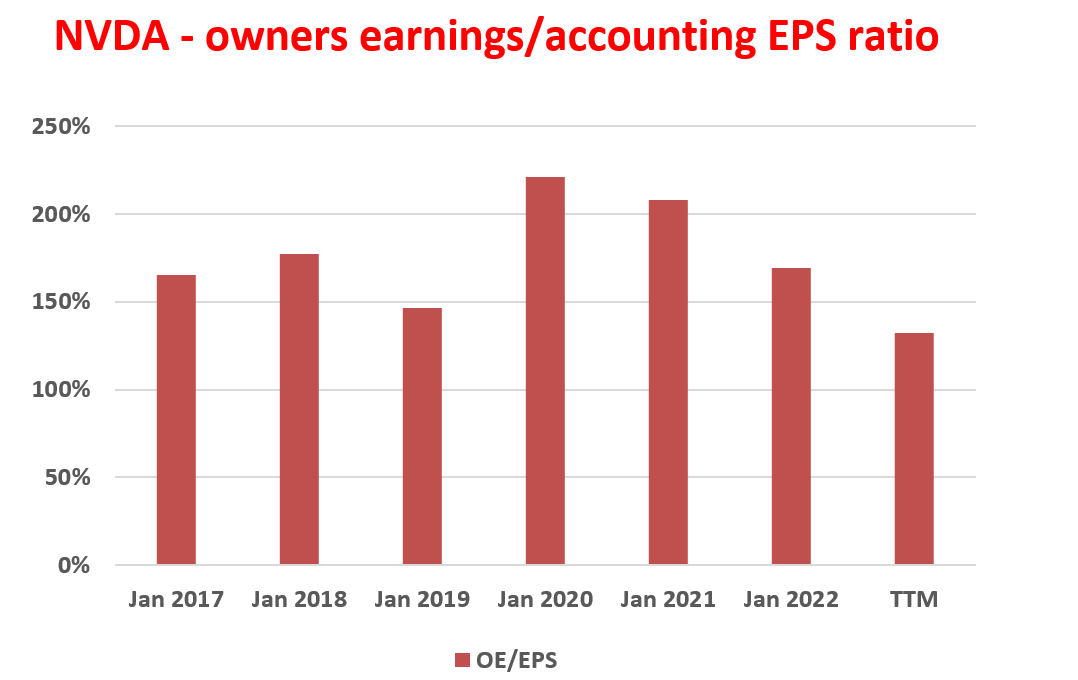
The negatives
Now, the negatives.
First, there is little doubt that the stock is currently in the contracting phase of the business cycle as you can clearly see from the chart below. I’ve detailed the cyclical nature of the business and the fundamental reasons for the cycle in my previous article. The gist is summarized below:
- The quarterly YoY growth of NVDA’s operating revenues in the past 10 years shows two full cycles in the past ten years, each lasting about 3.5 to 4 years. The first expansion cycle peaked in early 2014 and peaked again in early 2018, resulting in a cycle duration of about 4 years. And the second cycle peaked in early 2018 and peaked again during mid-2021, lasting for about 3.5 years.
- The bottom of the previous contraction occurred in mid-2019. If history is of any guidance, I expect the current contraction phase to also last about 4 years too, which translates into sometime in later 2022 and early 2023.
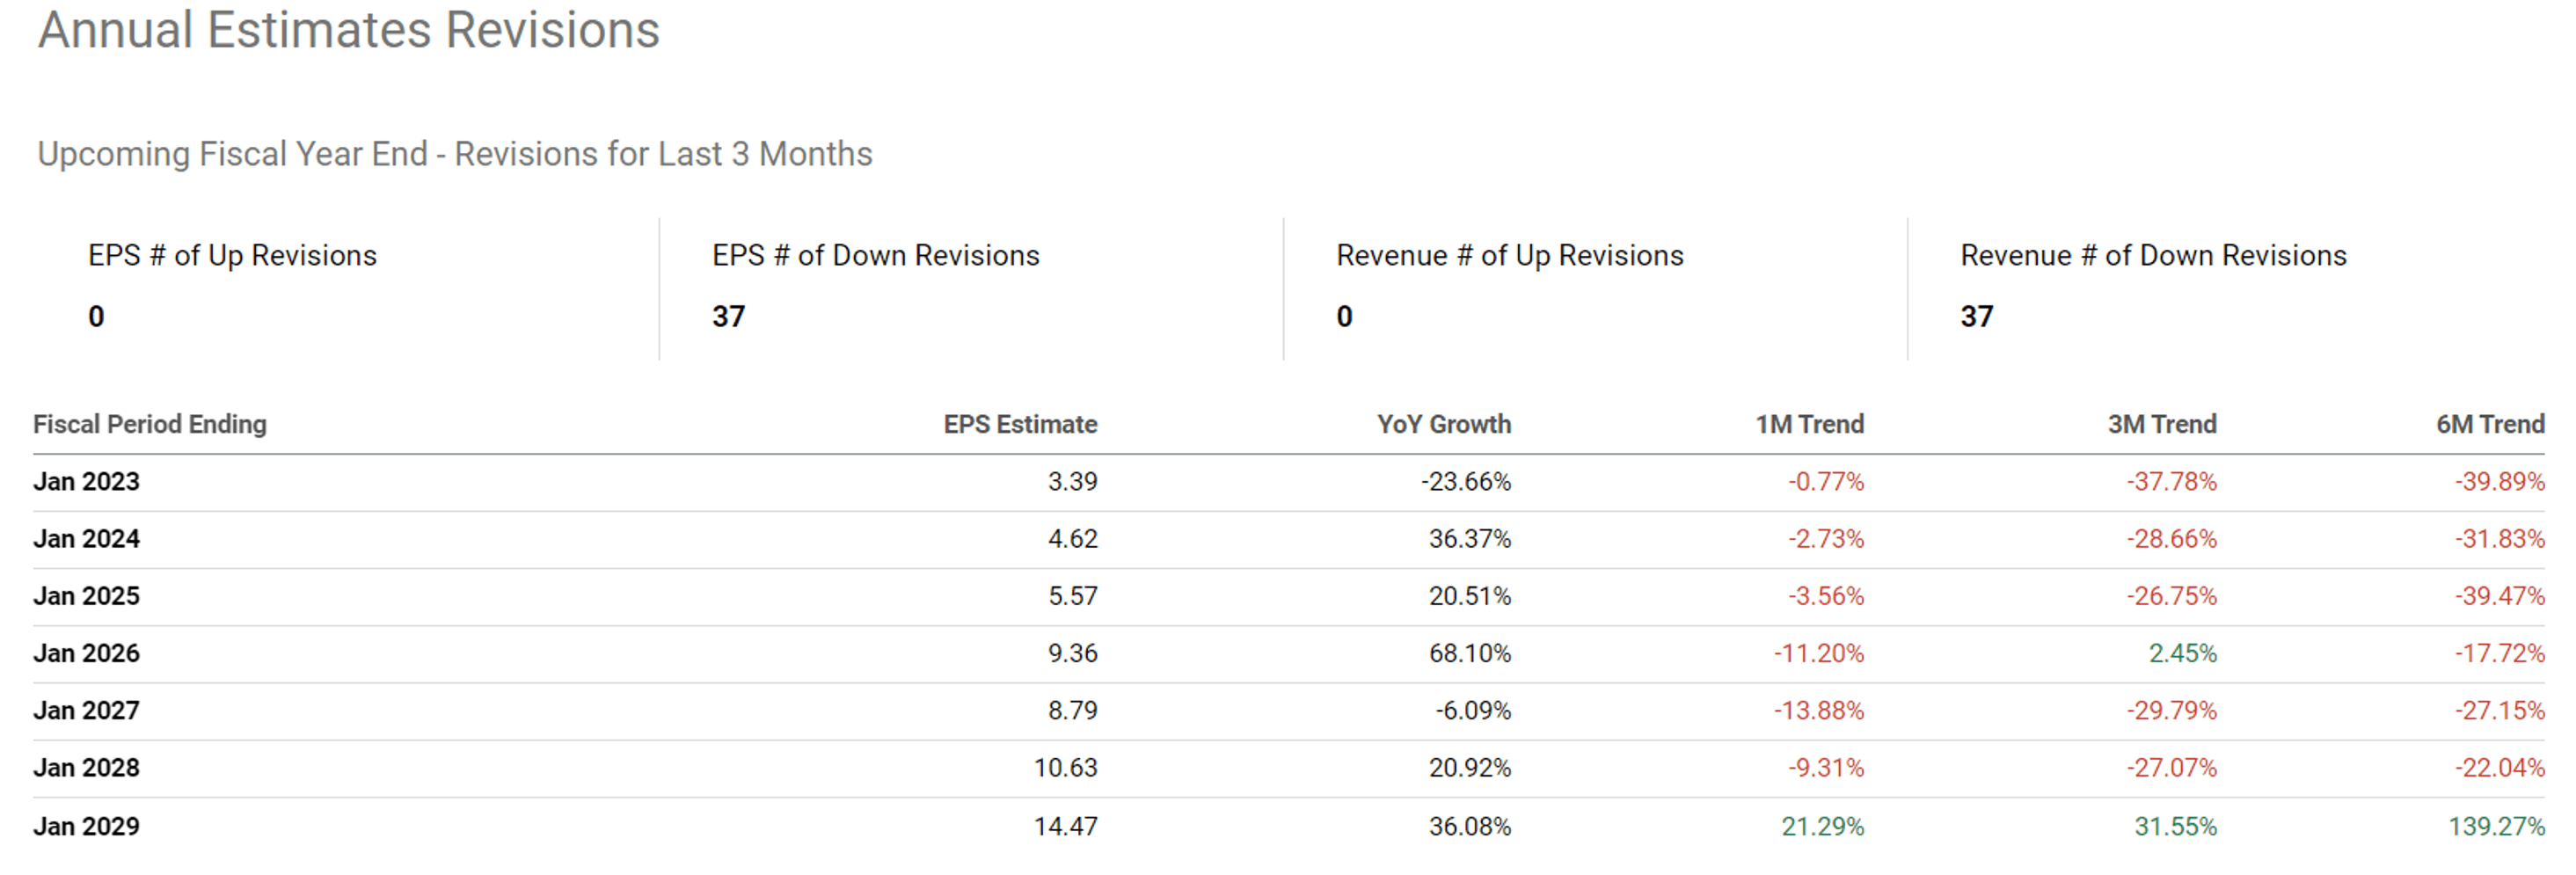
And consensus estimates seem to reflect this same view as you can see from the next chart below. The earnings revisions for the last 3 months for the upcoming fiscal year paint a quite pessimistic picture. No one expects an EPS growth, and a total of 37 analysts revised the EPS downward. The consensus EPS in 2024 and 2025 are now in the range of $4.6 to $5.6, about 32% and 39% lower than they were only 6 months ago.
Source: Author based on Seeking Alpha Data Source: Seeking Alpha Data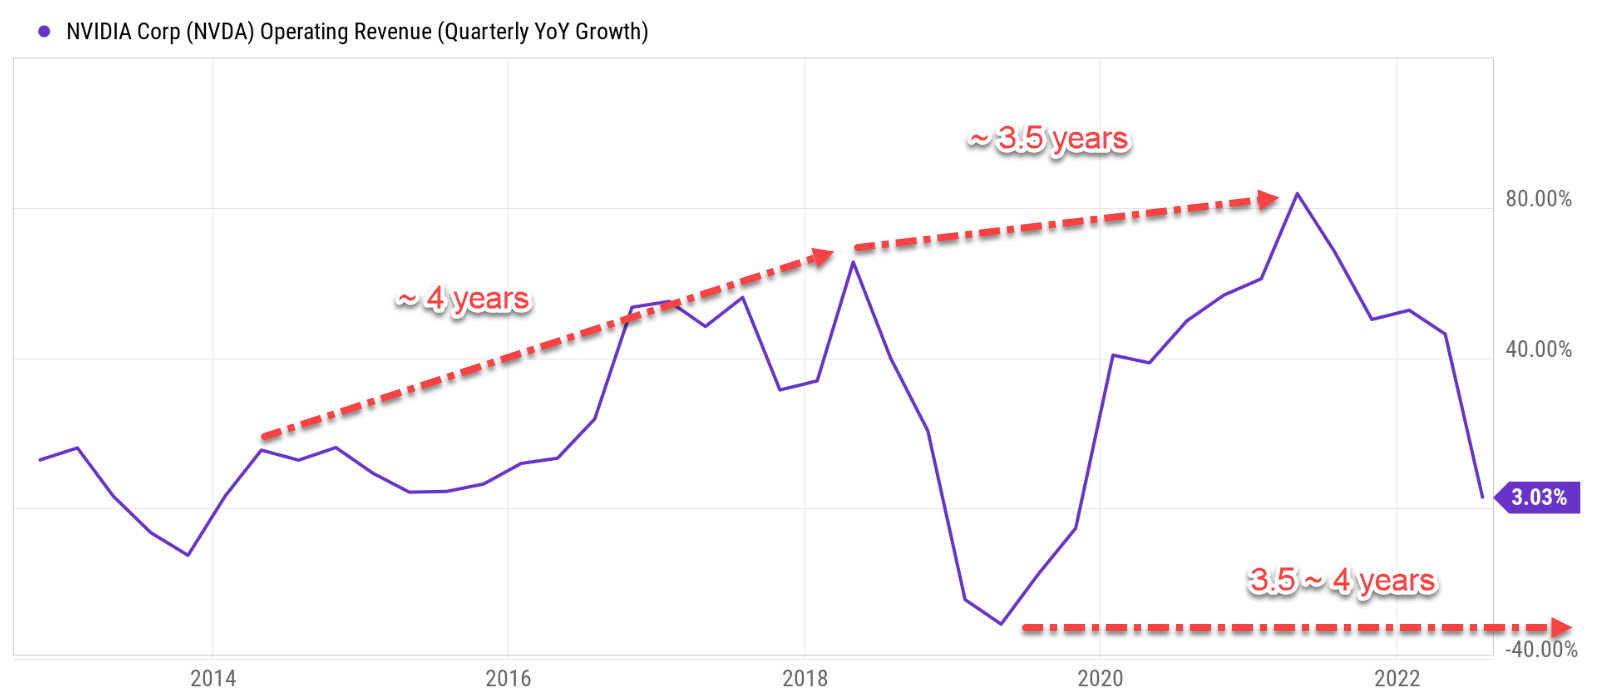
Second, its current valuation is more reasonable but still elevated. As mentioned above, the recent correction has brought NVDA’s valuation to a more reasonable range both relative to its historical valuation and relative to its peers. To wit, it is currently valued at around 47x P/E on an accounting basis or about 35.6x on an owner’s earnings basis, compared to about 90x at the beginning of the year. But such a valuation is still expensive. As you can see, it is at a 34% premium relative relatively to AMD’s 35.3x P/E, and at a premium of more than 100% compared to NASDAQ 100’s 22.0x P/E.
Source: Author based on Seeking Alpha Data
Final thoughts and other risks
To reiterate, my overall conclusion is that long-term investors like myself can wait for a better opportunity given its still-elevated valuation and growth prospects. While for short-term investors, there might be some interesting swing-trade opportunities ahead.
Given the deeply cyclical nature of the business and also its stock prices (see the chart below), I foresee a trading window between $125 and $200 in the next one or two years. These prices translate into a P/E in the range of about 25x to 40x basis on the EPS consensus estimates between $4.6 to $5.6 as mentioned above. As you can see from the chart below, the stock is currently 57% off its recent high. And in the past two decades or so, the stock has suffered corrections as large as this current one 3 to 4 times (depending on how you count). And the last three times occurred in 2003, 2008, and 2011. And all of them took about 2 to 3 years for the price to break even to the pre-correction level. If history is of any guidance, this is the amount of time that I anticipate the stock to spend in this round of downturn also.
Source: Author based on Seeking Alpha Data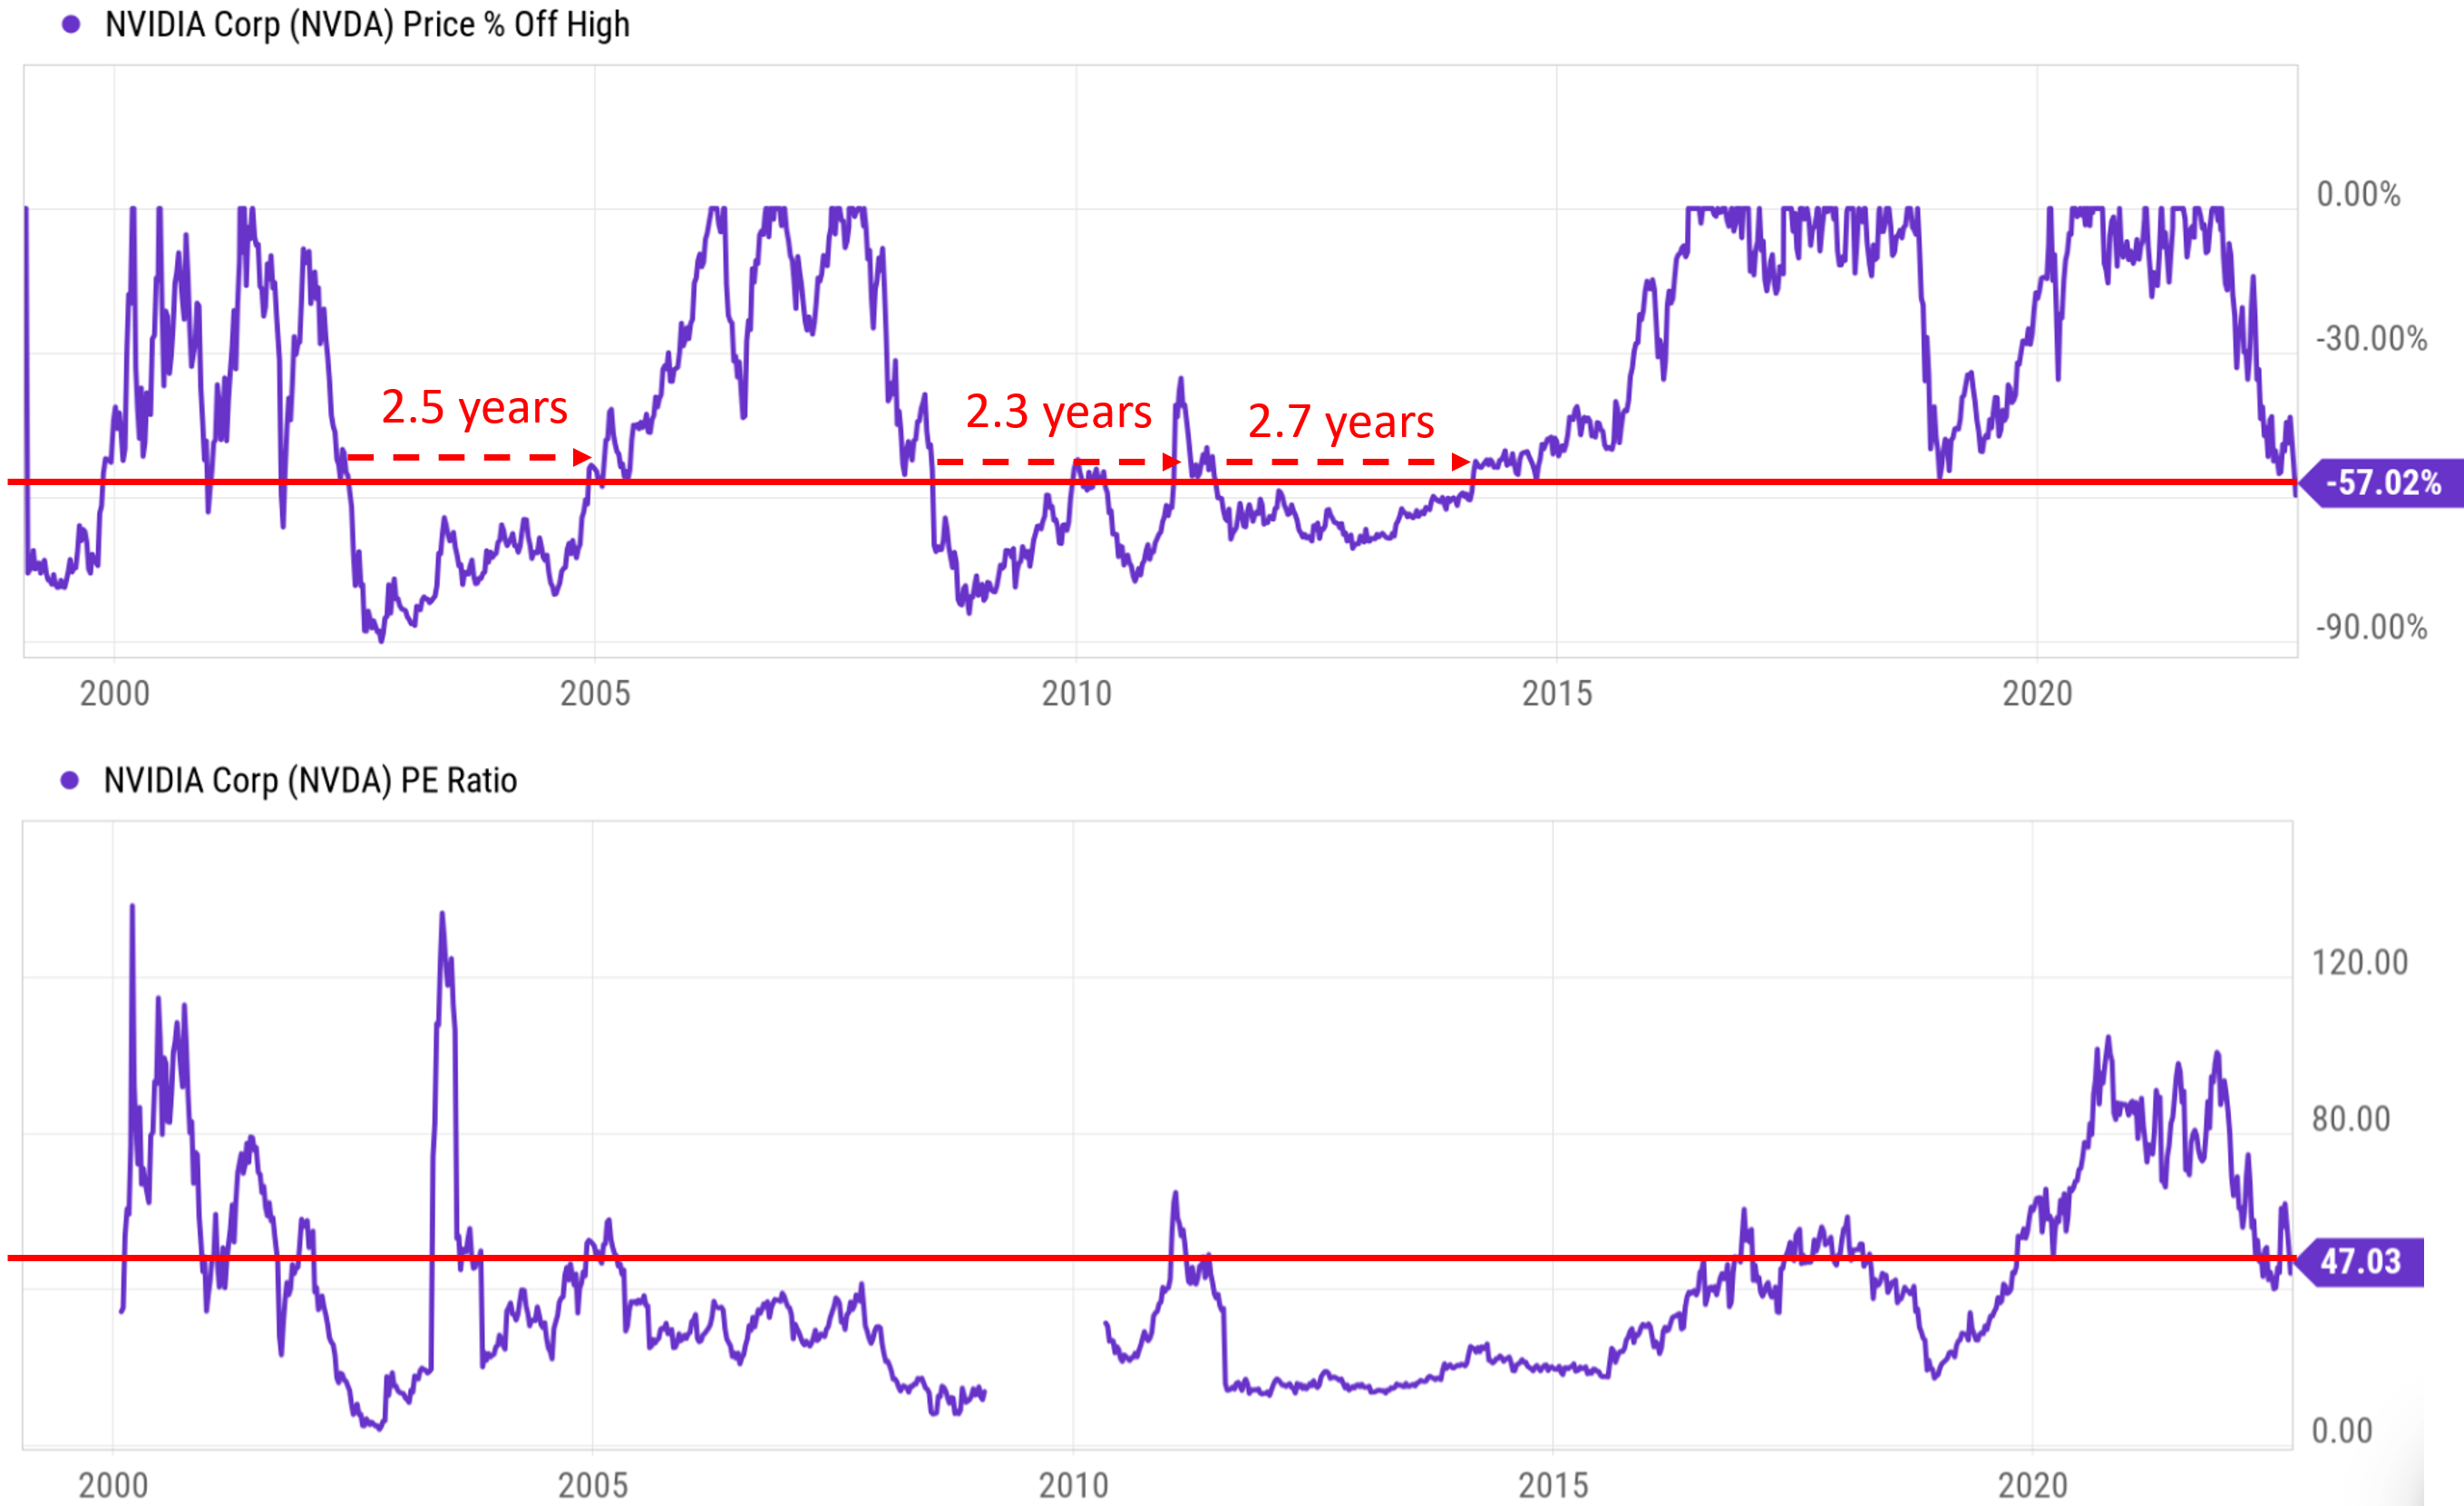
Finally, risks. Besides the deep cyclicality, NVDA also faces many other risks. These risks include macroeconomic risks, high inflation, supply chain interruptions, et al. NVDA’s products also have considerable exposure to the cryptocurrency mining business. And its high-end and high-margin products are particularly sensitive to the possibility of a recession. All these risks have been detailed by other SA authors and also by myself previously. Here, I will just focus on two risks that are specific to the trading window projected in this article.
First, it is never easy to precisely time the cycle even if the cycle repeated regularly in the past. Second, as you can see from the chart below, sometimes the cycle can be so deep that peak valuation can occur at the bottom of the cycle as marked by the green line below. And vice versa, bottom valuation can occur at peak prices as marked by the red lines below. Both long-term investors and swing traders should be aware of such traps.
Source: Author based on Seeking Alpha Data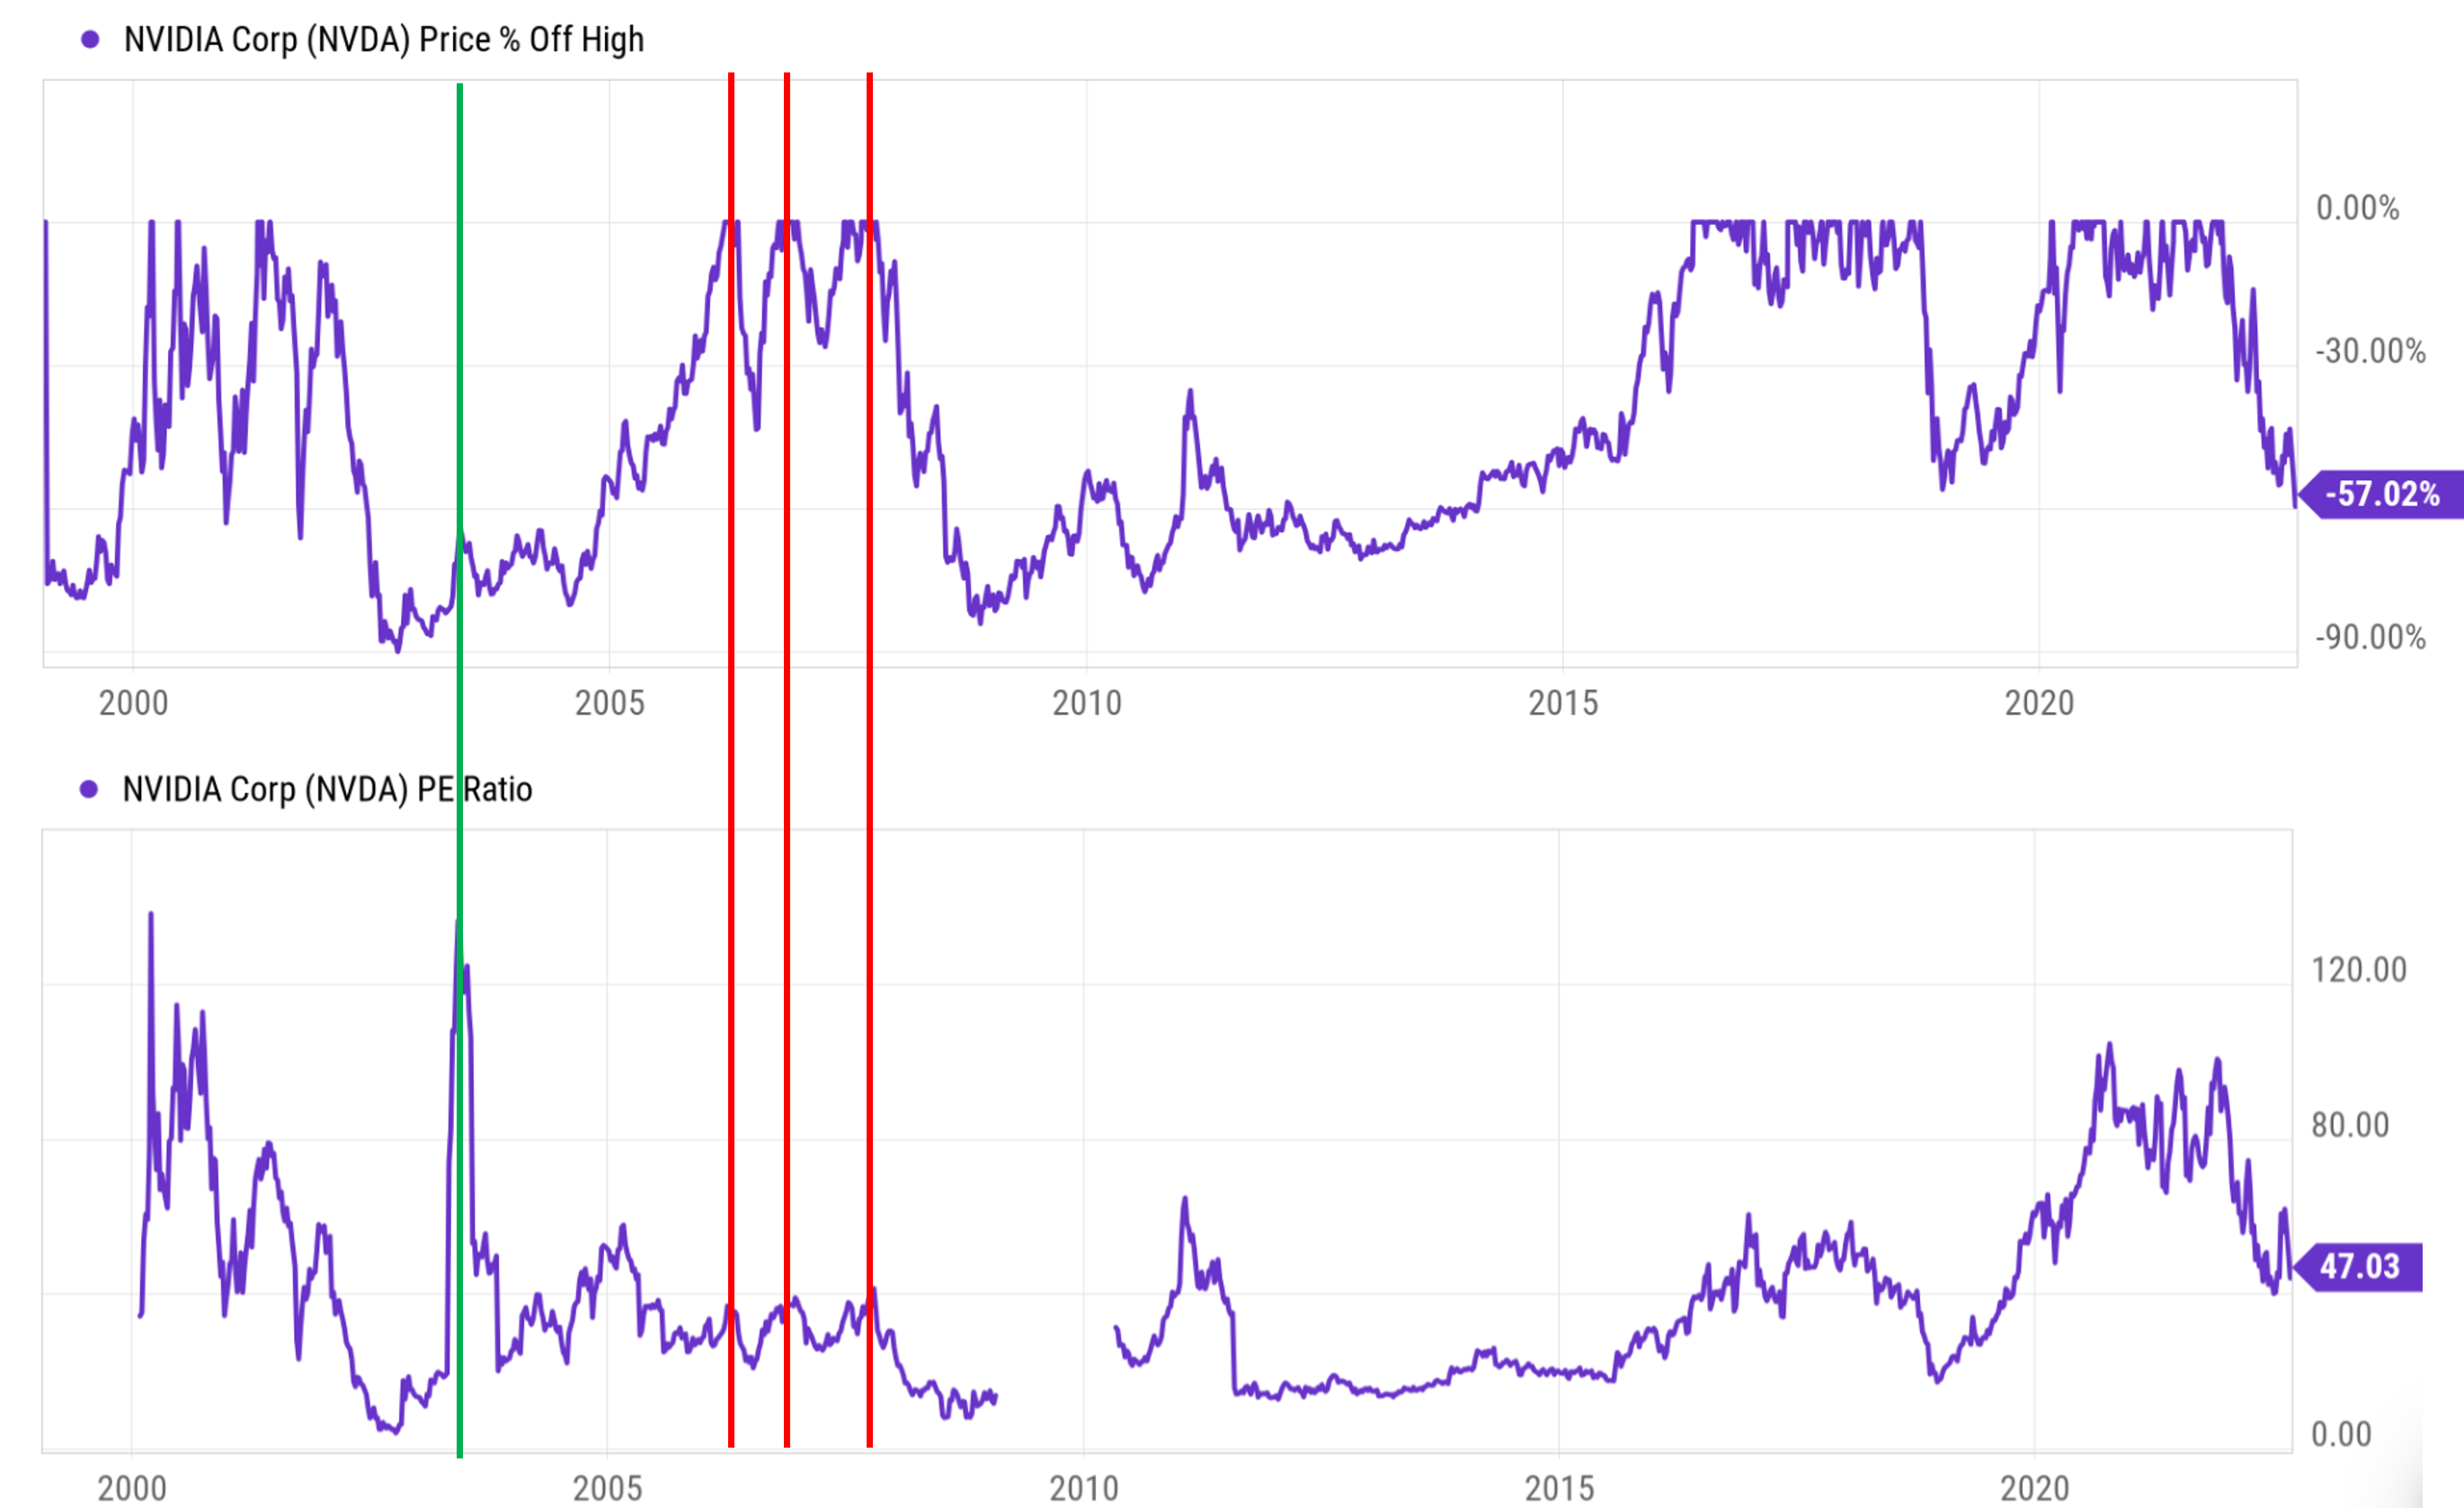
Be the first to comment