

Ismed Syahrul
Since the Great Financial Crisis, we have seen one of the best bull markets ever. Most stocks have performed pretty well within this time, but some have accomplished even more extraordinary returns. For me, it seemed that the market deemed some stocks as the “ultimate” investment—untouchable companies with no risk of earnings downturn or price depreciation of the shares. As we have seen this year, no company is untouchable or immune to a downturn in the economy. The harsh environment 2022 presented has even brought down stocks like Alphabet (NASDAQ:GOOG) (NASDAQ:GOOGL), Microsoft (MSFT), Nvidia Corporation (NASDAQ:NVDA), and Adobe (ADBE).
YTD performances (koyfin.com)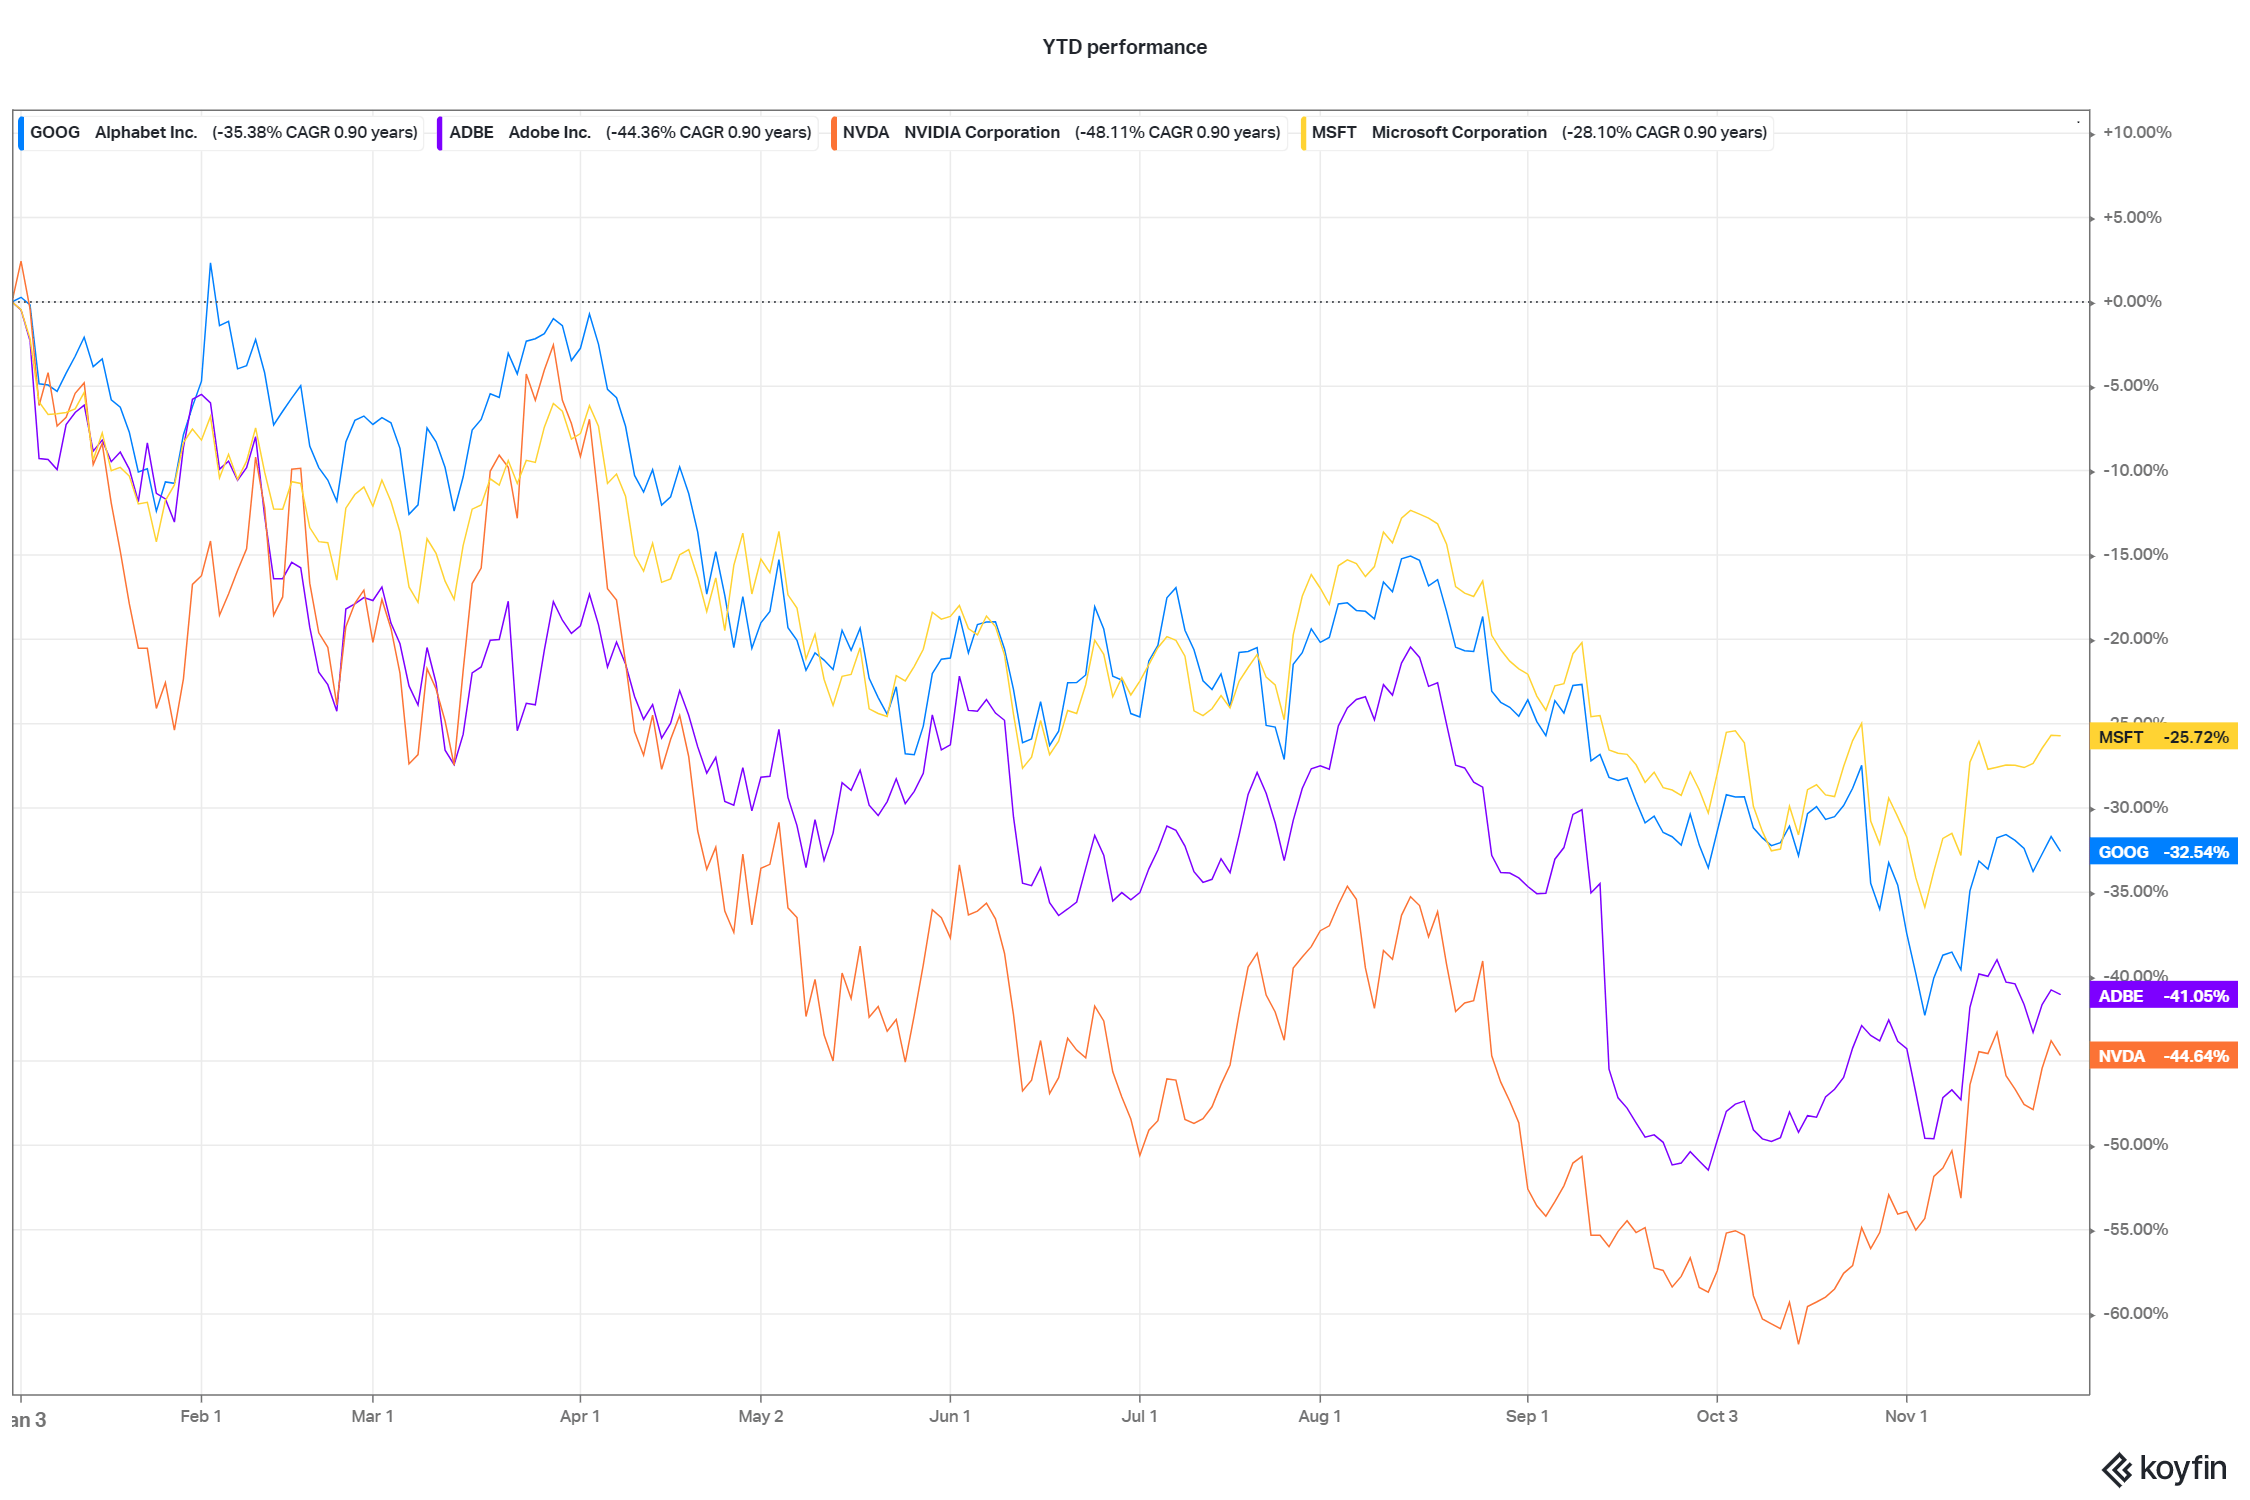
I call these stocks “Fallen Angels” because of their characteristics as former highflyers now down this year. I want to show you how earnings and expectations have changed, how the outlook is, and if the valuation provides a “fire sale” despite the current market environment. The first article of this series was on Alphabet.
For this article, you must know that I am not as bullish as the general market seems to be right now. After the October CPI report was published on 11/09, the market rallied substantially. The CPI report showed signs of slowing inflation, with a YoY growth of just 7.7% vs. 8% expected and 8.2% prior. On an MoM basis, October inflation rose by 0.4% against the 0.7% expected. The market hopes inflation has peaked and the FED has more room to slow down – or stop – the rate hikes. I am not so sure about that due to two main reasons:
- We still talk about a 7.7% inflation rate, way above the FEDs goal of 2%.
- Powell has made it clear that he will do anything to bring down inflation at least close to the 2% goal.
So far, Powell has done precisely what he said he would do, which is why I don’t understand the expectation that he won’t continue with that. Furthermore, history shows that most of the downturn in bear markets occurred after the fed pivot.
The S&P 500 in correlation to fed pivots (elliottwave.com)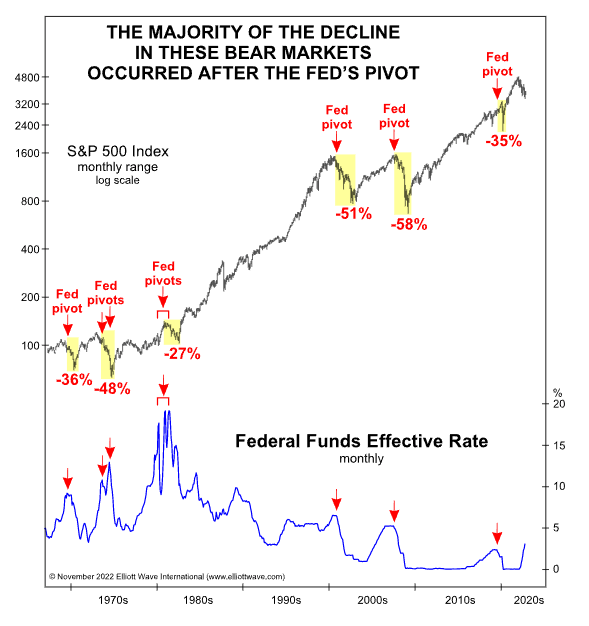
So even if the fed pivots now, we can’t be 100% sure that this means a bottom for the market. Hence, I see the current gains more as a mixture of a year-end rally and midterm gains, expecting the market to turn down next year when we see the full consequences of those rate hikes.
But now, let’s start with the second stock of this series:
Nvidia Corporation (NVDA)
NVDA is a stock that got very famous in the last few years. They started as a manufacturer of graphic cards (GPUs), primarily known in the gaming community. The growing need for data centers and GPUs for crypto mining gave NVDA a massive boost in sales and earnings. Accordingly, the stock price has appreciated a lot.
Nvidia’s five-year performance and recent downturn (koyfin.com)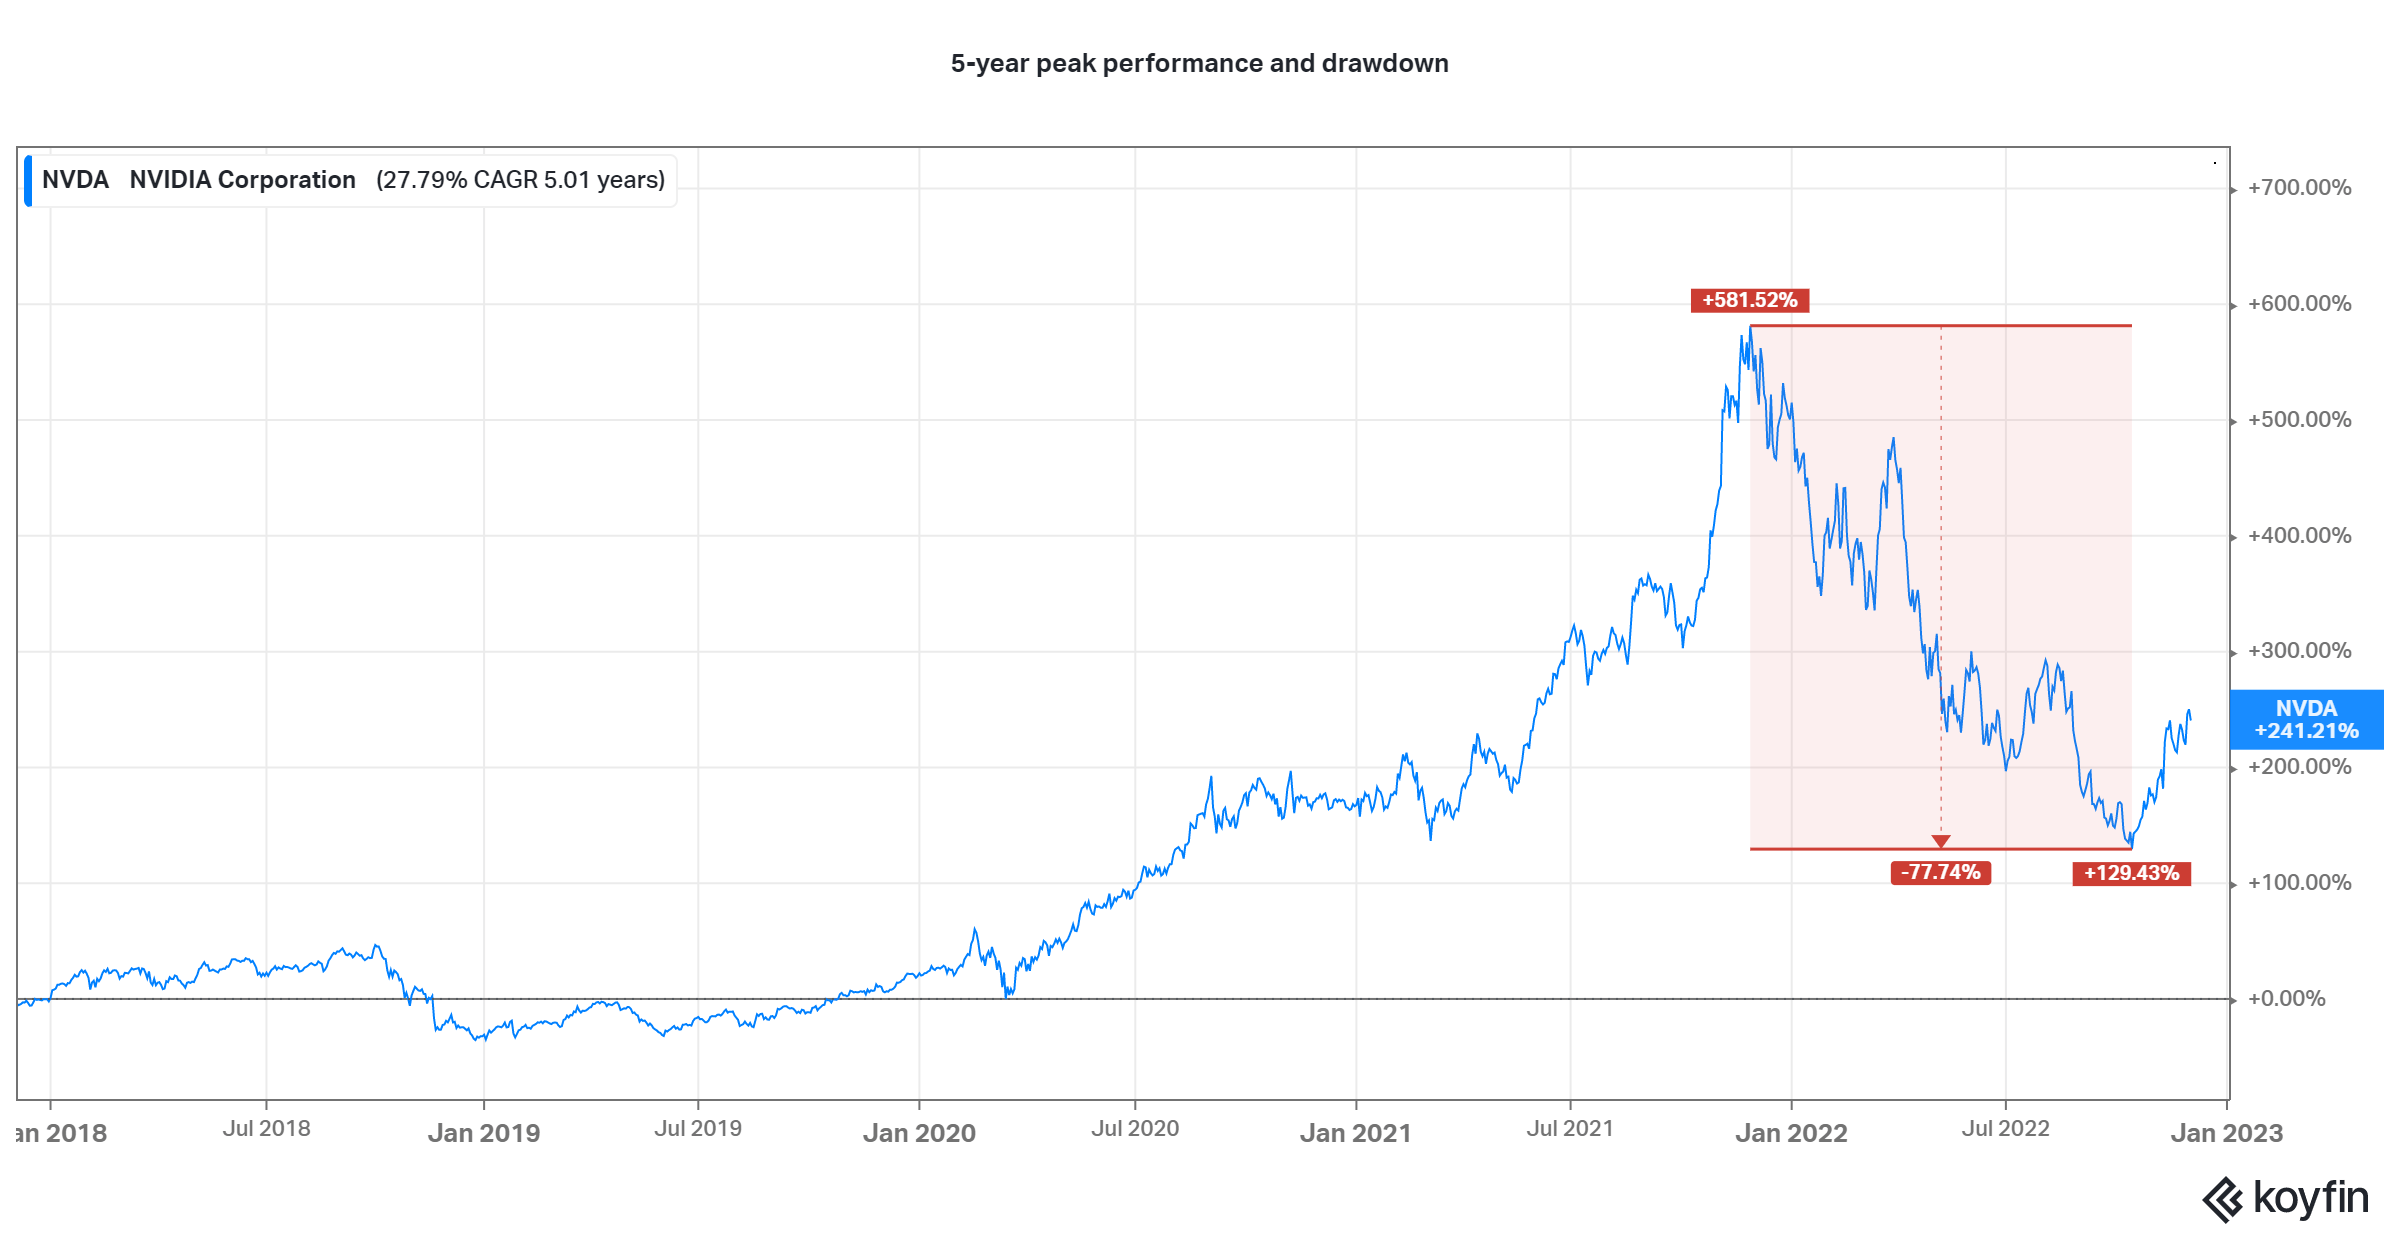
NVDA generated returns of 580% at its peak late last year. Since then, more than 77% of the performance got eliminated at its lows in mid-October. As of now, shareholders who invested five years ago still have returns of over 240% left. That’s 48% annually.
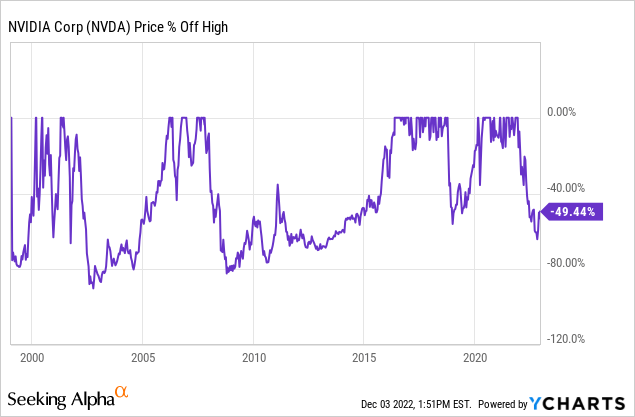
Looking at the all-time chart of NVDA’s drawdowns, we see that the current sell-off of 63% at its peak is not the greatest (yet). Between 2000-2002 (.com bubble) and 2007-2009 (great financial crisis), the stock fell 90% and 80%, respectively. To set this in perspective: these two events count as the most severe bear markets/market crashes of our time. Considering the recent sell-off comes close to the one of 2007-2009 and is way more painful than the Covid crash in early 2020 (-38%), it is fair to say we have a very steep drawdown this year. That qualifies NVDA for this series and further analysis of a potential new buying opportunity due to the decline in share price.
What happened? Since the start of the year, high inflation rates, a substantial decline in crypto mining, and a sales ban for the Chinese market have crushed demand for GPUs. The consequence was a built-up of excess inventory:
Inventory changes (koyfin.com)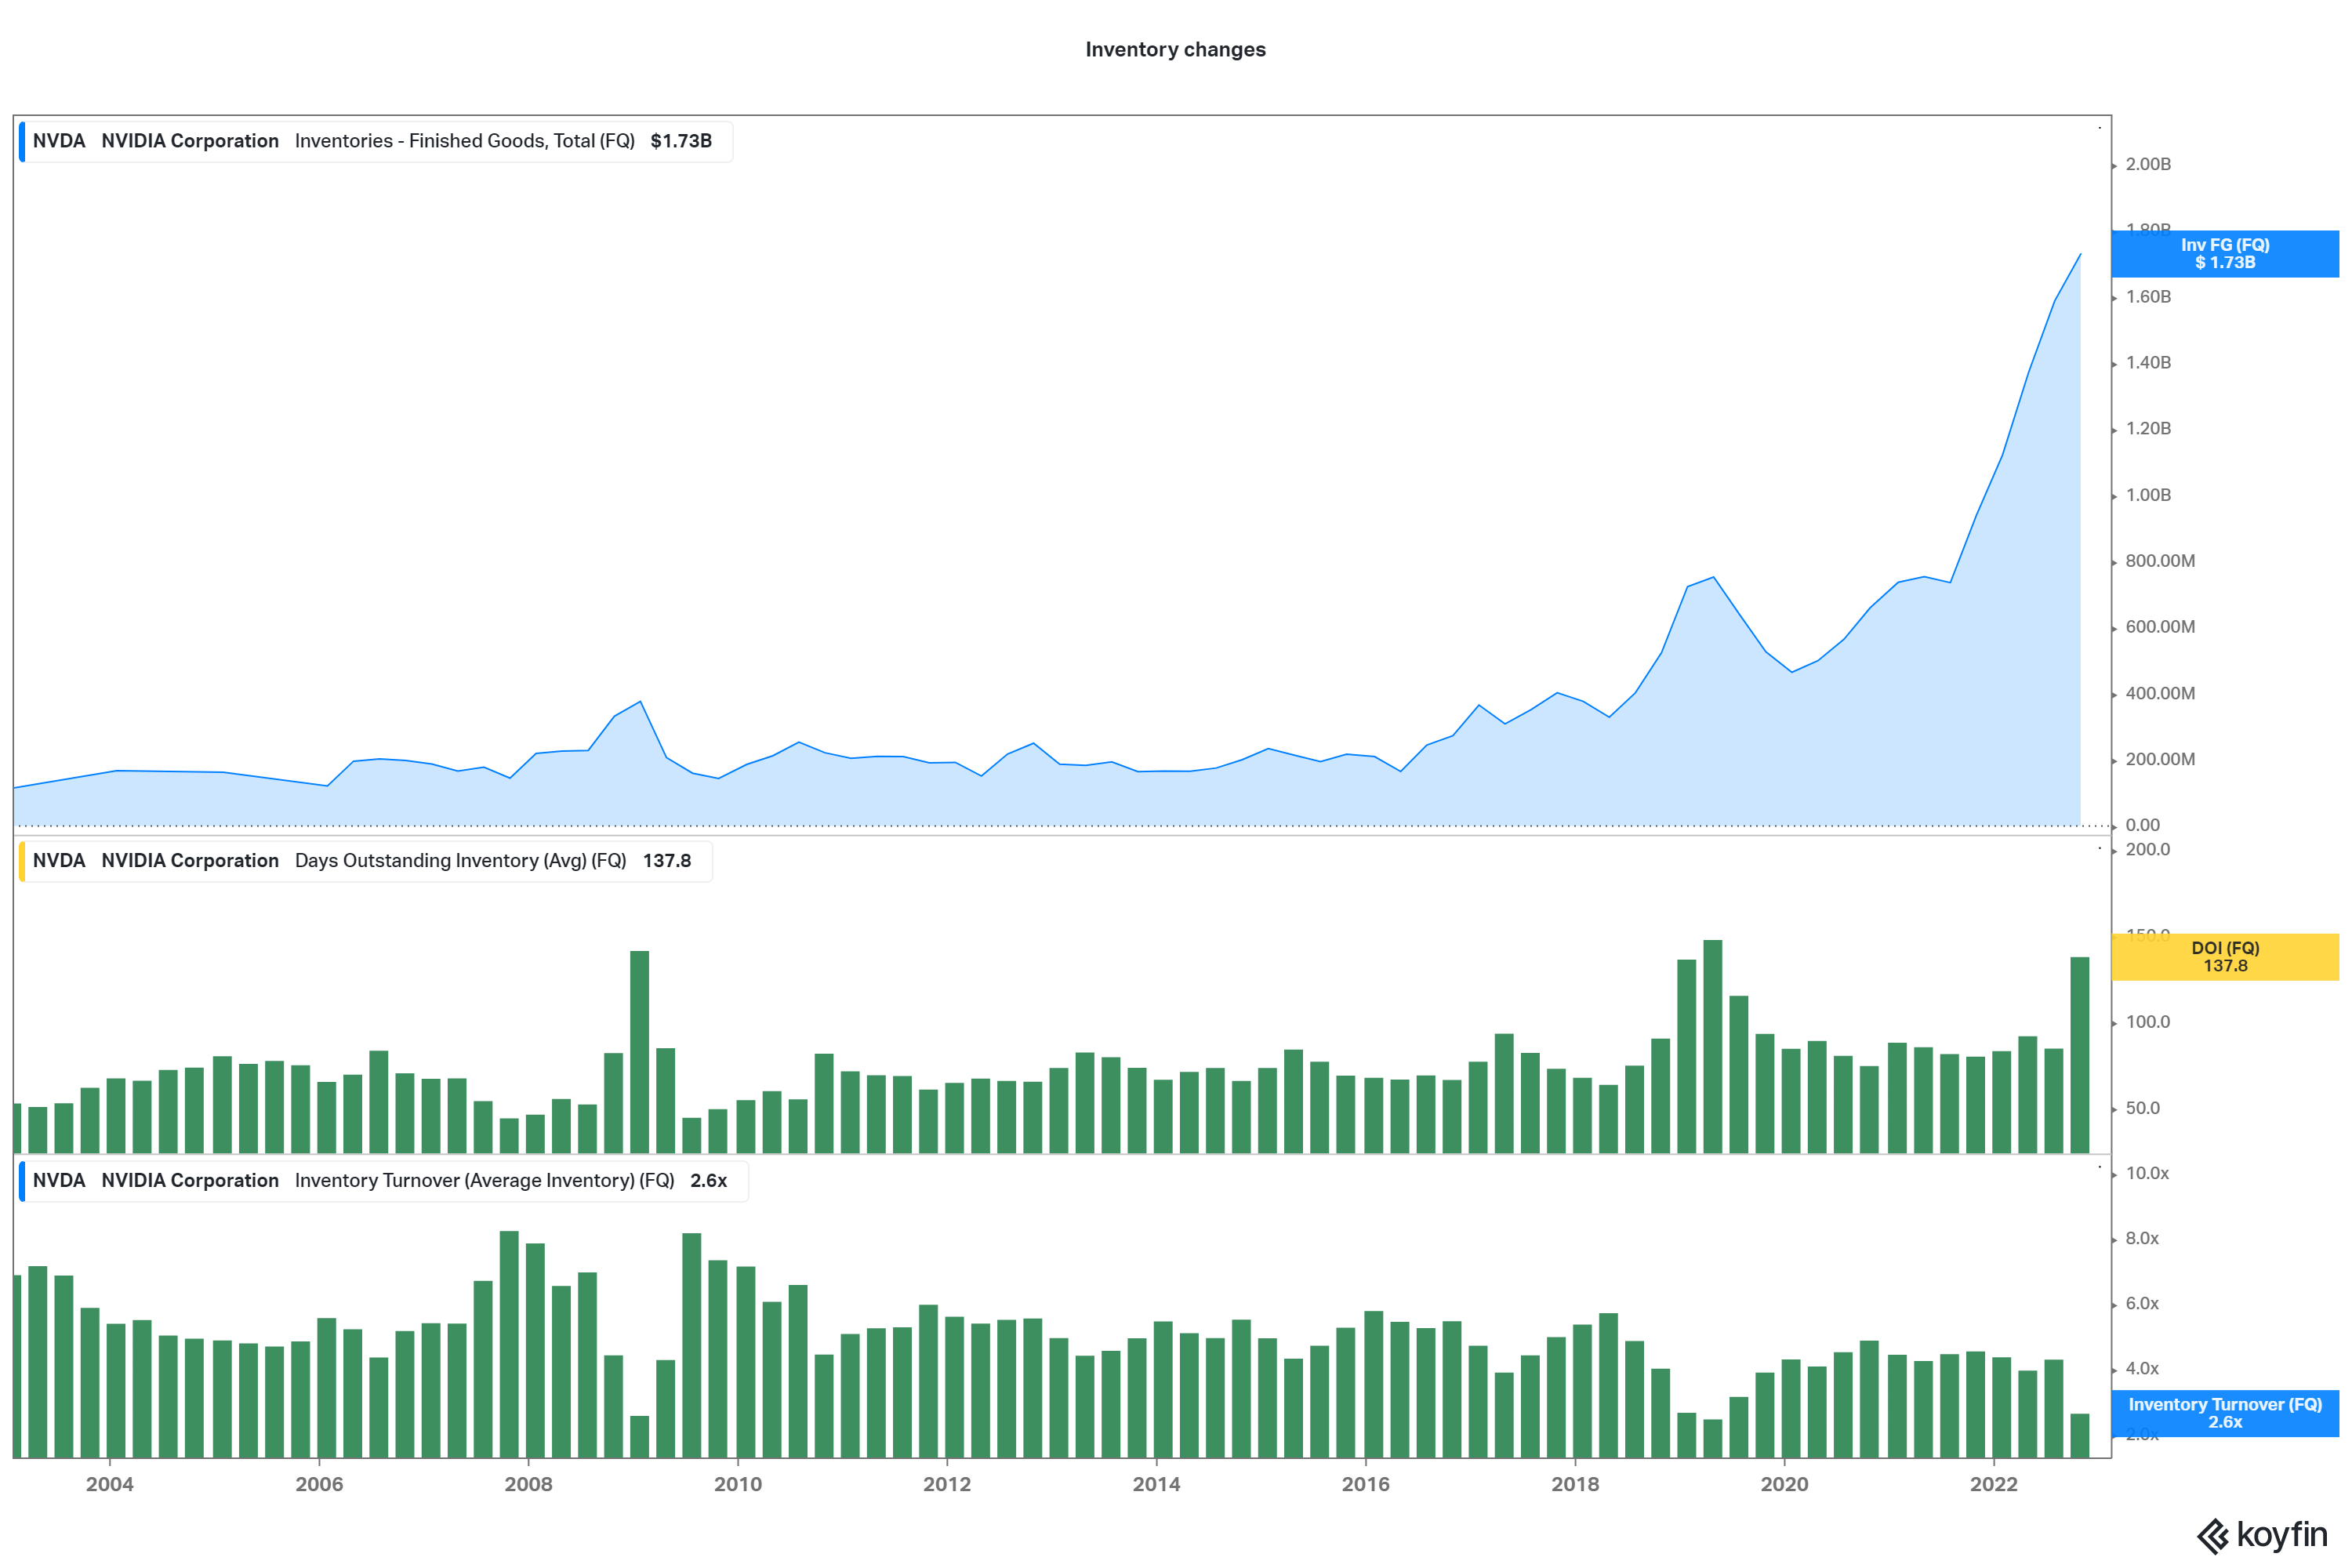
The amount of inventory-finished goods has risen significantly since 2020 and is at its all-time high—way above the previous all-time high of 2019. The days outstanding inventory shows how many days something stays in the inventory. In the last quarter, this metric rose to 13 days from 84 days in the prior quarter. With 137 days, this quarter belongs to the four highest quarters ever. Appropriately, the inventory turnover rate, which shows how fast the inventory is sold, used, or removed, is at its second lowest ever.
Excess inventory, especially in times of a cooling down economy, can pressure the earnings because it mainly needs discounts to load off the excess. Another stock I may write about in this series, Nike (NKE), has similar profits this year. Hence we saw headlines like these: “Nike falls to new low after efforts to clear inventory hit margins“. NVDA still needs to clear excess inventory, so these adverse effects are yet to come. Nevertheless, we already see NVDA’s earnings decline:
Sales and earnings development (koyfin.com)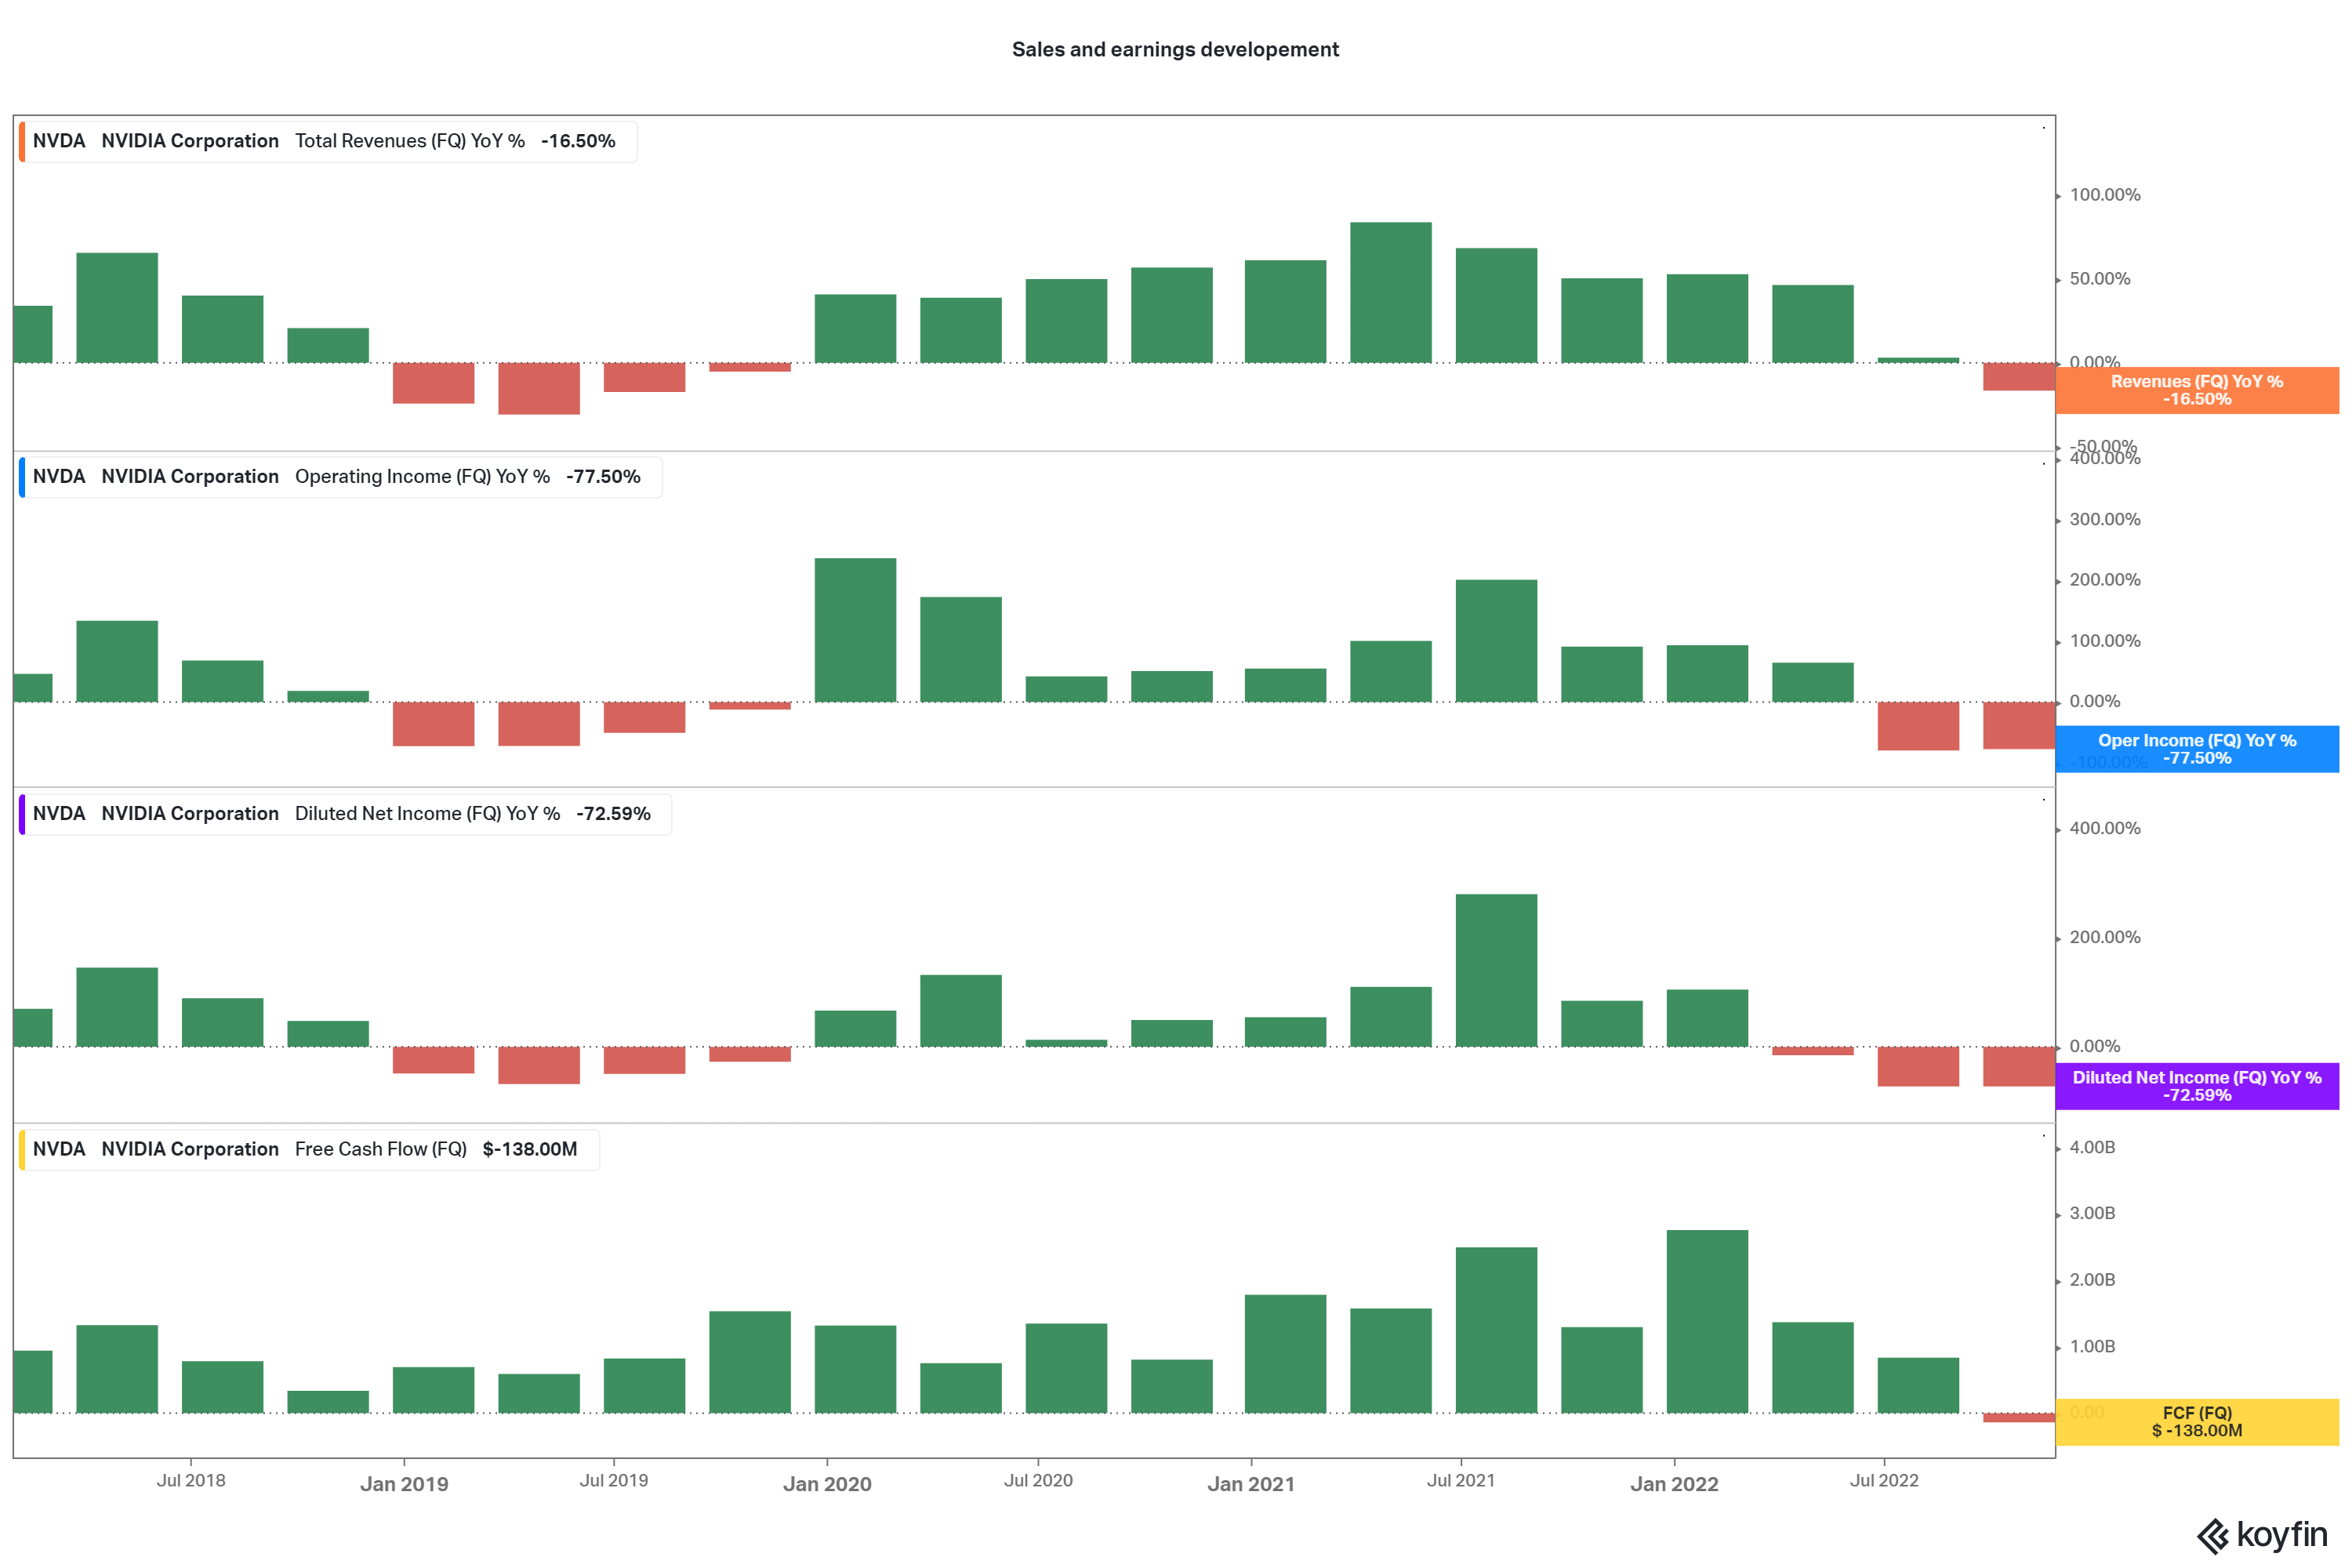
Everything is declining from sales through operating income, net income, and free cash flow. Sales decline of -16.5% is moderate against declines in the past, but still a lot considering the valuation of NVDA. Looking at the decline in operating income, it’s getting worse. In Q3, the operating income declined by 77.5%, which has happened a few times before. Still an enormous drop. It doesn’t get better with net income. The 72.6% decline is the second-highest ever since the great financial crisis. I hope you didn’t think that is the worst it gets because I still have to drop numbers regarding the free cash flow. As you can see in the chart, it is negative $138M. Set in perspective, this means that free cash flow dropped for the first time since the great financial crisis and the most ever. The second biggest negative free cash flow was in October 2008, with $66M.
Why is that?
Looking at the income statement, it gets clear that NVDA hasn’t as big a problem with rising costs as other companies have. They rose YoY, but less than in 2021, and the growth rates dropped in the last quarter. COGS and SG&A were also growing below their means. If you check the timeframe of the last substantial rise in inflation between 2006 and 2008, you can see that costs were quick to rise, as they did this year, but also fast in declining as soon as inflation peaked. So there is a good chance that costs will stagnate and may decline in the coming months.
Costs growth in correlation to the inflation rate (koyfin.com)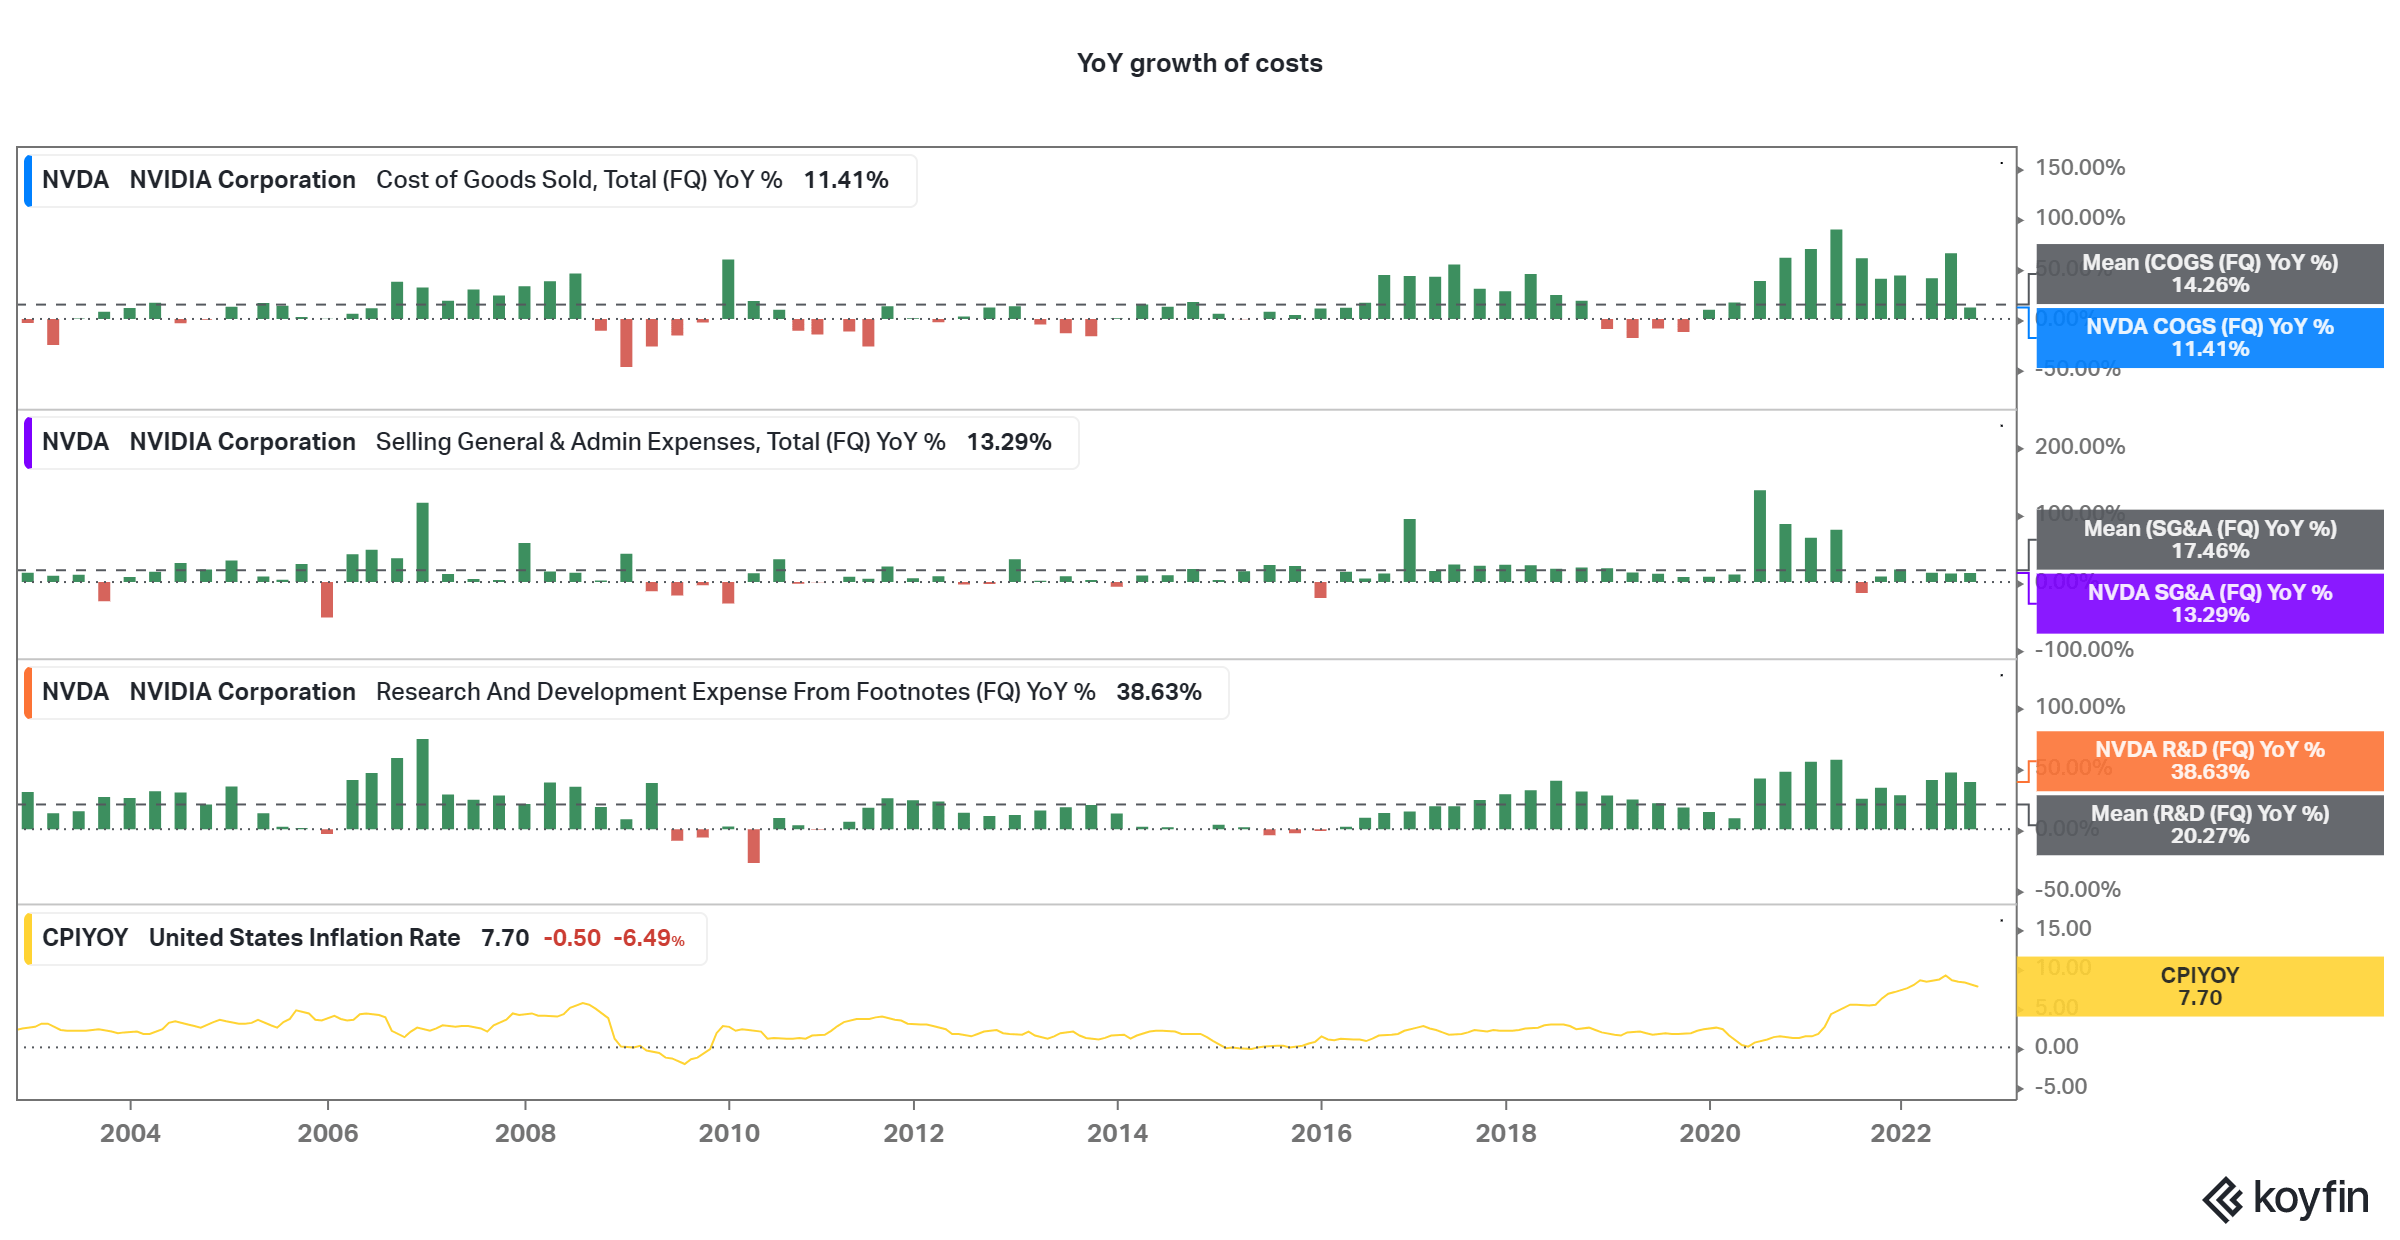
I think it is clear to say that the decline in sales is the main reason why earnings dropped that much. Costs grew rather moderately, which is a good sign, and the growth rates alone (11,4%, 13.3%, and 38%) weren’t high enough to cause >70% declines in earnings. Sales, when they grow and decrease, have a leveraging effect on profits which is seen here.
Declines in earnings were expected by analysts, but not as much as they turned out to be, which usually isn’t a good sign.
EPS actuals vs. estimates (koyfin.com)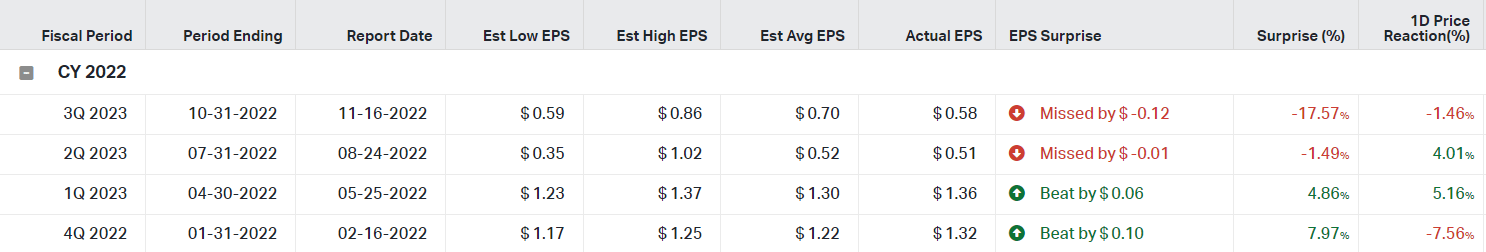
With data going back to 2012, NVDA missed EPS estimates only three times, two of them this year. Additionally, the 17.6% surprise in Q3 is by far the greatest. The second greatest was in Q3 2019, with just -4%. Considering that EPS estimates have been slashed by over 40% this year, a -17.6% surprise is astonishing.
EPS estimates trend (koyfin.com)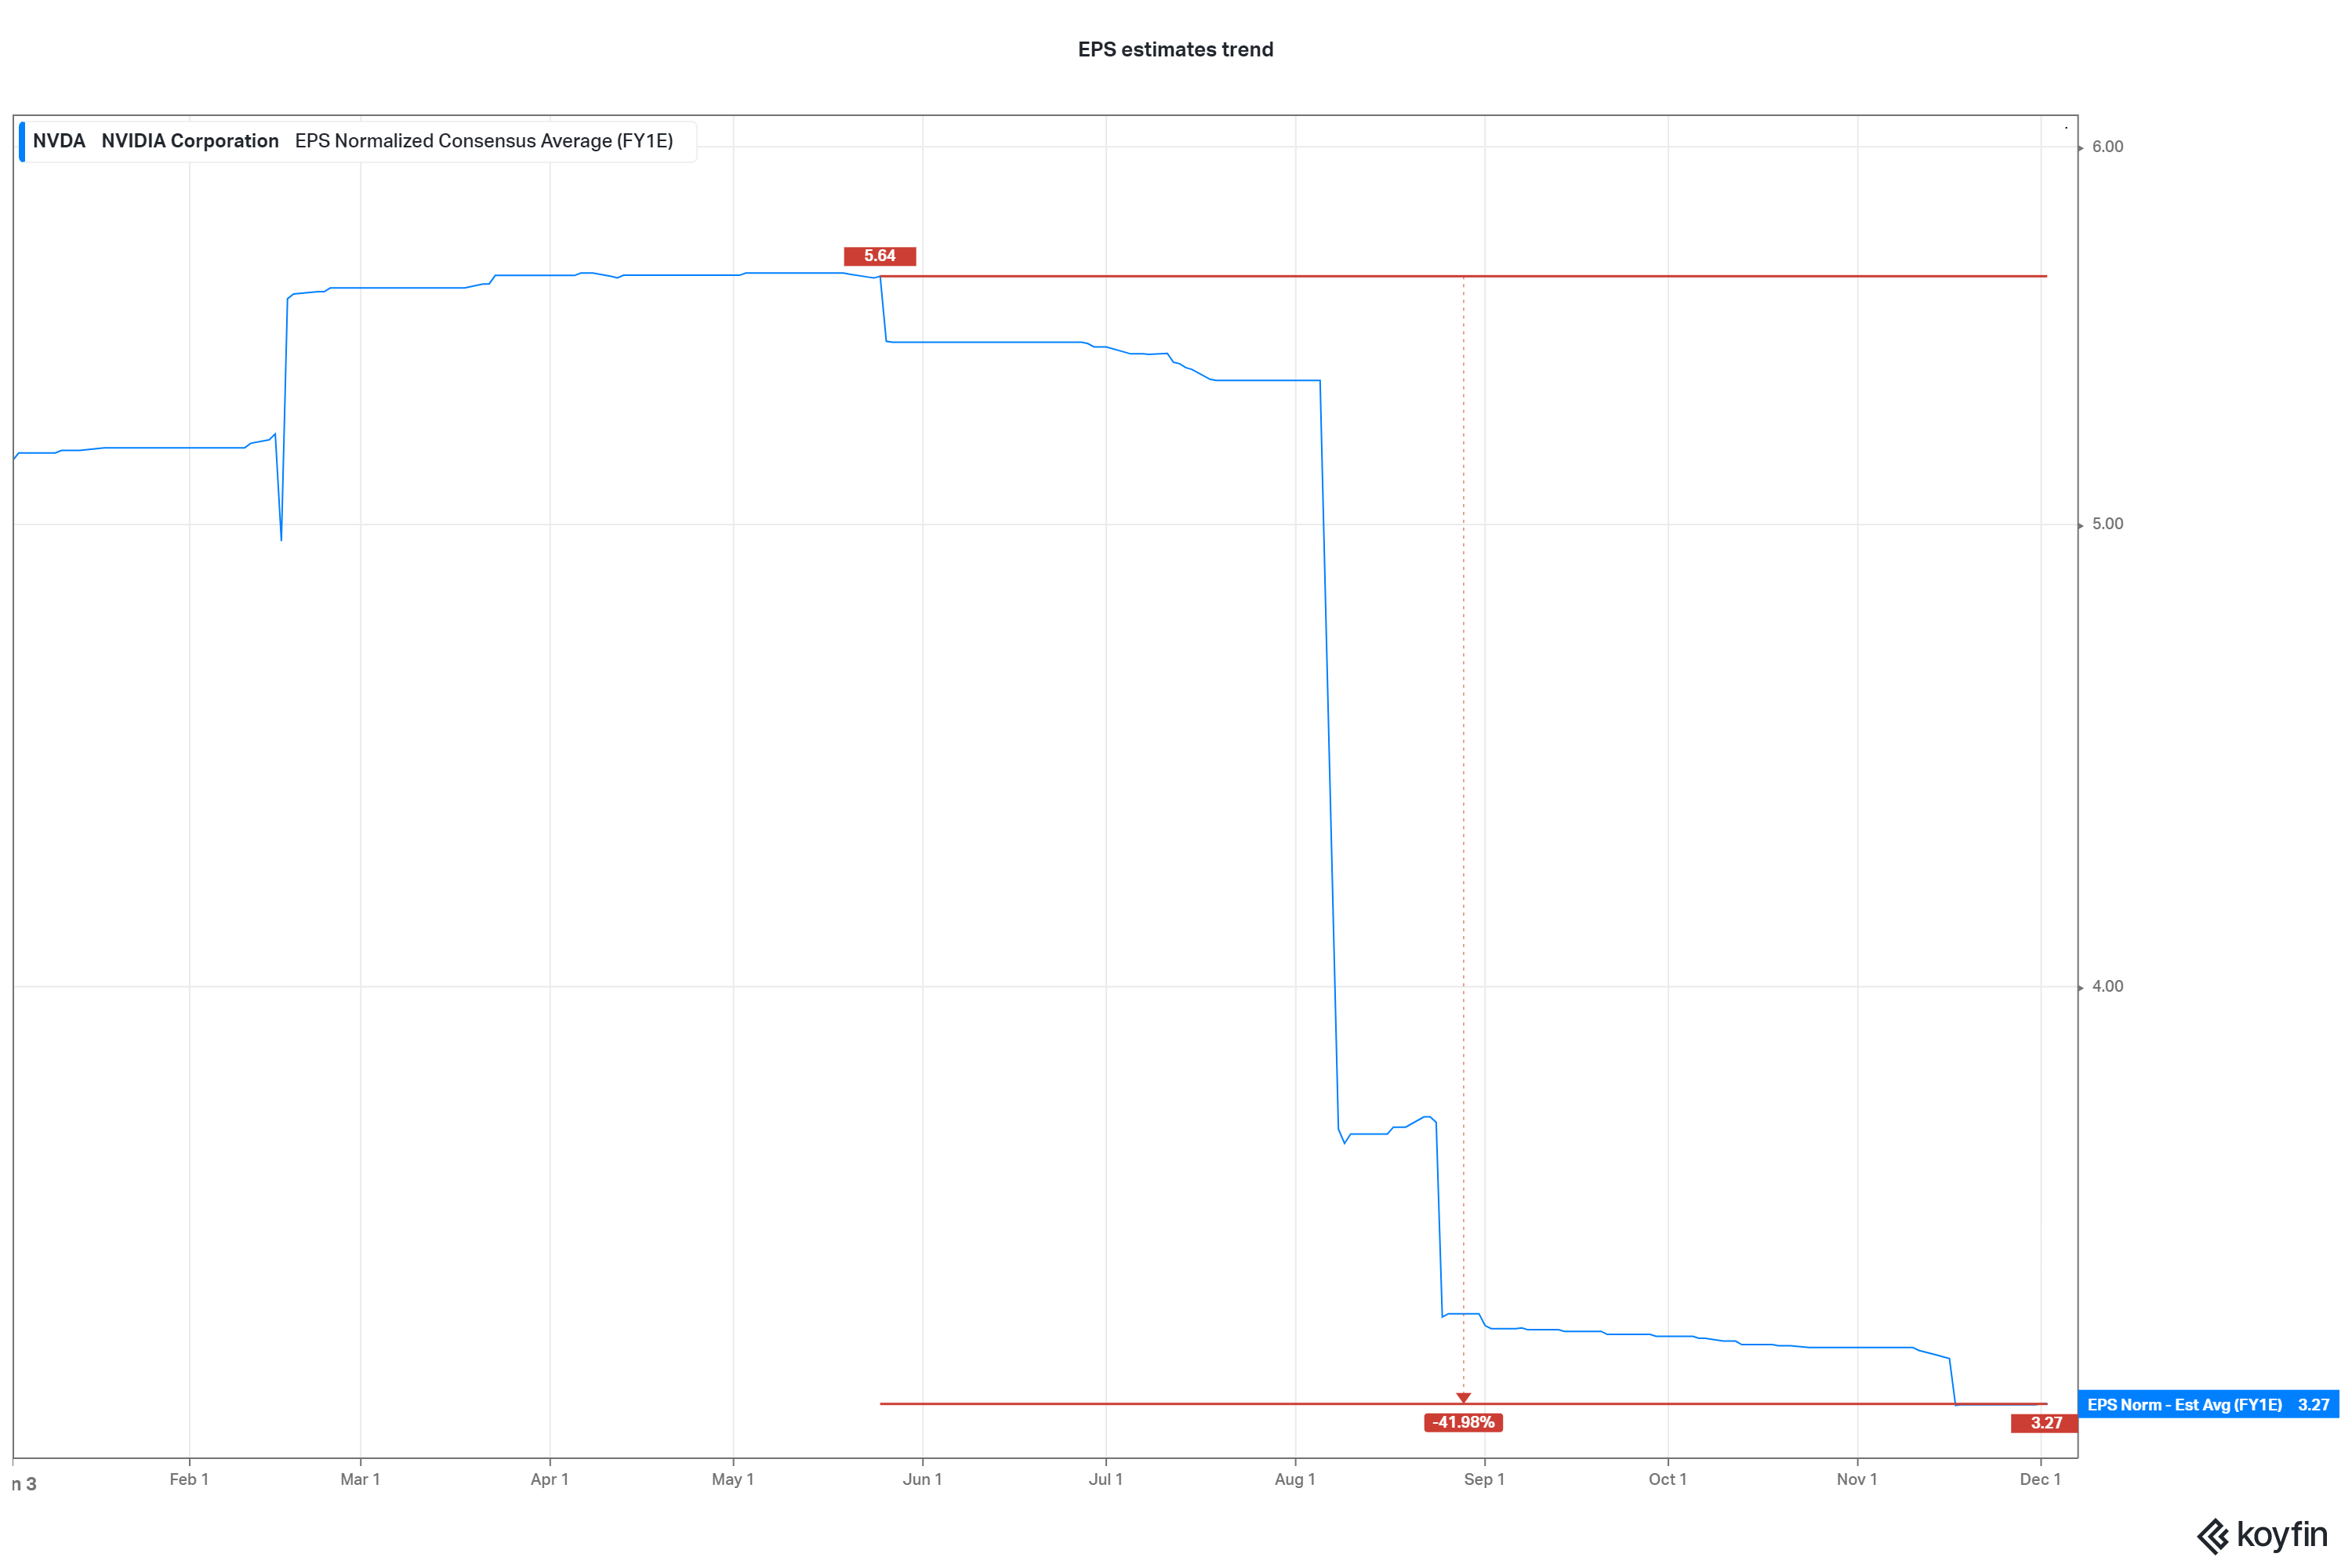
Sales beat expectations throughout the year so far. This is, of course, better than the EPS misses. But sales expectations were also slashed this year – 22% from the peak, to be exact.
Looking a few years further, it gets clear that the previously mentioned problems and the current decline in sales and earnings will influence these metrics for the following years:
Sales and EPS estimates trend (koyfin.com)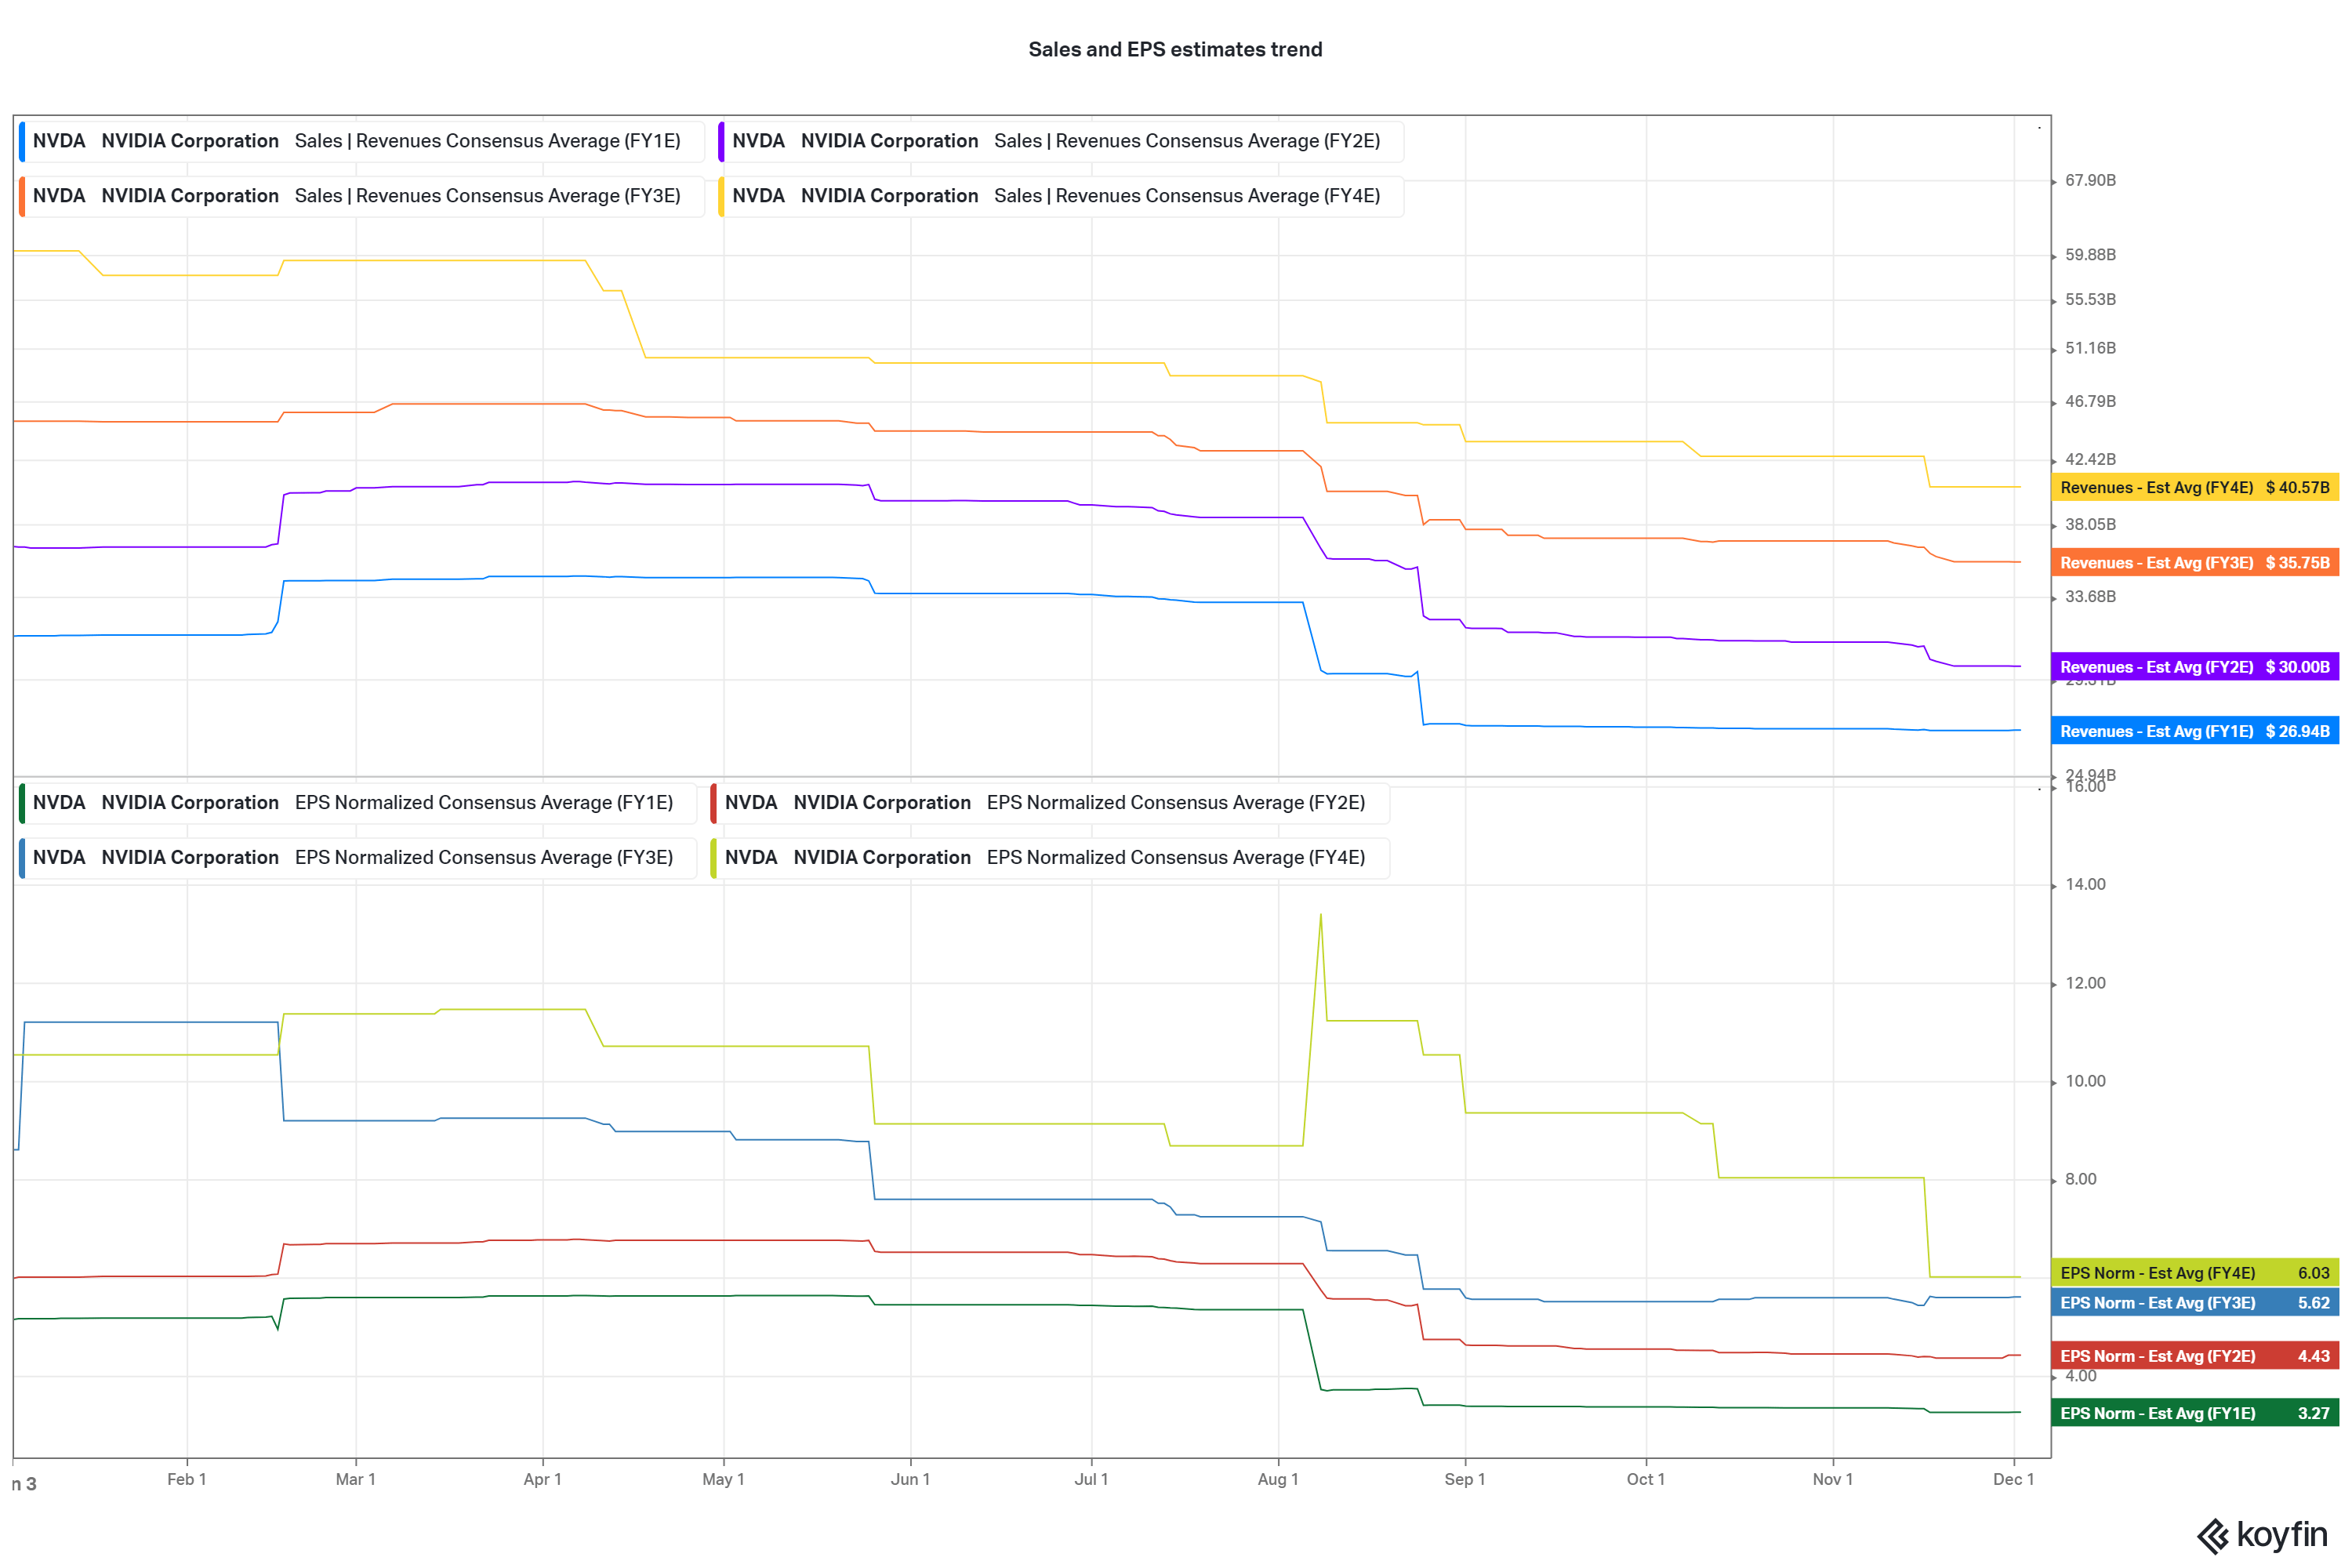
What is there to come for earnings?
As mentioned earlier, excess inventory will probably pressure revenues and earnings as this inventory will only be sold fast enough with significant discounts. Therefore, I predict sales and earnings growth to recover relatively slowly. That prediction aligns with the current analyst’s estimates, who expect sales and earnings to have bottomed now and increase quarterly. On a YoY basis, both will decline, but less than before.
Sales and gross profit estimates (koyfin.com) EBIT, Net Income, EPS estimates (koyfin.com)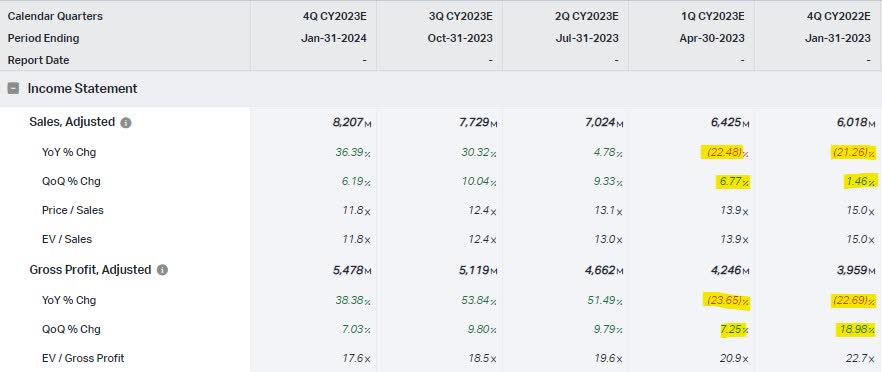
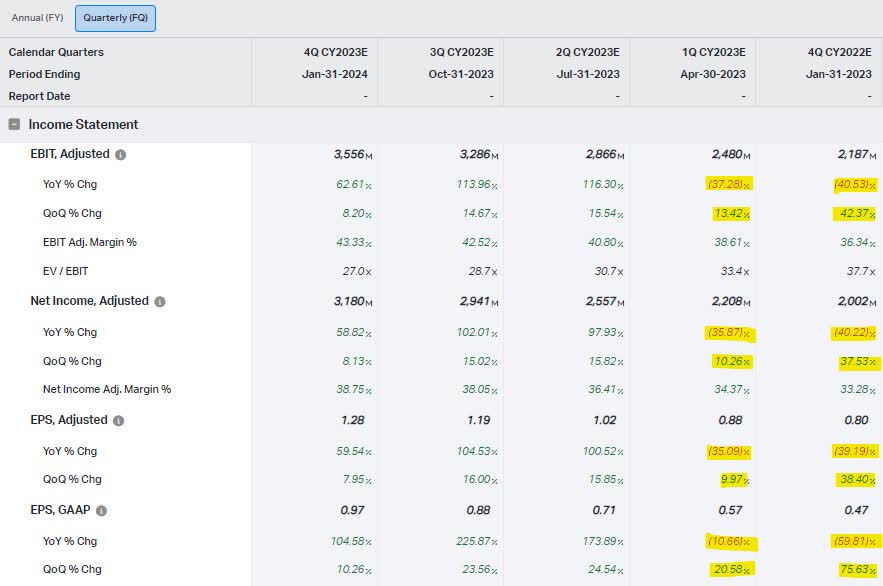
Due to the inventory problem, I expect the recovery of sales and earnings to be slower than the analysts. If mine and the analyst’s predictions are correct, that would mean that the worst is over for earnings. Therefore, share price losses shouldn’t occur due to worsening earnings. What could happen is that NVDA’s share price will be pulled down with the overall market. Let’s look at future bear markets to assess that risk:
In the bear markets of 2001-2003 and 2007-2009, NVDA’s share price declined by 90% and 85%, respectively. This was while, in both timeframes, earnings fell almost the same as this year. This alone would suggest that NVDA’s shares need to decrease even further since this year’s low was just -70% and -55% at current prices. But NVDA is a more mature company than in the earlier timeframes. There is a much more profound product portfolio and better prospects. Therefore it wouldn’t be reasonable for the share price to fall as much as in previous bear markets.
After analyzing the current problems and their consequences, we must assess whether the valuation makes up for that. The short answer is: no. Let me show you why:
FastGraphs five-year chart (fastgraphs.com)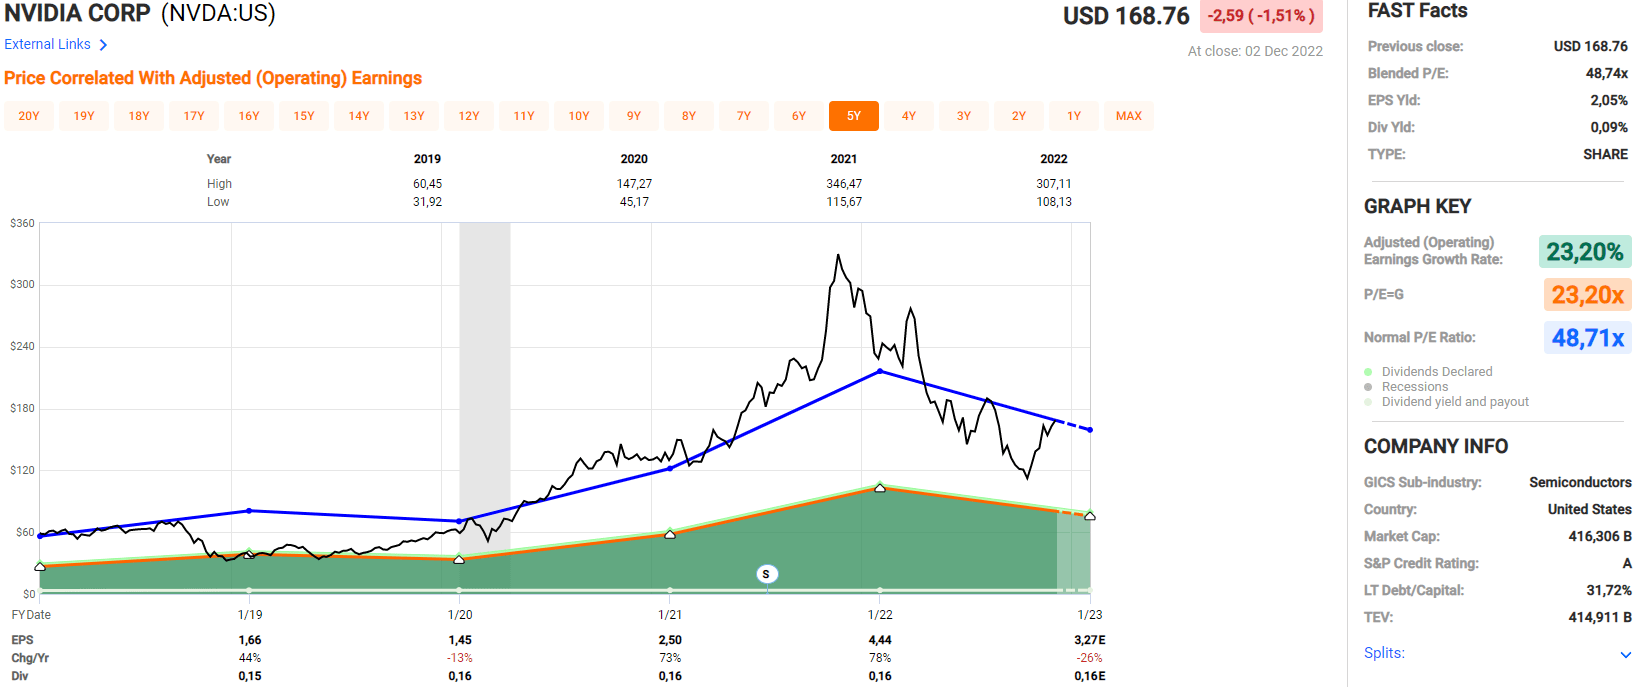
In the last five years, NVDA’s earnings rose by 23.2% annually. So the fair value, according to FastGraphs, which uses the growth rates as a P/E multiple, is 23.2x earnings. Nevertheless, NVDA traded at an average of 48.7x earnings in the last five years. At its lowest share price in October this year, NVDA traded for 31x earnings which is higher than the fair value but a lot less than the average multiple. We can now buy NVDA exactly for its average five-year earnings multiple.
FastGraphs forecast chart (fastgraphs.com)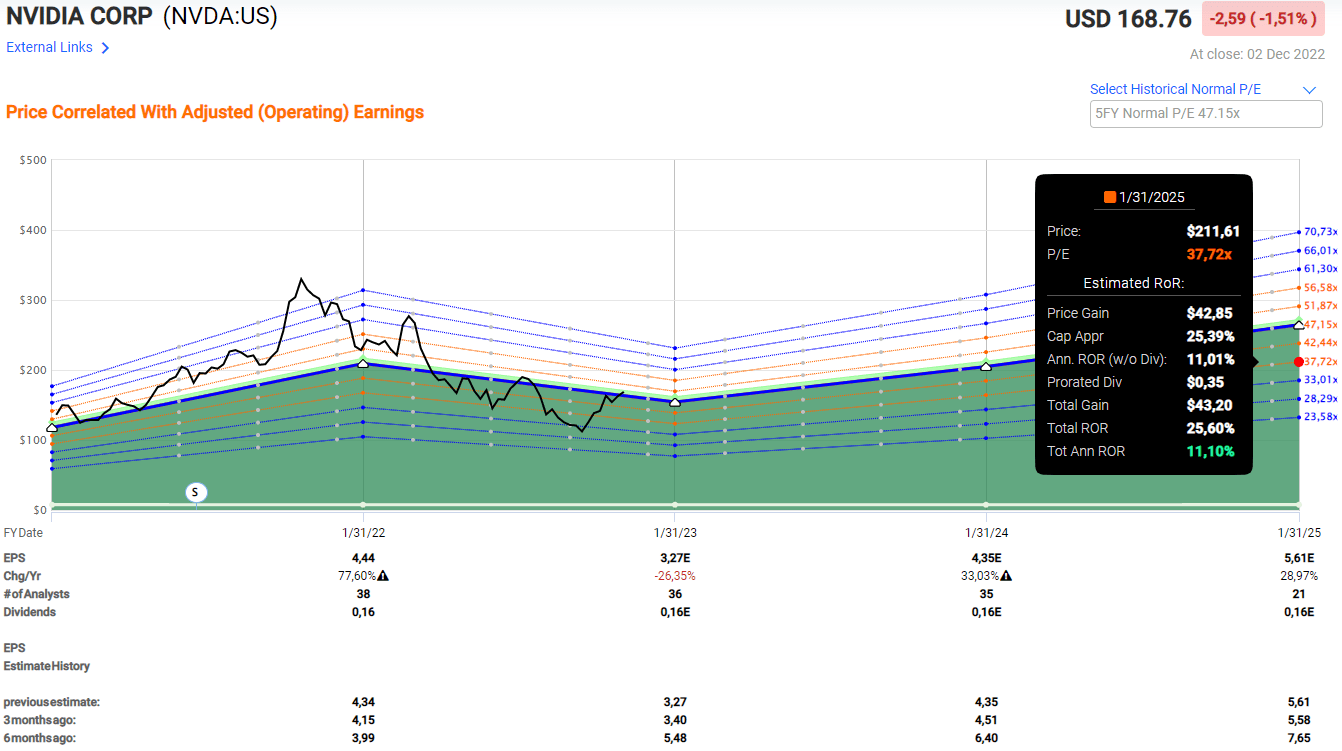
The forecast, according to analysts, for the next two years is good. If the forecast stays the same and NVDA reverts to its average earnings multiple, it would mean a 25% annual return until the end of 2025. But as you saw in the estimates trends earlier and in the FastGraphs chart in the lower section, the estimates for earnings got slashed a lot. Considering that I estimate the sales and earnings recovery to be slower than expected by analysts, the return should be less. To reflect that, I used a lower earnings multiple of 37.7x instead of 48x. And this is probably still optimistic. As you can see, we then get an annual return of 11% until the end of 2025. This return is too bad for the risk you take with buying NVDA right now. But should the stock price fall back to the October lows, it is worth considering buying a few shares. The valuation of 31x earnings gives us a better risk-return ratio as long as the outlook hasn’t dramatically worsened by then.
Why should you consider buying shares at all?
As I said in the first article of this series, I won’t write much about that since this isn’t the core of this series. But here are a few reasons to buy NVDA:
- AI is a sure thing of the future. What it needs is computing power -> demand for GPUs
- The growing need for data centers -> demand for GPUs
- a potential revival of cryptocurrencies ->demand for GPUs
- and a further increasing gaming and VR market -> demand for GPUs
So, in other words, there is a very high probability that GPUs will see higher demand in the future. NVDA is one of the market leaders in this industry and should profit from that. If you want to read more about these things, I recommend this article from Joe Albano. This article explains how and why NVDA benefits from AI development. In my opinion, AI is the most undeveloped one of these growth drivers and, therefore, the most interesting one.
Conclusion
With this article, I wanted to give you a heads-up on the current state of NVDA and a possible outlook using a few charts that helped me get a better look at this company. The development of the economy and the GPU market was awful this year, and I expect that to continue next year or at least the first half of next year. Nevertheless, earnings could have bottomed and are ready to get better. Considering that NVDA trades at the same valuation it has done the last five years, in which the outlook was much better, I can’t rate NVDA a “buy” right now. But it would be worth considering buying when the share price hits its October lows ($112 – 34% lower than the current share price) again. To avoid a part of the risk, I advise buying the desired position size in several tranches. So you can “dollar cost average” down if the share price falls further.
Be the first to comment