

Pgiam/iStock via Getty Images
Investment Portfolio Discipline Summary
“Blockdesk’s Standard Performance Comparison fund invests in equities whenever Market-Maker hedging activity forecasts that 80% or more of the near-coming price range is expected to be to the upside and 10% or less may be to the downside. This is a guide to the balance of expectations, since coming price change directions tend to be led by prior extremes, issue by issue.
At the time of each purchase a GTC sell order for all of those just bought shares is placed with the broker where bought. His system will monitor and direct to you the sale confirmation when accomplished, probably with encouragement for reinvestment.
At the time of the buy, only on your own personal private calendar at 3 months after the purchase, make a note to review this holding. If not yet sold, but at a loss, sell and put the proceeds into the reinvestment stream. If at a gain, after considering alternatives, decide to sell or move the calendar note a month further forward “
This article’s primary focus is on Nova Ltd. (NASDAQ:NVMI)
Description of Primary Investment Candidate
“Nova Ltd. designs, develops, produces, and sells process control systems used in the manufacture of semiconductors in Israel, Taiwan, the United States, China, Korea, and internationally. Its product portfolio includes a set of metrology platforms for dimensional, films, and materials and chemical metrology measurements for process control for various semiconductor manufacturing process steps, including lithography, etch, chemical mechanical planarization, deposition, electrochemical plating, and advanced packaging. The company serves various sectors of the integrated circuit manufacturing industry, including logic, foundries, and memory manufacturers, as well as process equipment manufacturers. Nova Ltd. was formerly known as Nova Measuring Instruments Ltd. and changed its name to Nova Ltd. in July 2021. The company was incorporated in 1993 and is headquartered in Rehovot, Israel.”
Yahoo Finance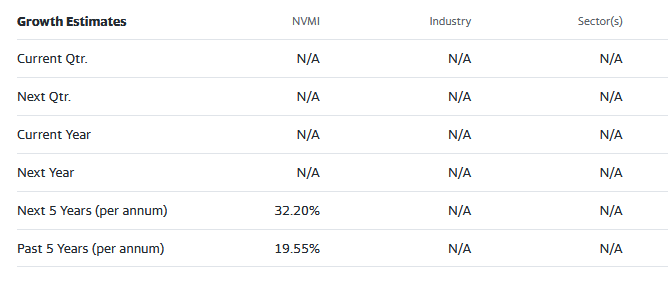
These growth estimates have been made by and are collected from Wall Street analysts to suggest what conventional methodology currently produces. The typical variations across forecast horizons of different time periods illustrate the difficulty of making value comparisons when the forecast horizon is not clearly defined.
Risk and Reward Balances Among NVMI Competitors
Here are several machinery industry operators like NVMI and Caterpillar Inc. (CAT). Following the same analysis as with CAT, historic sampling of their prior Risk-Reward balances like those of today were taken, and are mapped out in Figure 1.
Figure 1
blockdesk.com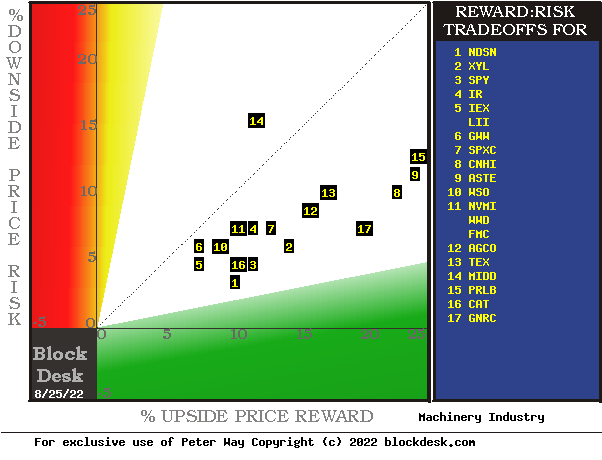
(Used with permission).
Expected rewards for these securities are the greatest gains from current closing market price seen worth protecting short positions. Their measure is on the horizontal green scale.
The risk dimension is of actual price draw-downs at their most extreme point while being held in previous pursuit of upside rewards similar to the ones currently being seen. They are measured on the red vertical scale.
Both scales are of percent change from zero to 25%. Any stock or exchange-traded fund (“ETF”) whose present risk exposure exceeds its reward prospect will be above the dotted diagonal line. Capital-gain attractive to-buy issues are in the directions down and to the right.
Our principal interest is in NVMI at location [11], midway between 10 and 4. A “market index” norm of reward~risk tradeoffs is offered by SPY at [3]. Less appealing (to own) by this Figure 1 view is CAT at location [16] just left of SPY’s better reward, but at the same risk of price drawdown exposure.
Comparing features of Alternative Investment Stocks
The Figure 1 map provides a good visual comparison of the two most important aspects of every equity investment in the short term. There are other aspects of comparison which this map sometimes does not communicate well, particularly when general market perspectives like those of SPY are involved. Where questions of “how likely’ are present other comparative tables, like Figure 2, may be useful..
Yellow highlighting of the table’s cells emphasize factors important to securities valuations and the security NVMI, most promising of near capital gain as ranked in column [R]. Pink cell shading indicates values below usual standards as in columns L and T.
Figure 2
blockdesk.com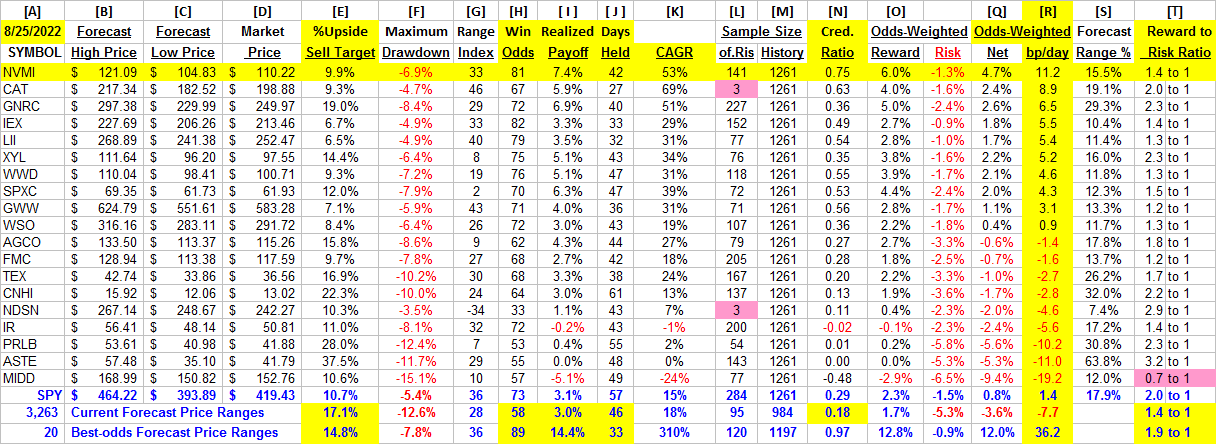
(used with permission)
Why do all this math?
Figure 2’s purpose is to attempt universally comparable answers, stock by stock, of a) How BIG the prospective price gain payoff may be, b) how LIKELY the payoff will be a profitable experience, c) how SOON it may happen, and d) what price draw-down RISK may be encountered during its holding period.
Readers familiar with our analysis methods after quick examination of Figure 2 may wish to skip to the next section viewing Price range forecast trends for NVMI.
Column headers for Figure 2 define investment-choice preference elements for each row stock whose symbol appears at the left in column [A]. The elements are derived or calculated separately for each stock, based on the specifics of its situation and current-day MM price-range forecasts. Data in red numerals are negative, usually undesirable to “long” holding positions. Table cells with yellow fills are of data for the stocks of principal interest and of all issues at the ranking column, [R].
The price-range forecast limits of columns [B] and [C] get defined by MM hedging actions to protect firm capital required to be put at risk of price changes from volume trade orders placed by big-$ “institutional” clients.
[E] measures potential upside risks for MM short positions created to fill such orders, and reward potentials for the buy-side positions so created. Prior forecasts like the present provide a history of relevant price draw-down risks for buyers. The most severe ones actually encountered are in [F], during holding periods in effort to reach [E] gains. Those are where buyers are emotionally most likely to accept losses.
The Range Index [G] tells where today’s price lies relative to the MM community’s forecast of upper and lower limits of coming prices. Its numeric is the percentage proportion of the full low to high forecast seen below the current market price.
[H] tells what proportion of the [L] sample of prior like-balance forecasts have earned gains by either having price reach its [B] target or be above its [D] entry cost at the end of a 3-month max-patience holding period limit. [ I ] gives the net gains-losses of those [L] experiences.
What makes NVMI more attractive at this point in time is its consistency of profitable outcomes at this level of Range Index (81 of 100) compared to NVMI’s Win Odds [H] of only 67 of 100.
Further Reward~Risk tradeoffs involve using the [H] odds for gains with the 100 – H loss odds as weights for N-conditioned [E] and for [F], for a combined-return score [Q]. The typical position holding period [J] on [Q] provides a figure of merit [fom] ranking measure [R] useful in portfolio position preferencing. Figure 2 is row-ranked on [R] among alternative candidate securities, with ENTG in top rank.
Along with the candidate-specific stocks these selection considerations are provided for the averages of some 3000+ stocks for which MM price-range forecasts are available today, and 20 of the best-ranked (by fom) of those forecasts, as well as the forecast for S&P 500 Index ETF (SPY) as an equity-market proxy.
As shown in column [T] of figure 2, those levels vary significantly between stocks. What matters is the net profit between investment gains and losses actually achieved following the forecasts, shown in column [I]. The Win Odds of [H] tells what proportion of the Sample RIs of each stock were profitable. Odds below 80% often have proven to lack reliability.
Price range forecast trends for NVMI
Figure 3
blockdesk.com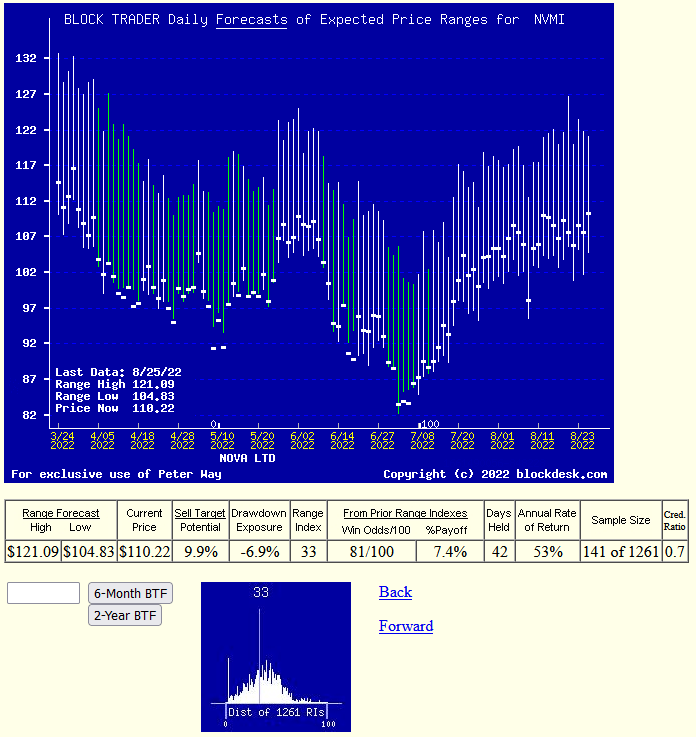
(used with permission)
No, this is not a “technical analysis chart” showing only historical data. It is a Behavioral Analysis picture of the Market-Making community’s actions in hedging investments of the subject. Those actions define expected price change limits shown as vertical bars with a heavy dot at the closing price on the date of the forecast.
It is an actual picture of experienced market professionals expected future prices, not a simple hope of a recurrence of the past. These expectations are backed up by significant bets of investment capital made to protect market-makers or earn a proprietary profit from risk-taking.
The special value of such pictures is their ability to immediately communicate the balance of expectation attitudes between optimism and pessimism. We quantify that balance by calculating what proportion of the price-range uncertainty lies to the downside, between the current market price and the lower expected limit, labeled the Range Index [RI].
Here a RI of NVMI at 33 indicates twice as much upside is likely than price draw-down, but not guaranteed. The odds of 3 months passing without either reaching or exceeding the upper forecast limit or being at that time below the expected lower price (today’s) are quite slight.
The probability function of price changes for NVMI are pictured by the (thumbnail) lower Figure 3 frequency distribution of the past 5 years of RI values with the today value indicated. Predominantly, past RIs and price changes have been higher.
In contrast, the history of CAT price range forecasts by the market-making community now places its market quote at near mid-range with a Range Index of 46. Please see the contrast of Figure 3’s small lower picture with that of CAT’s Figure 4.
Figure 4
blockdesk.com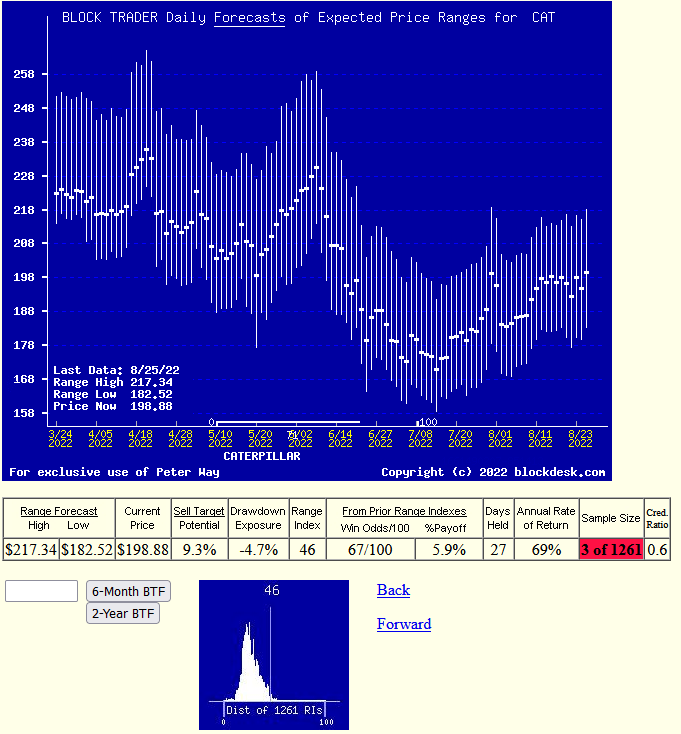
(used with permission)
Note that while NVMI’s distribution of daily RIs during the past 5 years has been almost evenly centered around its present Reward~Risk balance, the situation for CAT is quite different. There, very few RIs of the past 5 years have been seen higher than where it is now at 46.
Conclusion
The multi-path valuations explored by the analysis covered in Figure 2 is rich testimony to the near-future value prospect advantage of a current investment in Nova Ltd. over and above the other compared alternative investment candidates, including CAT.
Be the first to comment