

Adrian Vidal
Prior to getting into the introduction, I wanted to highlight 2 changes to this article. I have added the line graph in the portfolio snapshot graphic at the end of the introduction. The 2nd change will be found in the portfolio composition section of this article. Many readers have asked if I could list all the positions I hold within the specific sectors. I created pie charts for each sector of the Dividend Harvesting portfolio which indicate each position held and the percentage it represents in that sector. I hope everyone enjoys these updates, and please keep the suggestions coming.
The Dividend Harvesting portfolio continued to regain some of its losses in week 73 and went from closing in the red by-$197.60 (-2.78%) in week 72 to being down -$97.40 (-1.33%). This marks the 6th consecutive week the Dividend Harvesting portfolio has closed in the red, bringing its overall percentage of positive weeks to 89.04% (65/73). I feel it’s important to highlight these weeks in the red because there isn’t a single investment strategy that’s impervious to macro events, market dynamics, or volatility. This investment strategy isn’t glamorous, and it won’t appeal to everyone. Dividend investing can be tedious and sometimes feel like a slow grind. I am building this portfolio out with 3 specific investment objectives in this order, 1st is to generate dividend income, 2nd is to mitigate downside risk during market declines, and 3rd is to generate capital appreciation.
In week 73, I added 2 new positions bringing my income-producing positions to 78. The Dividend Harvesting portfolio is now producing a projected $512.73 in annual dividend income, which is a 7.12% yield. I added National Retail Properties (NNN) and Walgreens Boots Alliance (WBA) to the Dividend Harvesting portfolio and increased the number of dividends being produced by 8. These positions added additional diversification, and I am excited about getting them at around 5% yields. 2022 has been a difficult investing environment, but I am grateful that I have been able to allocate capital to this project each week, as I believe there have been many great buying opportunities. Big tech is reporting this week, and hopefully, we get some strong earnings reports to help create a sustainable rally.
I allocate capital toward big tech, funds, dividends, and growth outside of my retirement accounts. These are not my only investments, but I did open a separate account, so I could easily track and document this series. I intentionally created broad diversification throughout the Dividend Harvesting portfolio so I could benefit from sector rotations and mitigate my downside risk. Investors who are too exposed to growth companies or large-cap tech have gotten crushed as the investment landscape changes. On the growth and tech side of my investments, I am feeling the pain as some of my favorite companies, including Alphabet (GOOGL) (GOOG), Amazon (AMZN), and Meta Platforms (META), have been taken to the woodshed.
This series has never been about hitting a target yield, generating a certain amount of profit, or beating the market. I had two specific goals with this series. The first was to create a blueprint for constructing a dividend portfolio by documenting the journey starting from the beginning. The second goal was to illustrate how allocating capital each week toward investing, regardless of the amount, would be beneficial in the long run.
Too many people are under the illusion that you need tens of thousands or even hundreds of thousands to benefit from investing. Instead of using my real dividend portfolio as an example, I decided to start a new account, fund it with $100, and add $100 weekly, providing a step-by-step guide to dividend investing. This methodology doesn’t have to be used for dividend investing, and it could be as simple as an S&P index fund or a Total Market fund. Hopefully, this series is inspiring people to invest in their future to attain financial freedom.
Steven Fiorillo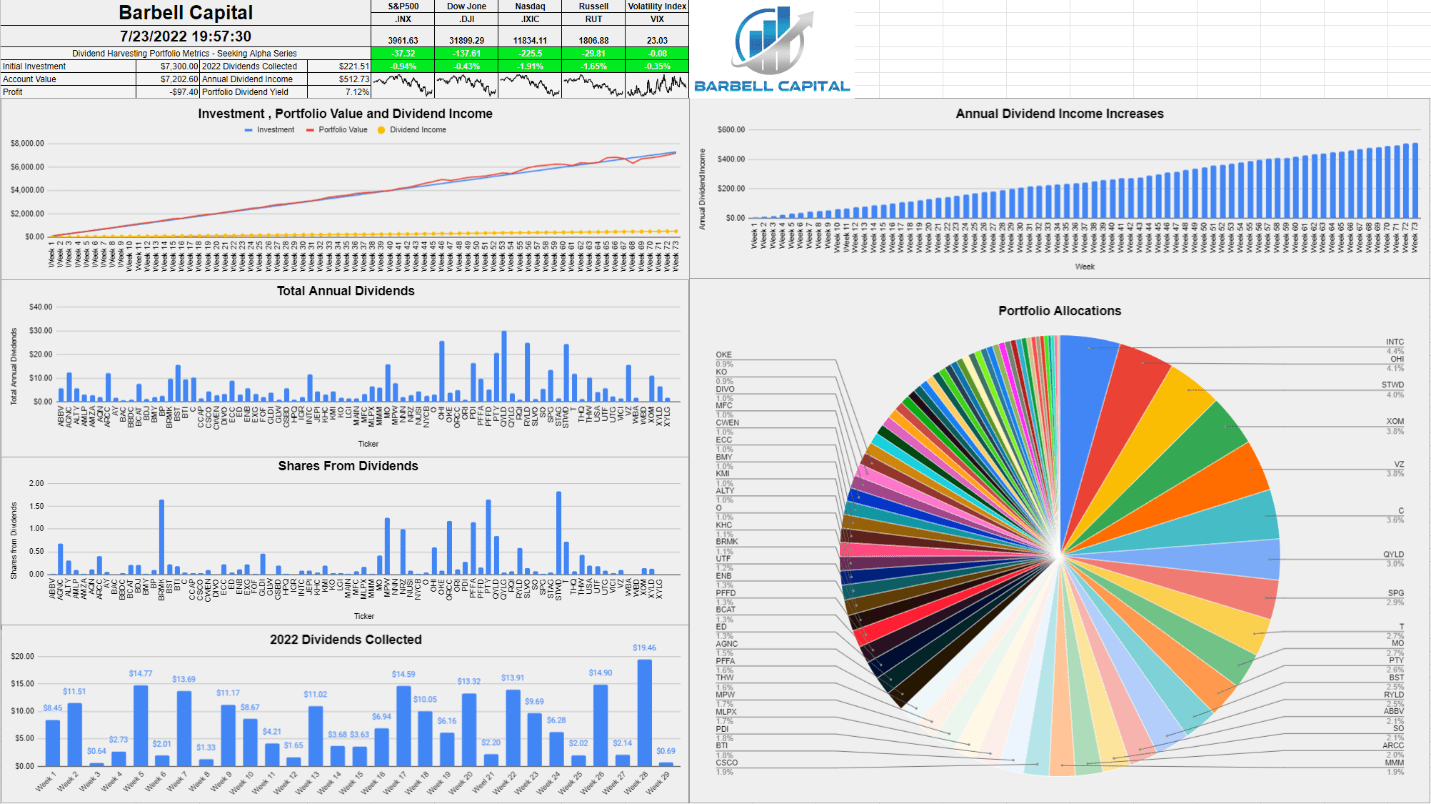
A Historical Recap Of The Dividend Harvesting Portfolio’s Investment Principals and Historical Performance
Investment Objectives
- Income generation
- Downside mitigation through diversification
- Capital appreciation
Below are the fundamental rules I have put in place for this portfolio:
- Allocate $100 weekly to this portfolio
- Only invest in dividend-producing investments
- No position can exceed 5% of the portfolio
- No sector can exceed 20% of the portfolio
- All dividends & distributions are to be reinvested
Below is a chart that extends from week 1 through the current week to illustrate the Dividend Harvesting Portfolio’s Progression
- Blue line is my initial investment $100 in week 1, $1000 in week 10, etc.
- Red line is the account value at the end of each week
- Yellow line is the annual dividend income the Dividend Harvesting Portfolio was projected to generate after that week’s investments and dividends reinvested
Steven Fiorillo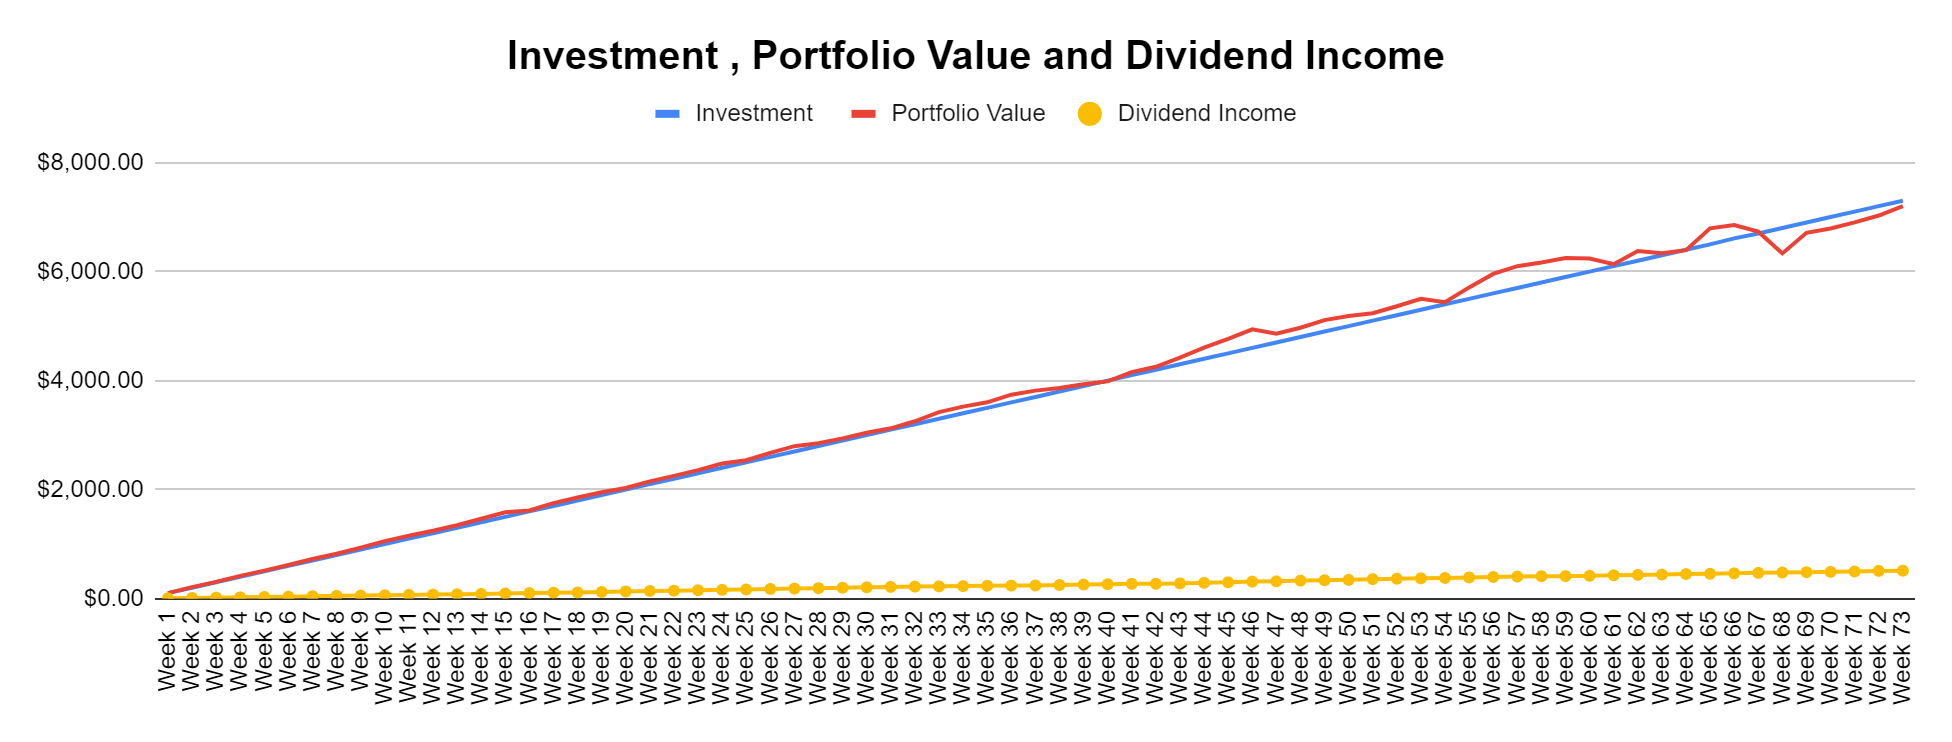
The Dividend Harvesting Portfolio Dividend Section
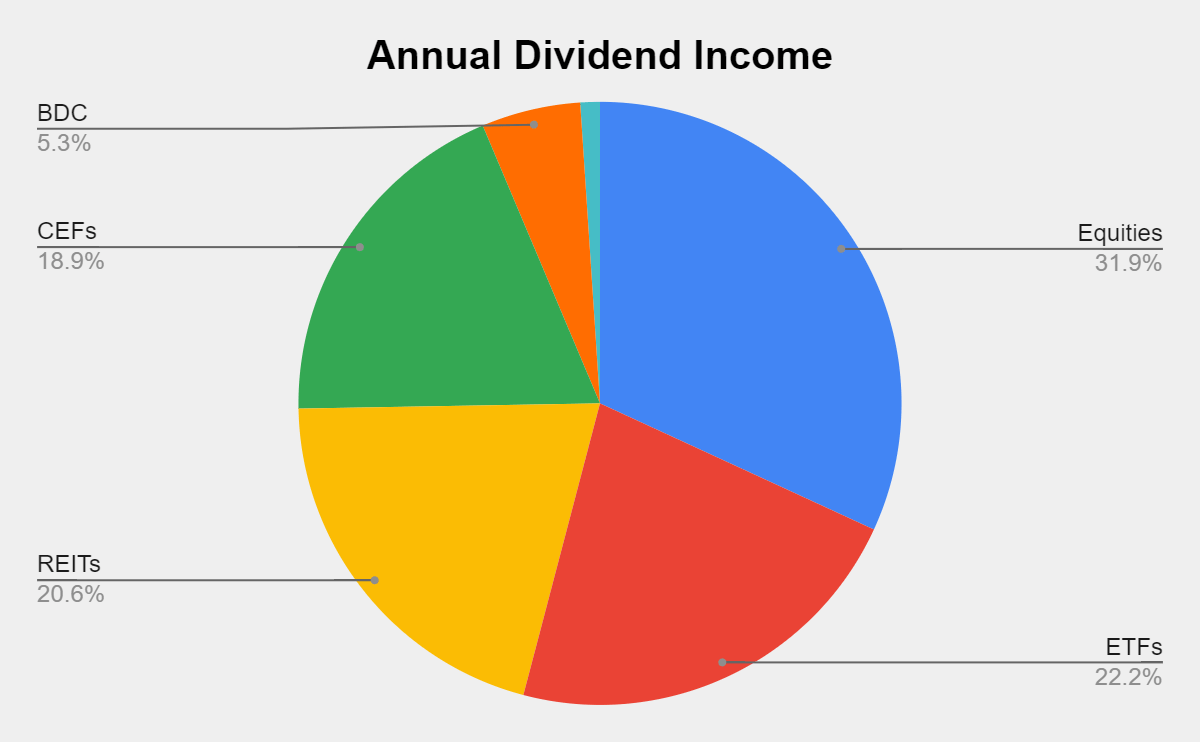
Here is how much dividend income is generated per investment basket:
- Equities $163.40 (31.87%)
- ETFs $113.93 (22.22%)
- REITs $105.80 (20.63%)
- CEFs $96.99 (18.92%)
- BDC $27.23 (5.31%)
- ETNs $5.38 (1.05%)
Steven Fiorillo Steven Fiorillo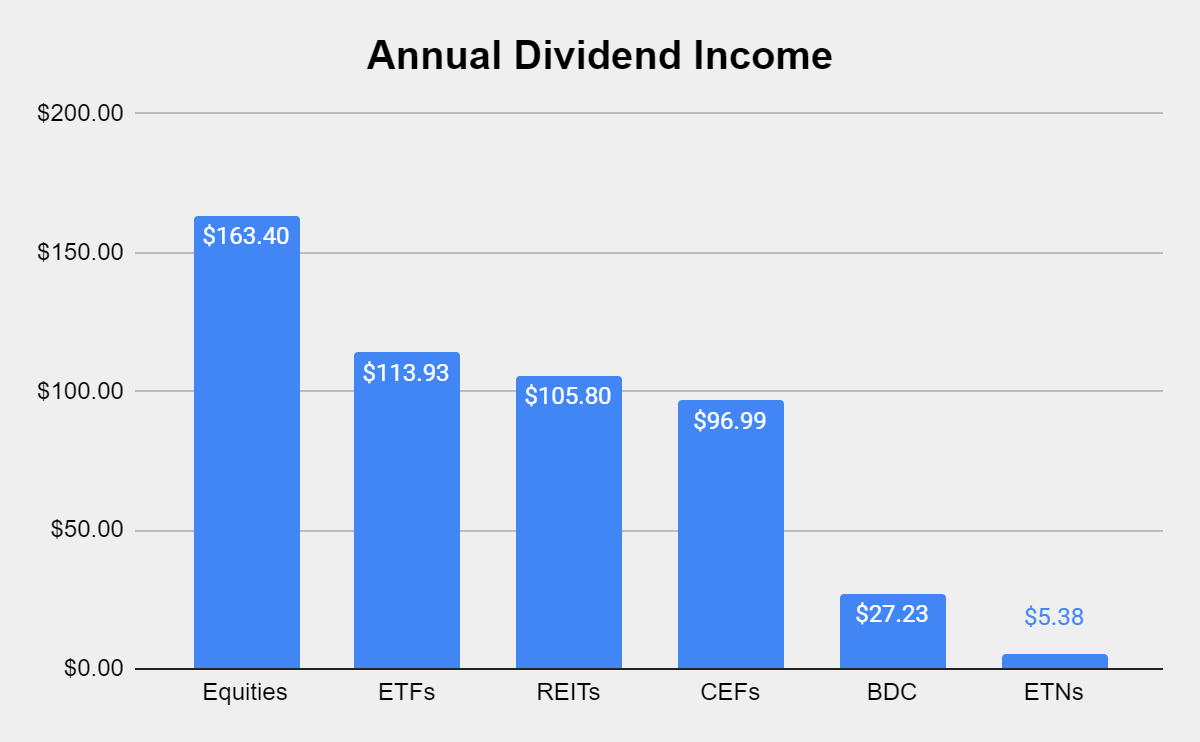
Collecting dividends can serve many functions in a portfolio. Some investors utilize dividends to supplement their income and live off. I am building a dividend portfolio for myself 30 years into the future. Since I am reinvesting every dividend, they serve multiple purposes today. In 2022 alone, I have collected $221.51 in dividend income from 266 dividends across 29 weeks. This has allowed the Dividend Harvesting portfolio to stay in the black while growing the snowball effect.
These dividends allow me to gain additional equity in my investments while increasing my future cash flow in down markets. This style of investing isn’t for everyone, but if you’re looking to generate consistent cash flow while mitigating downside risk, this method has worked for me. I am hoping to collect between $450-$500 in dividends in 2022, which will be reinvested, and finish the year generating >$700 in annual dividends.
Steven Fiorillo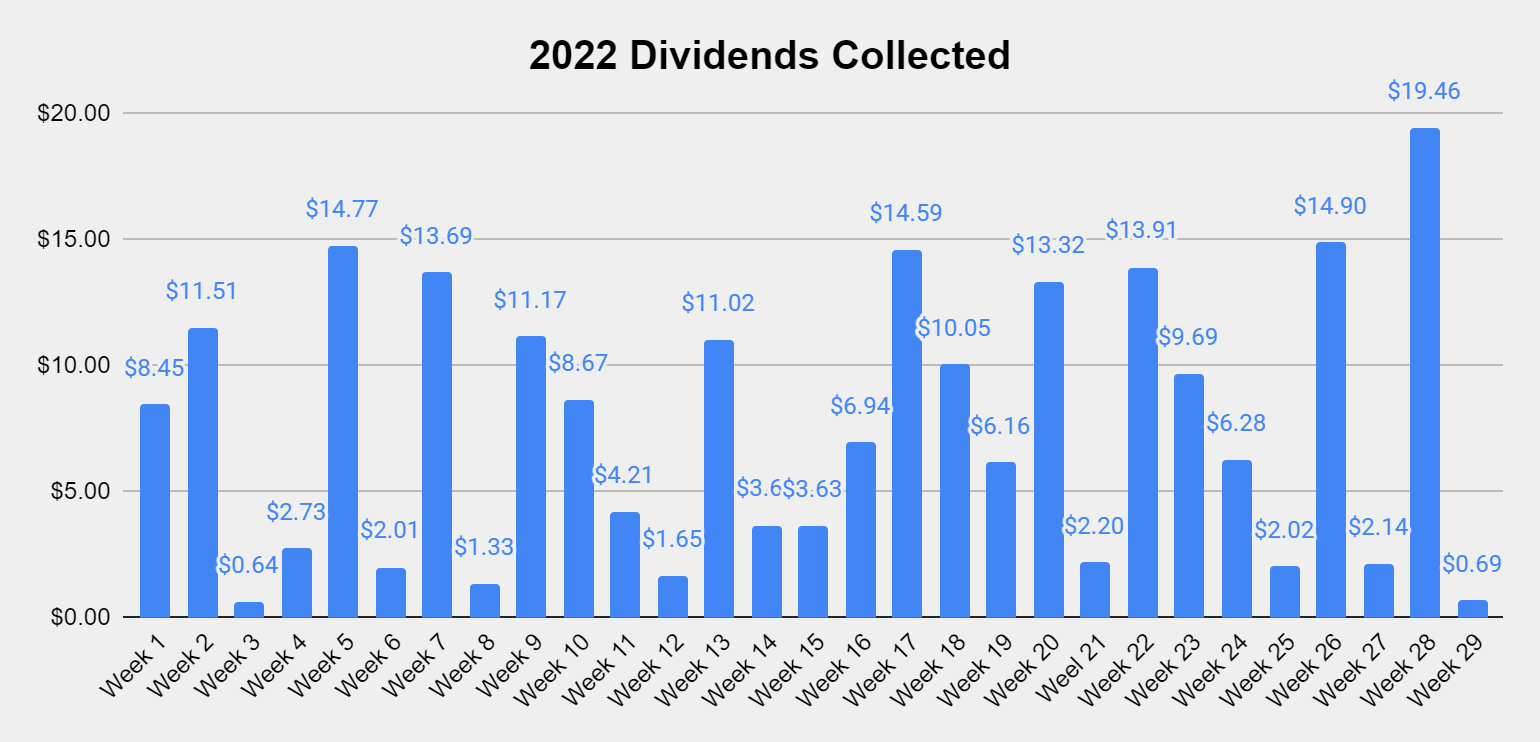
The never-ending stream of dividend income keeps growing. After adding WBA and NNN to the Dividend Harvesting portfolio, there are now 584 annual dividends being produced. Each week income comes rolling in, and the snowball effect amplifies little by little.
Steven Fiorillo, Seeking Alpha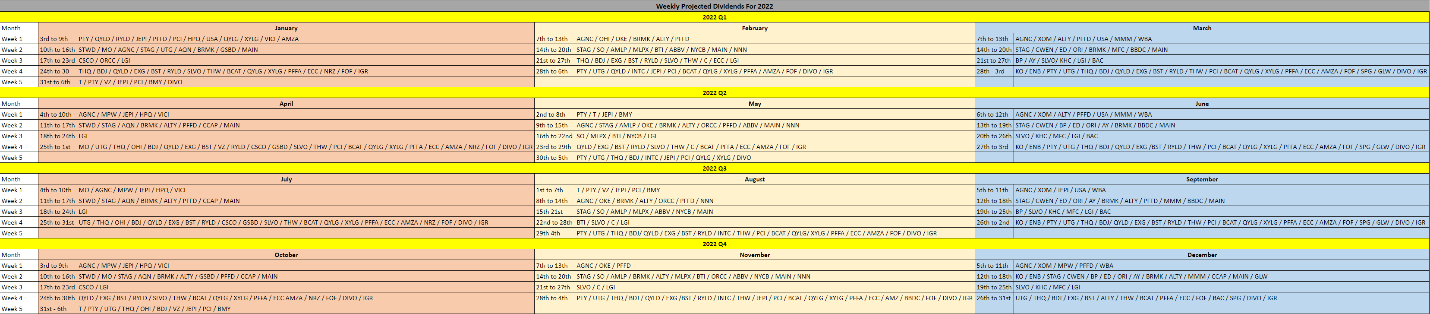
The goal of generating enough income from the dividends to purchase an additional share per year has been the never-ending project of this portfolio. There are now 6 positions that are generating at least 1 share annually through their dividends, which include Starwood Property Trust (STWD), PIMCO Corporate & Income Opportunity Fund (PTY), Broadmark Realty Capital (BRMK), AGNC Investment Corp. (AGNC), the Global X Russell 2000 Covered Call ETF (RYLD), and the Global X NASDAQ 100 Covered Call ETF (QYLD). I am trying to get more of the current positions over the finish line. Eventually, more positions will generate one share per year in dividend income.
Steven Fiorillo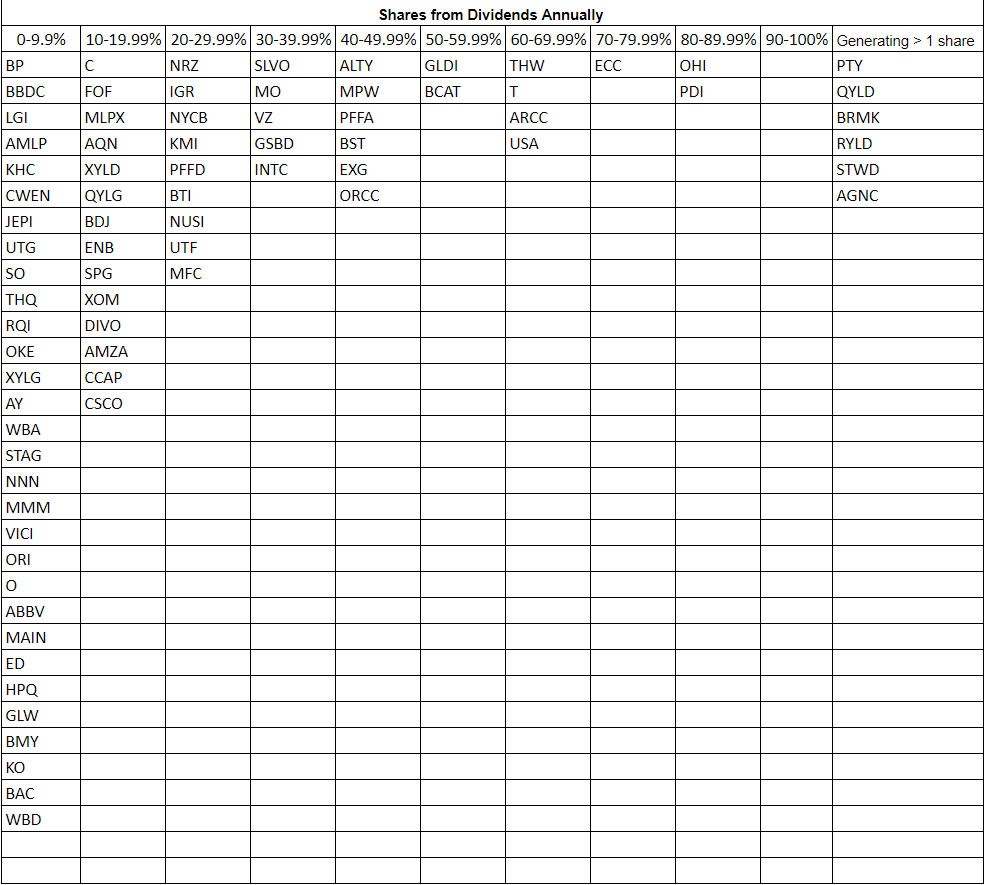
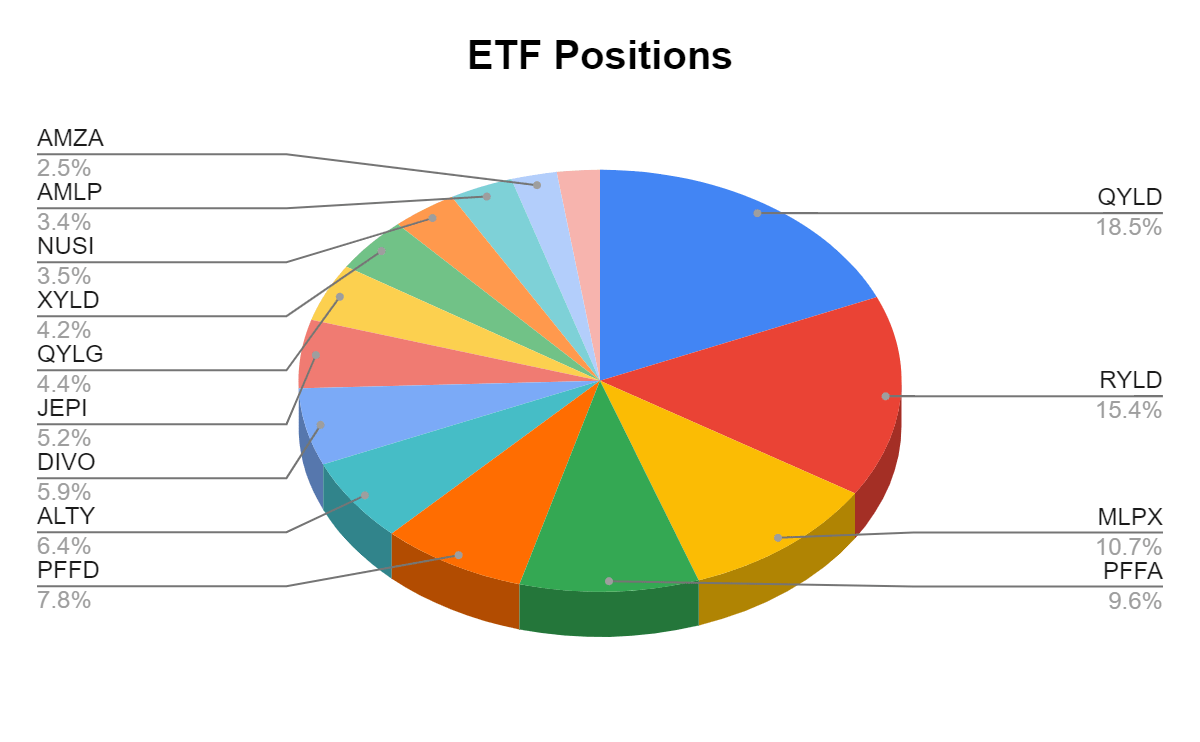
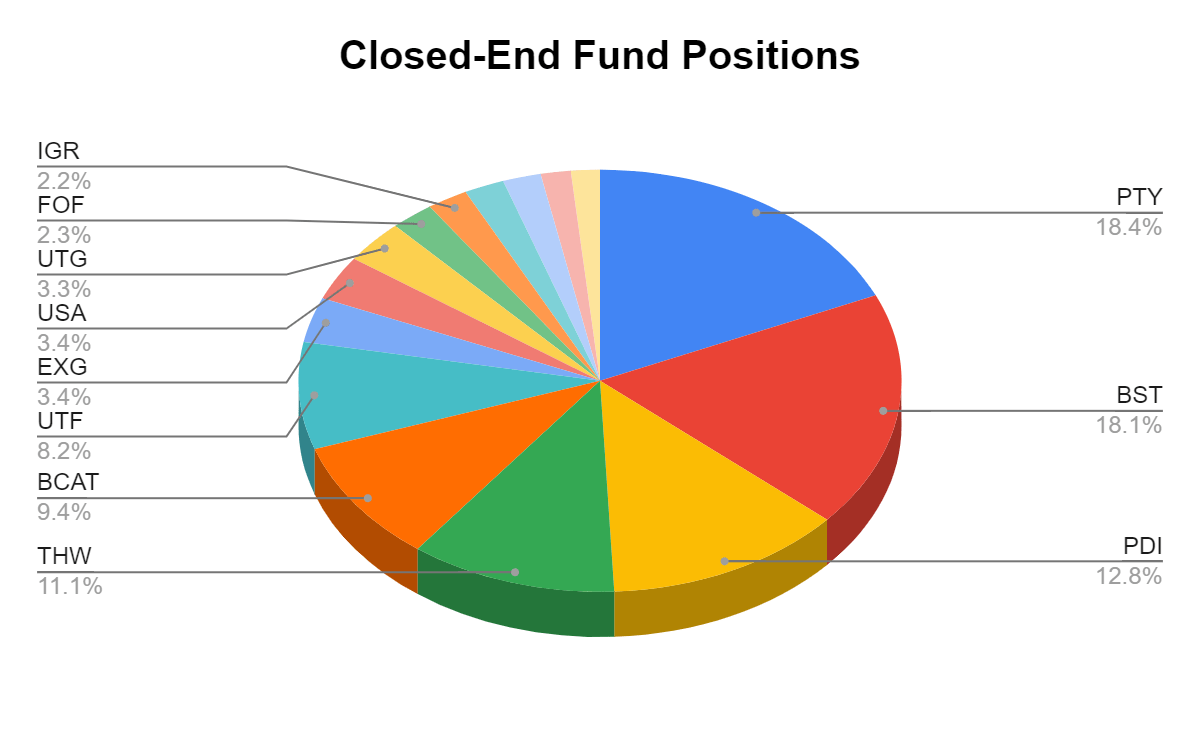
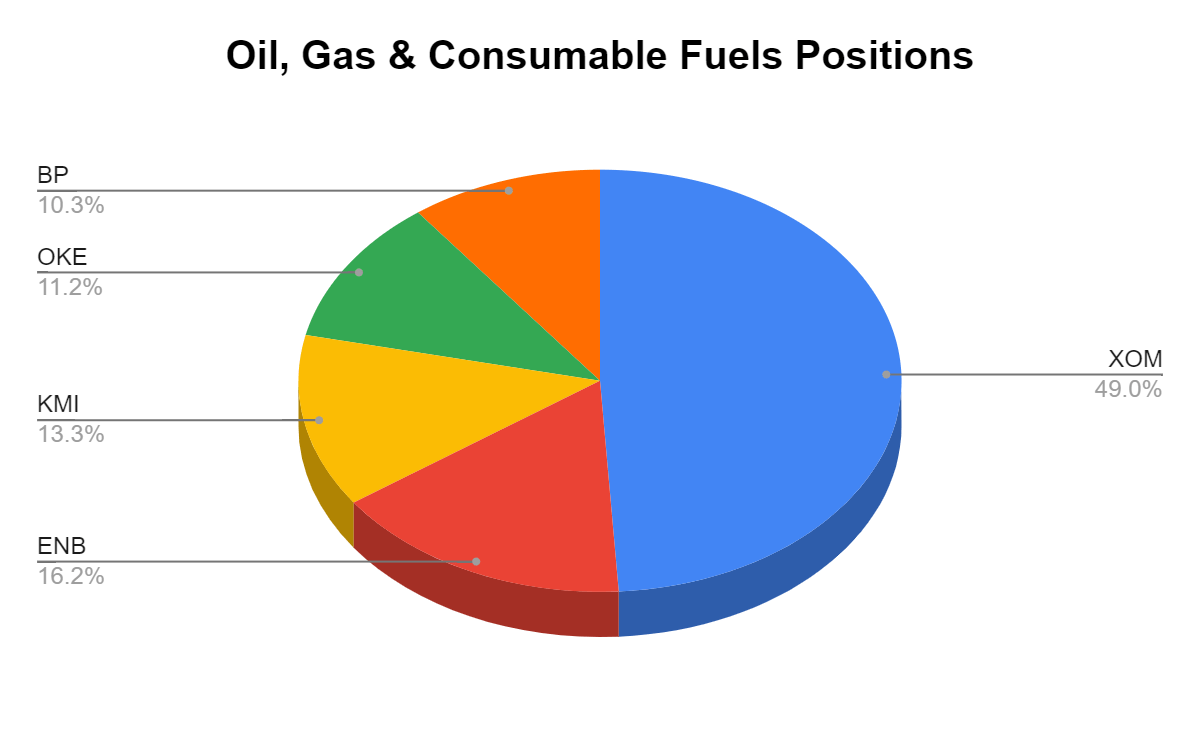
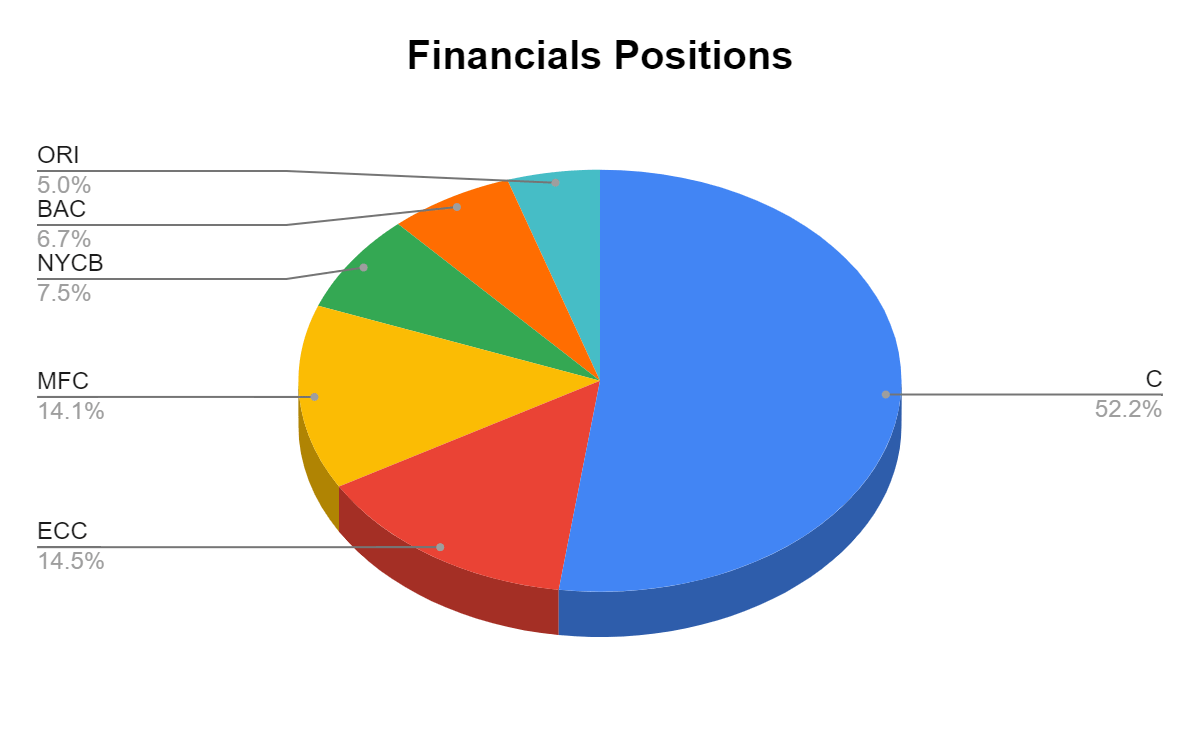
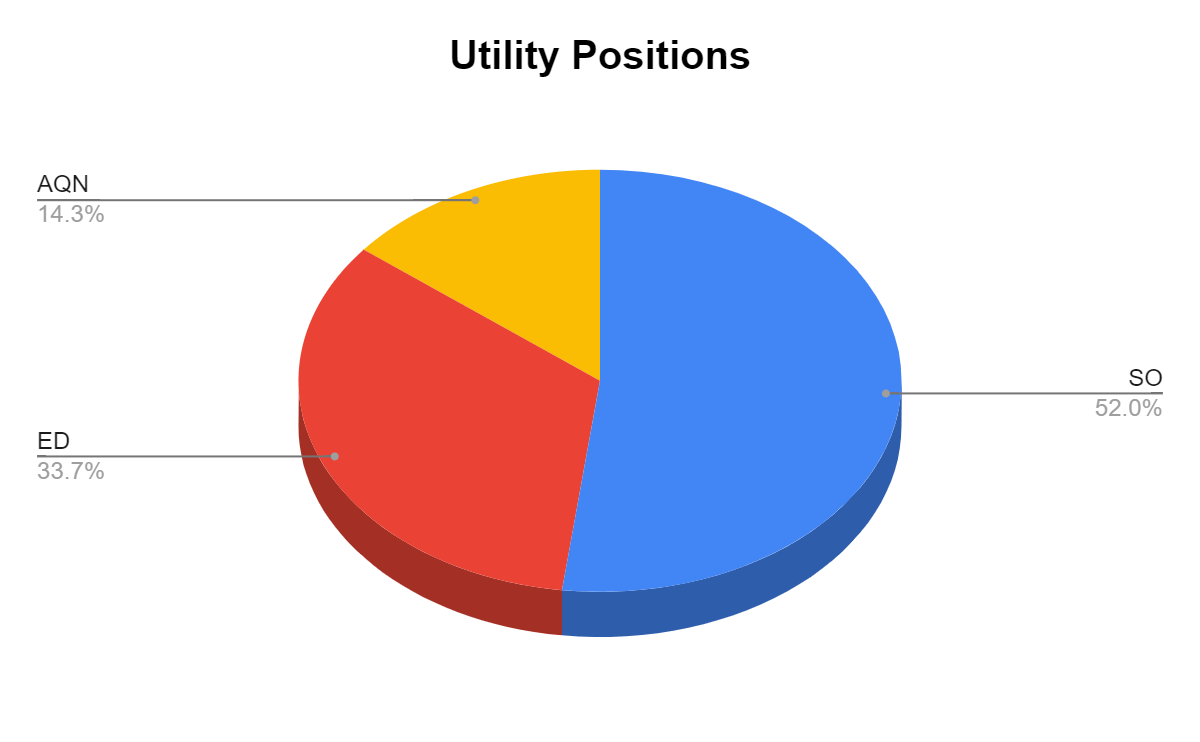
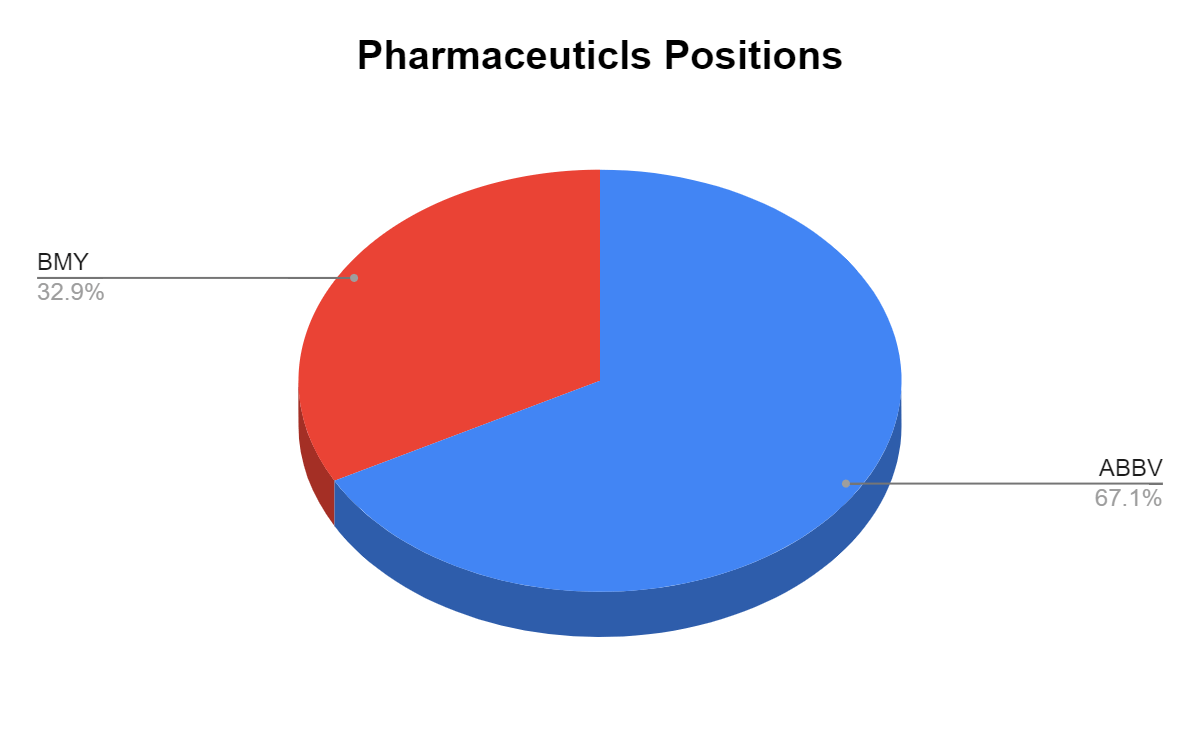
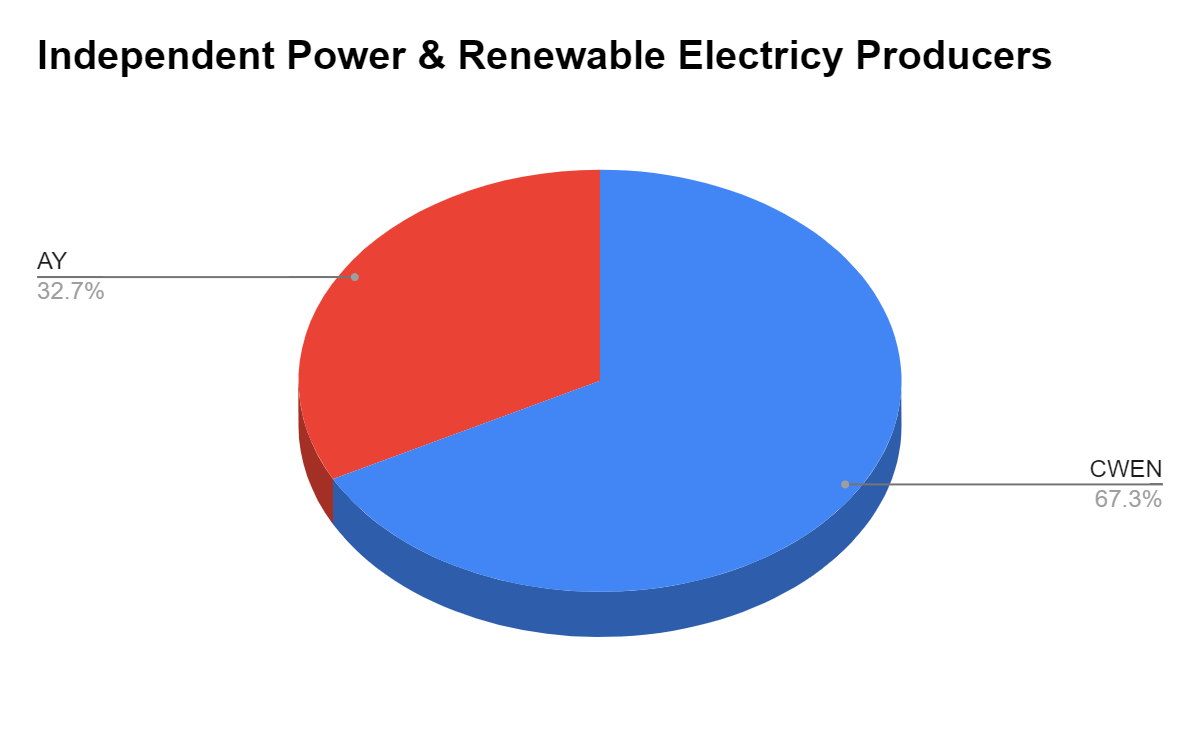
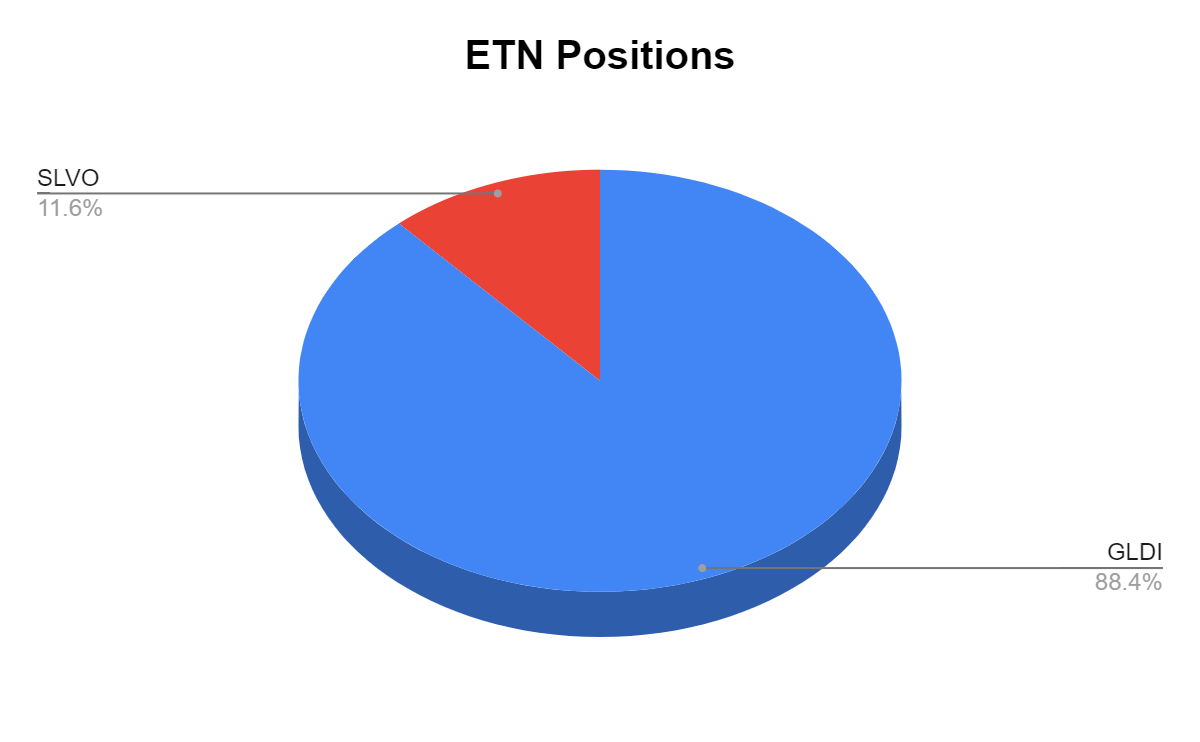
The Dividend Harvesting Portfolio Composition
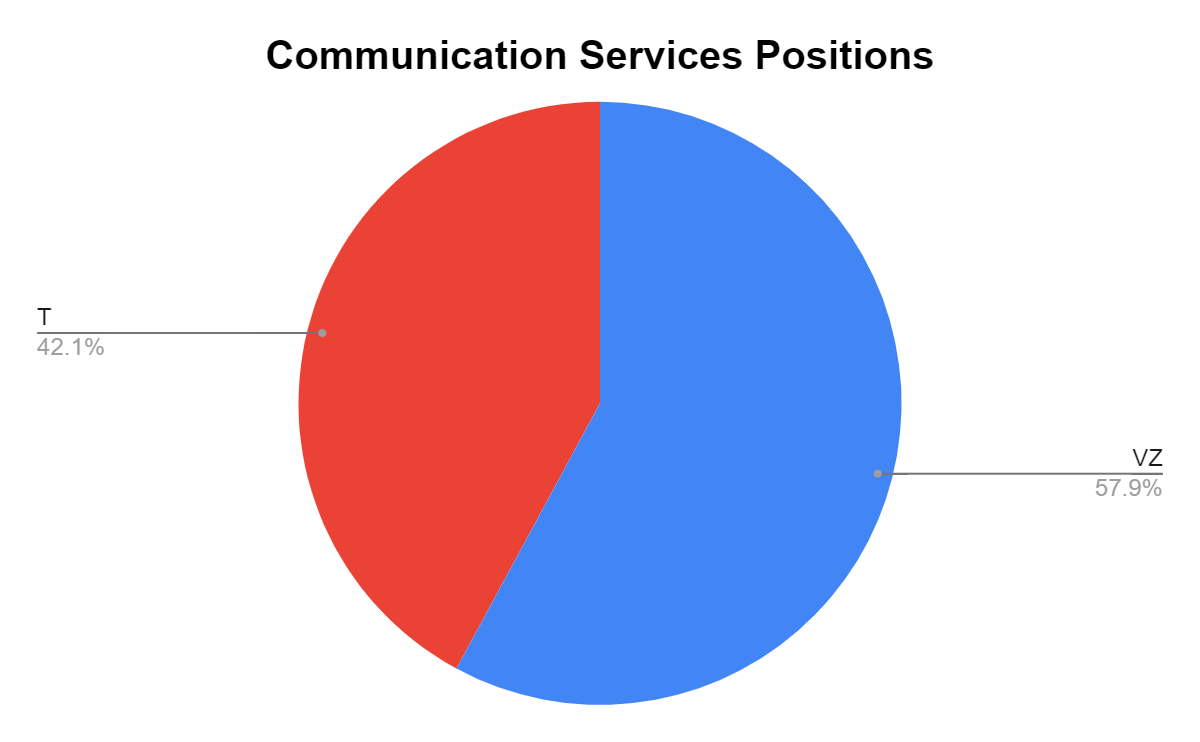
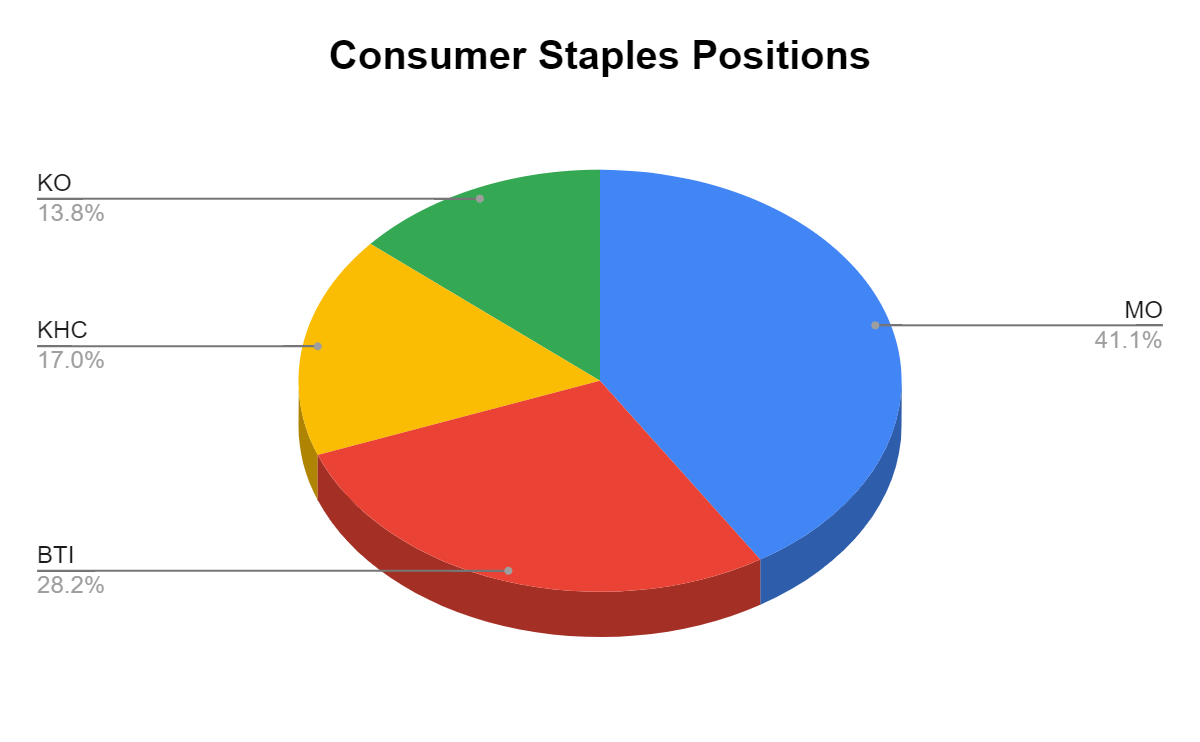
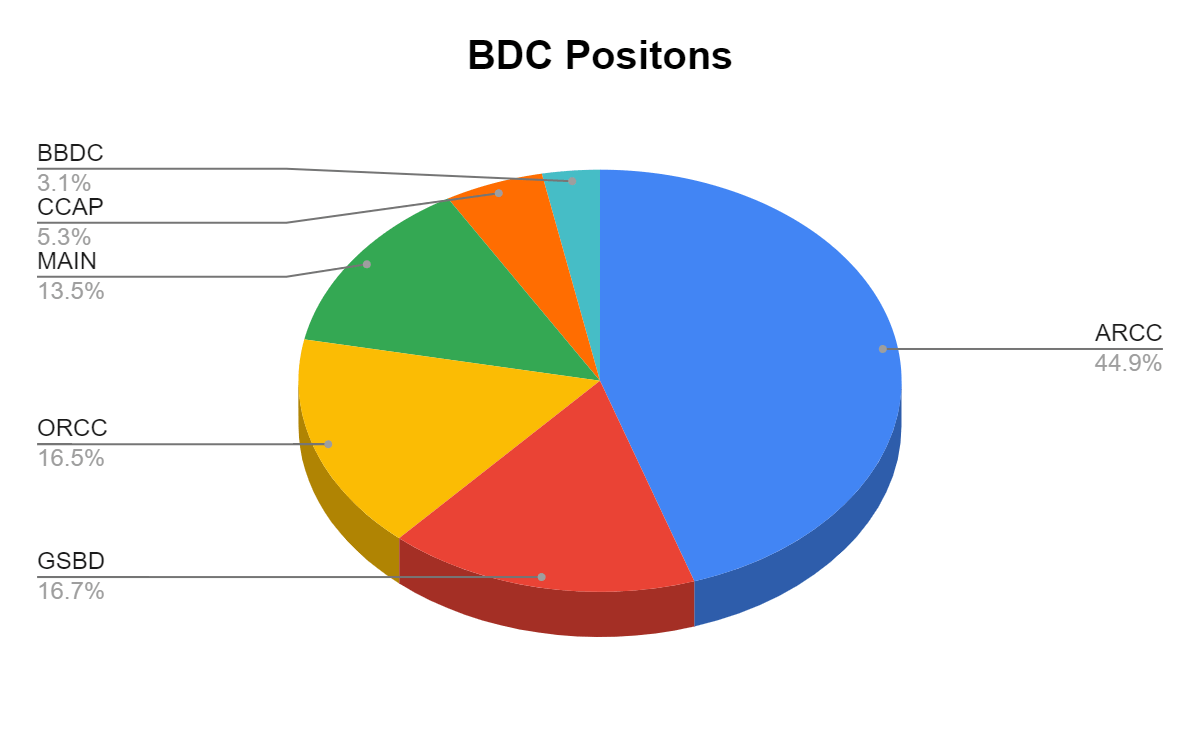
Many of the readers have asked if I could break down the individual positions within these sectors. I created pie charts for each individual sector and have illustrated how much each position represents of that sector of the Dividend Harvesting portfolio. Since I only have 1 position in Food & Staple Retailing and Industrials, I did not make a chart for those. 3M (MMM) and Walgreens Boots Alliance (WBA) represent 100% of those sectors. The charts will follow the normal portfolio total I have constructed. Please keep the ideas coming, as I am happy to add as much detail to this series as I can.
In week 73, REITs extended their lead in the top spot as they represent 18.32% of the Dividend Harvesting portfolio, while ETFs account for 16.14%. Individual equities make up 46.32% of the portfolio and generate 31.87% of the dividend income, while ETFs, CEFs, REITs, BDCs, and ETNs represent 53.68% of the portfolio and generate 68.13% of the dividend income. I have a 20% maximum sector weight, so when a singular sector gets close to that level, I make sure capital is allocated away from that area to balance things out. In 2022, I will make an effort to even out these portfolio percentages. As more capital is deployed, the bottom half of the portfolio weighting will increase.
|
Industry |
Investment |
Portfolio Total |
% of Portfolio |
|
REIT |
$1,319.79 |
$7,202.60 |
18.32% |
|
ETFs |
$1,162.78 |
$7,202.60 |
16.14% |
|
Closed-End Funds |
$1,009.22 |
$7,202.60 |
14.01% |
|
Oil, Gas & Consumable Fuels |
$559.33 |
$7,202.60 |
7.77% |
|
Financials |
$501.83 |
$7,202.60 |
6.97% |
|
Communication Services |
$468.54 |
$7,202.60 |
6.51% |
|
Consumer Staples |
$463.79 |
$7,202.60 |
6.44% |
|
Technology |
$548.46 |
$7,202.60 |
7.61% |
|
BDC |
$319.25 |
$7,202.60 |
4.43% |
|
Utility |
$287.56 |
$7,202.60 |
3.99% |
|
Pharmaceuticals |
$225.34 |
$7,202.60 |
3.13% |
|
Industrials |
$136.94 |
$7,202.60 |
1.90% |
|
Independent Power & Renewable Electricity Producers |
$105.80 |
$7,202.60 |
1.47% |
|
Food & Staple Retailing |
$38.66 |
$7,202.60 |
0.54% |
|
ETN |
$37.34 |
$7,202.60 |
0.52% |
|
Cash |
$17.50 |
$7,202.60 |
0.24% |
Steven Fiorillo Steven Fiorillo Steven Fiorillo Steven Fiorillo Steven Fiorillo Steven Fiorillo Chart, pie chart Description automatically generated Chart, pie chart Description automatically generated Chart, pie chart Description automatically generated Chart, pie chart Description automatically generated Chart, pie chart Description automatically generated Chart, pie chart Description automatically generated Chart, pie chart Description automatically generated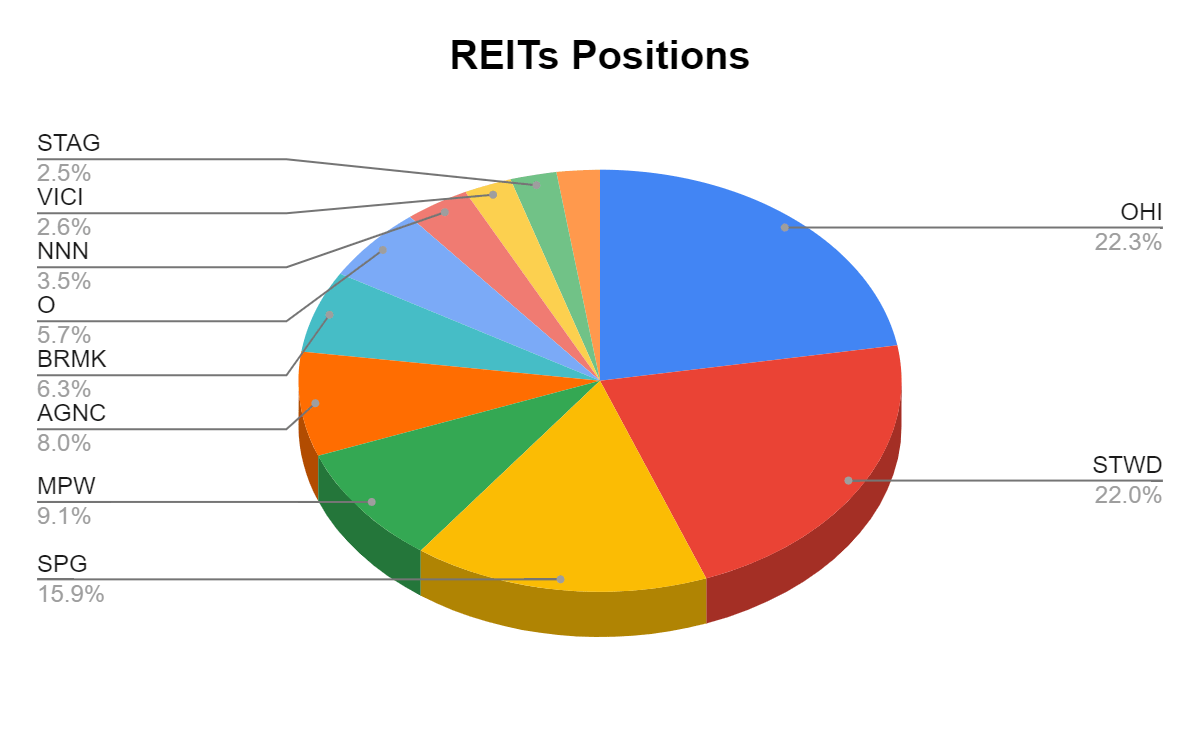
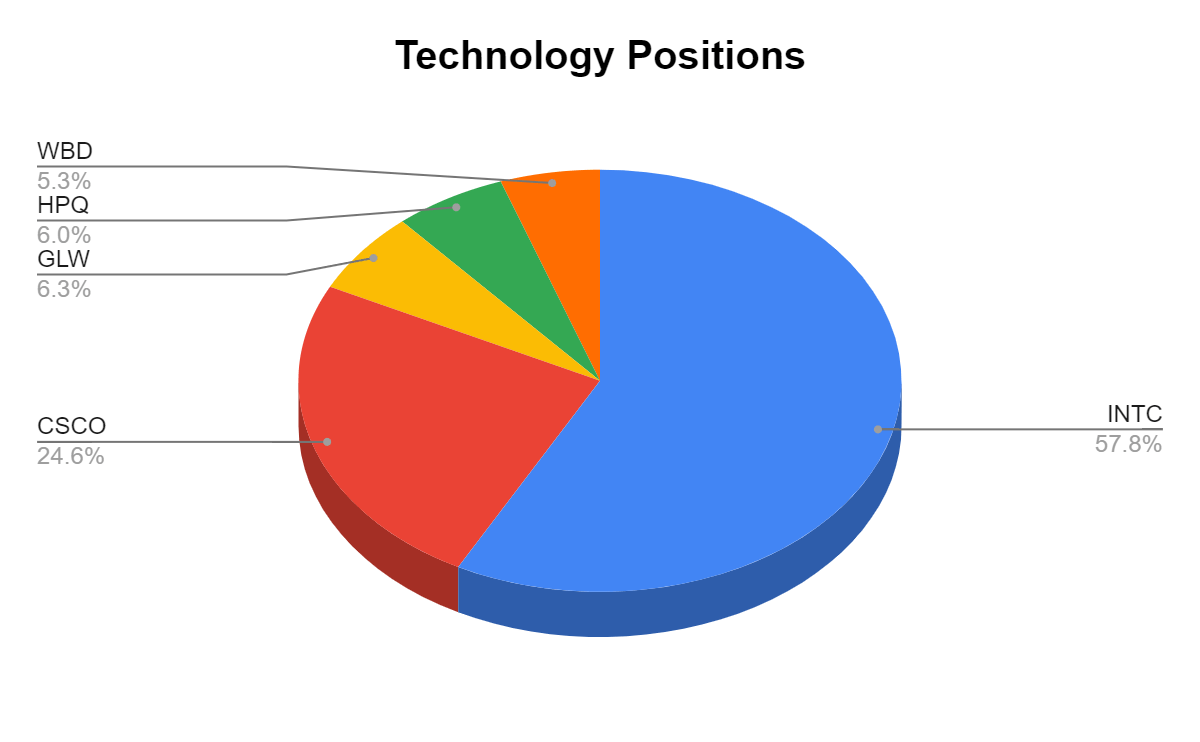
Intel Corporation (INTC) remains in the top spot at the end of week 73, while Omega Healthcare (OHI) has become the 2nd largest position in the Dividend Harvesting portfolio. I am trying to allocate capital away from these positions to even out the portfolio, but honestly, it’s difficult. I am still compelled to purchase some of these names as I see great long-term value in these positions. I am hoping that sometime next year, the portfolio isn’t as lopsided, but we will have to see what occurs.
Chart, pie chart Description automatically generated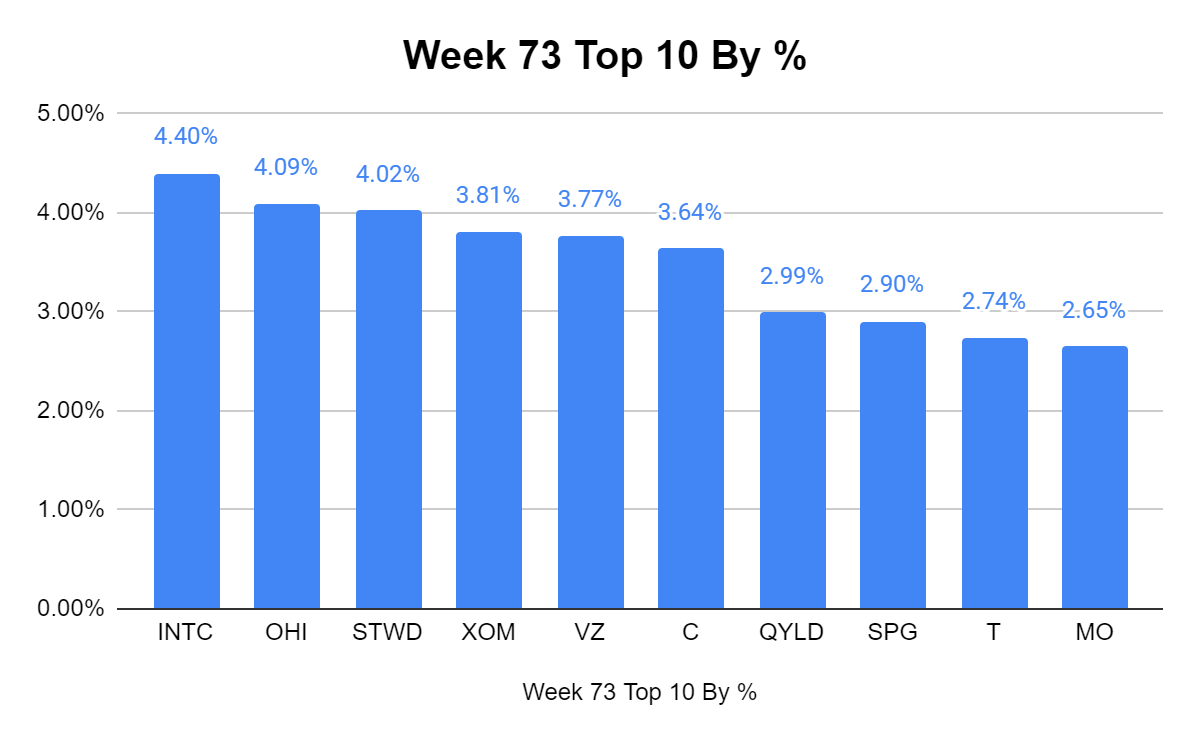
Week 73 Additions
In week 73 I added the following positions to the Dividend Harvesting Portfolio:
NNN
I recently wrote a dedicated article on NNN (can be read here) and really liked everything I researched about them. NNN is diversified across 370 unique tenants throughout 3,271 properties with a 99.2% occupancy rate. NNN has increased its dividend for 32 consecutive years as they have operated through the dot-com bubble, the mortgage crisis, the financial crisis, and the pandemic. The statistics have indicated that ecommerce sales in the U.S won’t exceed 25% in 2025 and that physical retail is still a driving factor in the space. I like the idea of being a landlord in the commercial real estate space without having to be a landlord, and NNN is a REIT that accomplishes this for me
WBA
WBA has had a rough year, declining by -27.14% YTD. This is looking very interesting as WBA consistently generates in excess of $5 billion in cash from operations, and its FCF has maintained over a $3b level since fiscal year 2014. WBA has provided investors with 46 consecutive years of dividend growth, the dividend yields 4.94%, and it trades at less than 12x its FCF. I am not sure how much lower shares will go, but WBA looks to be on the bargain shelf. The more I look at the numbers, the more I think the market is overreacting to the revenue slowdown as WBA is still a cash cow. I am happy to start a position in WBA as it hovers around the 5% yield mark.
Week 74 Gameplan
I have changed my mind at least 4 times about which companies I will allocate capital toward in week 74. I am 100% adding at least 1 share to my position in AT&T (T). OHI goes ex-dividend on 7/29, so I am considering grabbing a share prior to the ex-dividend date. I am also considering adding to New York Community Bank (NYCB), and Verizon (VZ). I will probably overthink this, but after last week’s earnings, I am leaning toward T due to the sell-off, and possibly VZ.
Conclusion
The Dividend Harvesting portfolio continues to claw its way back, and it’s within $100 of breaking even. When the tide eventually turns in the markets, I believe the investments I have been making will help me achieve my 3rd investment objective of capital appreciation. I am excited for the future of this series and to see where the dividend ends up several years down the road. I am building out a portfolio of income-producing assets that I want to own and basically constructing a personalized ETF. The Dividend Harvesting portfolio is now generating $512.73 in projected annual income, which is a forward yield of 7.12% across 78 positions.
Be the first to comment