

gorodenkoff/iStock via Getty Images
The investment marketing world urges that every day is a valuable buying opportunity and fear of missing out is a formidable bait.
This is especially true since many participants have never lived through a typical bear market (where the average S&P 500 decline was 29% over 12 months if the economy was not in recession and 42% over 16 months when it was.) Others have seen bear markets but have blocked out the experience (willful blindness) or chalked it up to one-off-bad-luck, unlikely to repeat–aka, this time is different.
After a decade of ‘easy money’ policies aimed at inflating asset prices at all costs, mean reversion is a much-needed value-restoration force. Many securities have made some promising downside progress, year to date, to be sure.
However, in terms of the eight indicators proven to have the best predictive power of forward-10-year real equity returns–we aren’t at enticing investment value yet. Mark Hulbert summarizes the data well in WSJ: Are Stocks Undervalued Yet?:
On balance, these eight indicators at the mid-May low stood at more than twice the average valuation of the bear-market bottoms seen in the past 50 years. And, seen in comparison with all monthly readings of the past 50 years, the average of the eight measurements was in the 88th percentile.
Mark’s summary table below shows the eight latest metrics (in blue) at the top end of the monthly distributions over the past 50 years.
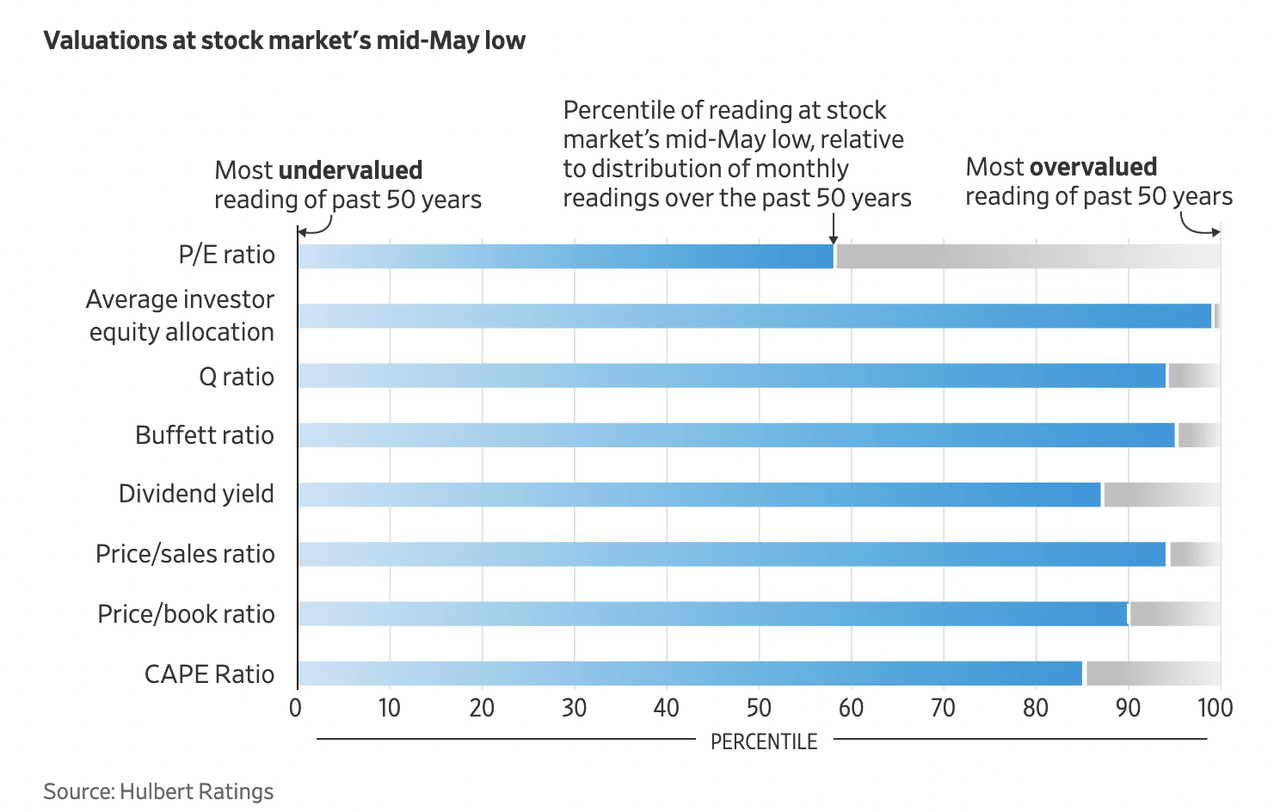
While the S&P 500 trailing 12 months’ earnings per share (first line above) has come down in 2022, as of mid-May, it remained 16% above its average level at the lows of the past 50 years.
Moreover, this price-to-earnings (PE) reading is with backward-looking 12-month corporate earnings still near record highs. As earnings inevitably come off the boil, the dropping denominator will elevate this ratio until the numerator (price) tumbles significantly further–as has happened at every bear market bottom in history.
One of the most telling value indicators of the group is the average investor’s equity allocation as a percentage of their financial assets—equities, debt, and cash (second blue bar above). The latest Fed data available was at the end of 2021 when equity allocations were at the 99th percentile of all readings over the past 50 years.
Infamously, the masses hold the most risk near market tops (and the least cash), so they look smartest just before they lose in bear markets and have the least ability to invest near bottoms (when prospects become the best of the decade). Doing the opposite of this behaviour isn’t easy, but it’s recommended.
History assures that financial stability and meaningful investment opportunity is earned through math-based analysis, patience, and personal discipline. The lack of these is why many win for a while but end up worse.
We will know we are near a valuable cycle low when the majority is liquidating equities and thinks buying is a bad idea; not there yet.
Disclosure: No positions
Editor’s Note: The summary bullets for this article were chosen by Seeking Alpha editors.
Be the first to comment