

PTW
The Q3 Earnings Season for the Gold Miners Index (GDX) has finally begun, and the Australian producers are busy reporting their fiscal Q1 (calendar year Q3) results. One of the most recent names to report is Northern Star Resources (OTCPK:NESRF), a senior gold producer with three major mining centers – Yandal, Kalgoorlie, and Pogo. While the fiscal Q1 results came in a little softer than I expected, this looks largely priced into the stock, especially with Northern Star more than 60% from its all-time highs. Let’s take a closer look below:
Unless otherwise noted, all figures are in Australian Dollars ($A), and all exchange rates are based on $0.70 AUD/USD. Northern Star trades significant volume daily on the Australian Stock Exchange (NST.ASX) but trades minimal volume on the OTC Market. Therefore, the best way to trade the stock is on the Australian Stock Exchange. There is a significant risk to buying on the OTC due to wide bid/ask spreads, low liquidity, and no guarantee of future liquidity.
Fiscal Q1 Production & Sales
Northern Star Resources released its fiscal Q1 2023 (calendar year Q3) results last month, reporting quarterly production of ~366,600 ounces of gold, a 2% decline from the year-ago period. The lower production was related to a weaker quarter at Jundee, Kanowna Belle/HBJ, and Thunderbox, offset by higher output from its Pogo Mine in Alaska. The lower production from Kanowna Belle/HBJ was related to lower throughput related to the Jubilee Mill being placed on care & maintenance to optimize cash flow, as well as lower grades (2.5 grams per tonne gold vs. 3.0 grams per tonne of gold) in the period. At Thunderbox, output was lower due to lower throughput and recovery rates, but we will see a significant step-up in throughput with the ramp-up of the nearly completed mill expansion.
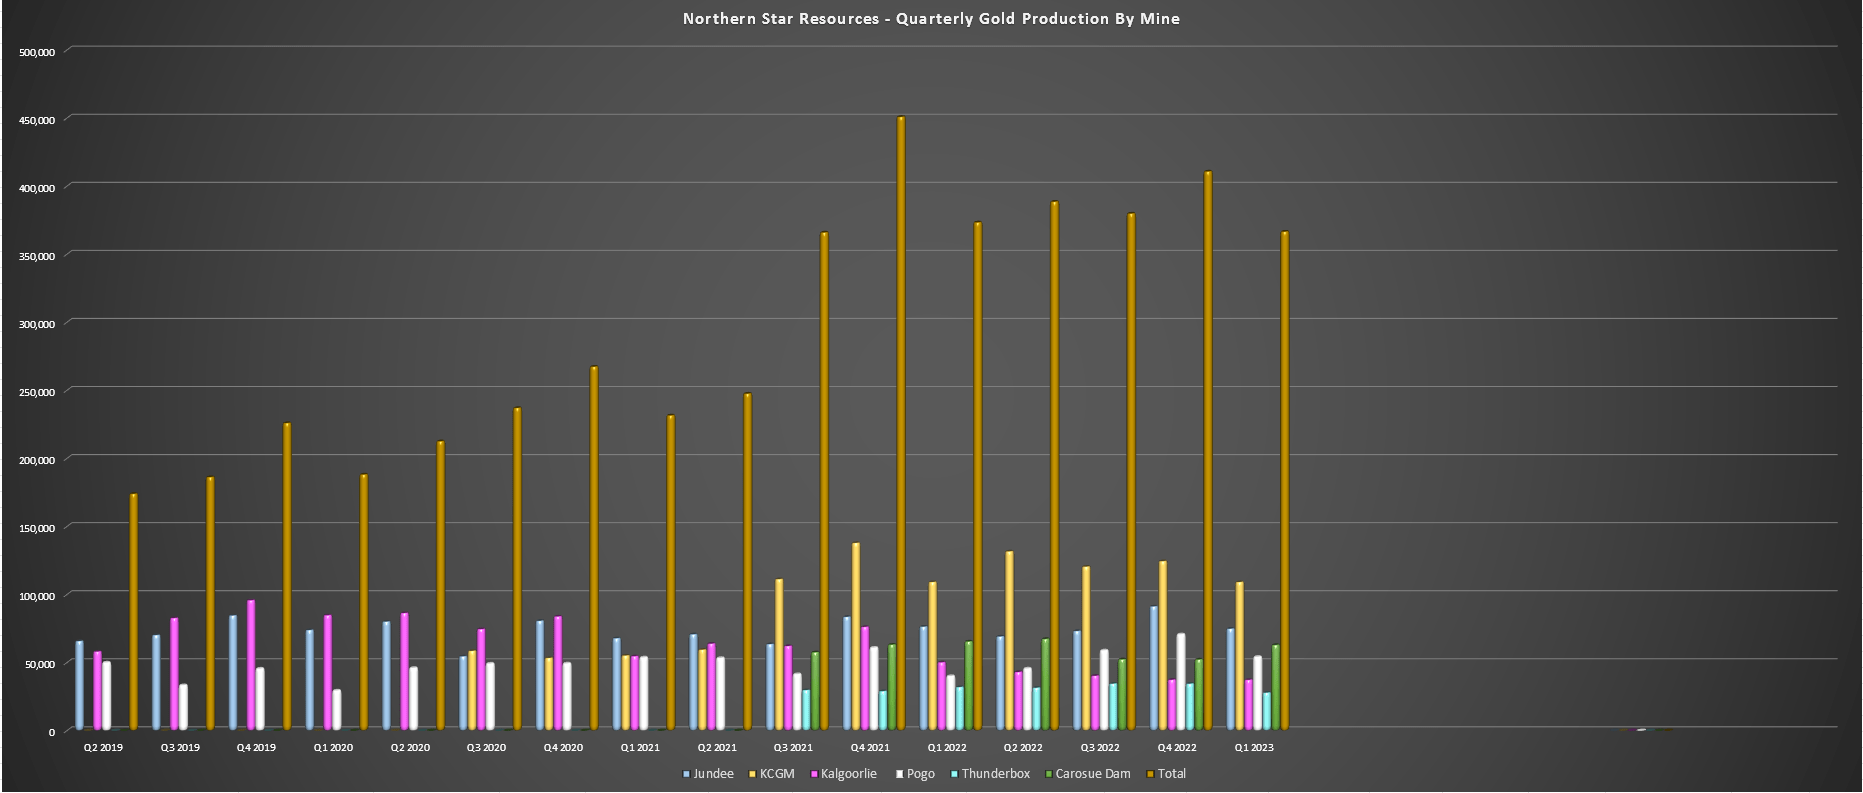
Northern Star – Quarterly Production by Mine (Company Filings, Author’s Chart)
Moving over to KCGM, the operation had another solid quarter in fiscal Q1 with ~3.22 million tonnes processed at an average grade of 1.20 grams per tonne of gold and 86% recovery rates. This translated to ~109,200 ounces of gold produced in the quarter, marginally ahead of fiscal Q1 2022 levels. Northern Star noted in its prepared remarks that it’s seeing lower diesel usage and improved speeds from its new open-pit mining fleet, and the new fleet helped with the annualized material movement of ~82 million tonnes per annum in fiscal Q1 2022 and ~97 million tonnes per annum for the month of September. These figures align with its goal of 80 to 100 million tonnes per annum of material movement until FY2026.
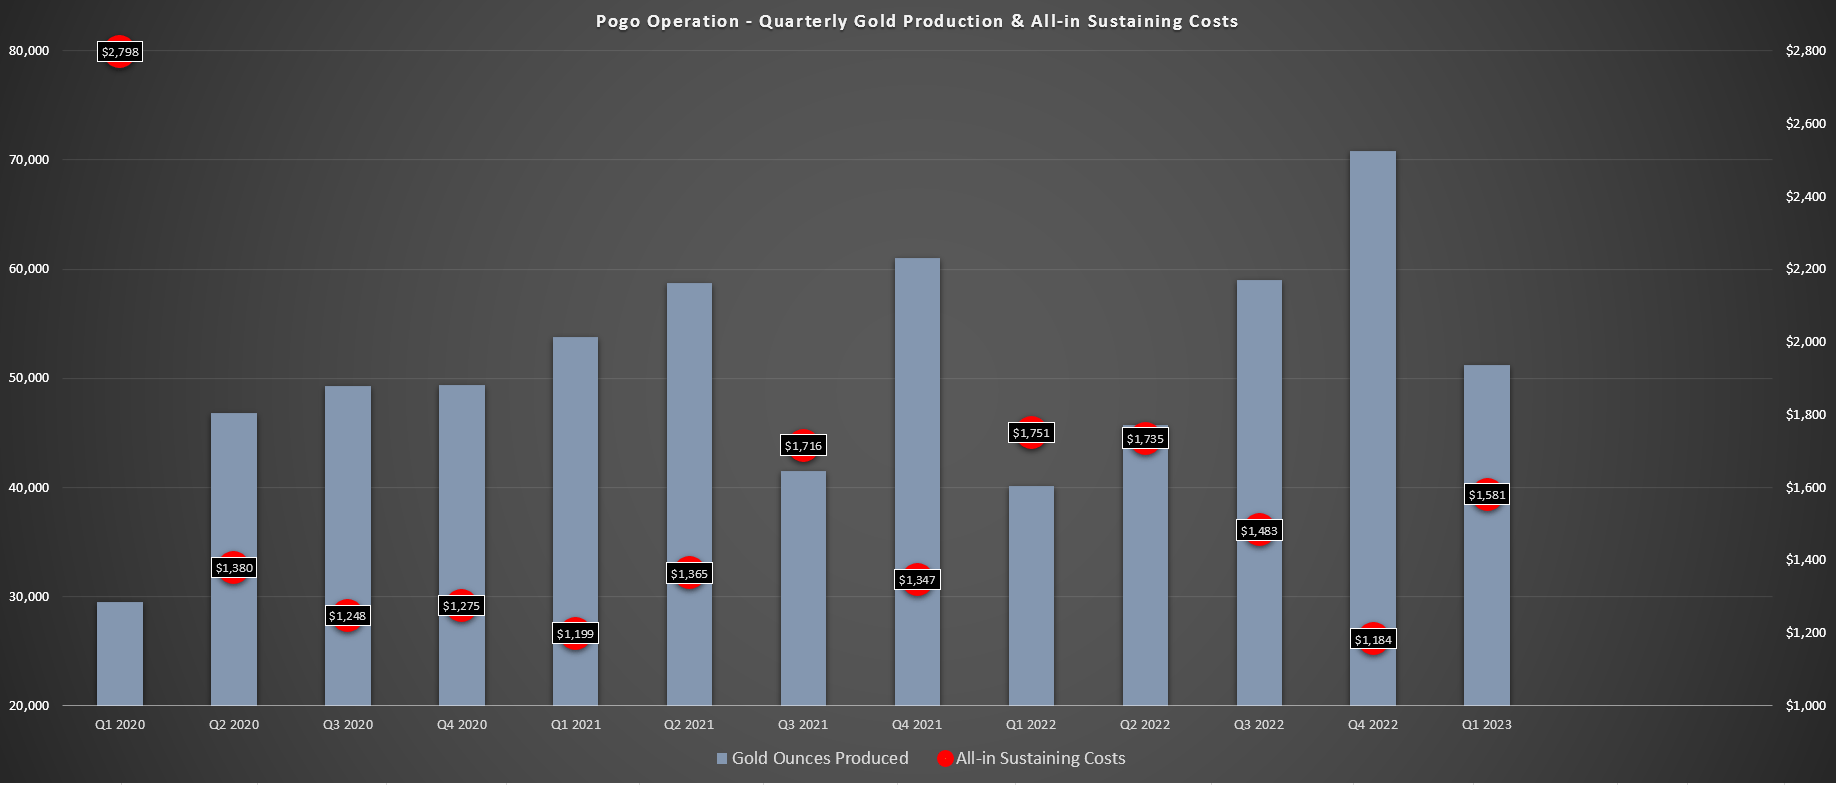
Pogo – Quarterly Production & Costs (Company Filings, Author’s Chart)
Finally, the company had another solid quarter at Pogo, reporting quarterly production of ~54,300 ounces, a 35% increase from the year-ago period. This was related to a much higher throughput of ~319,400 tonnes in fiscal Q1, with an increase in mill capacity to 1.3 million tonnes per annum (1.0 million tonnes per annum previously) following last year’s commissioning. The higher throughput rate combined with an increased contribution from stope vs. development ore is expected to allow the operation to deliver a record year in FY2023, with the production of 260,000 to 290,000 ounces at sub $1,400/oz costs. While output is tracking below this level, this is partially related to a planned mill shut and lower grades due to sequencing. Notably, mine development meters are above plan despite removing one jumbo.
Costs & Margins
Looking at costs and margins, Northern Star saw higher costs in the period, which isn’t surprising due to the tight labor market in Western Australia and inflationary pressures being felt sector-wide. During fiscal Q1, all-in-sustaining costs came in at A$1,788/oz [US$1,228/oz], which was up from A$1,594/oz in the year-ago period. This increase is in line with the 9-13% increase felt by many producers in the sector over the past year due to rising fuel, steel, cyanide, and reagent prices, increased labor/contractor costs, and additional impact from supply chain headwinds.
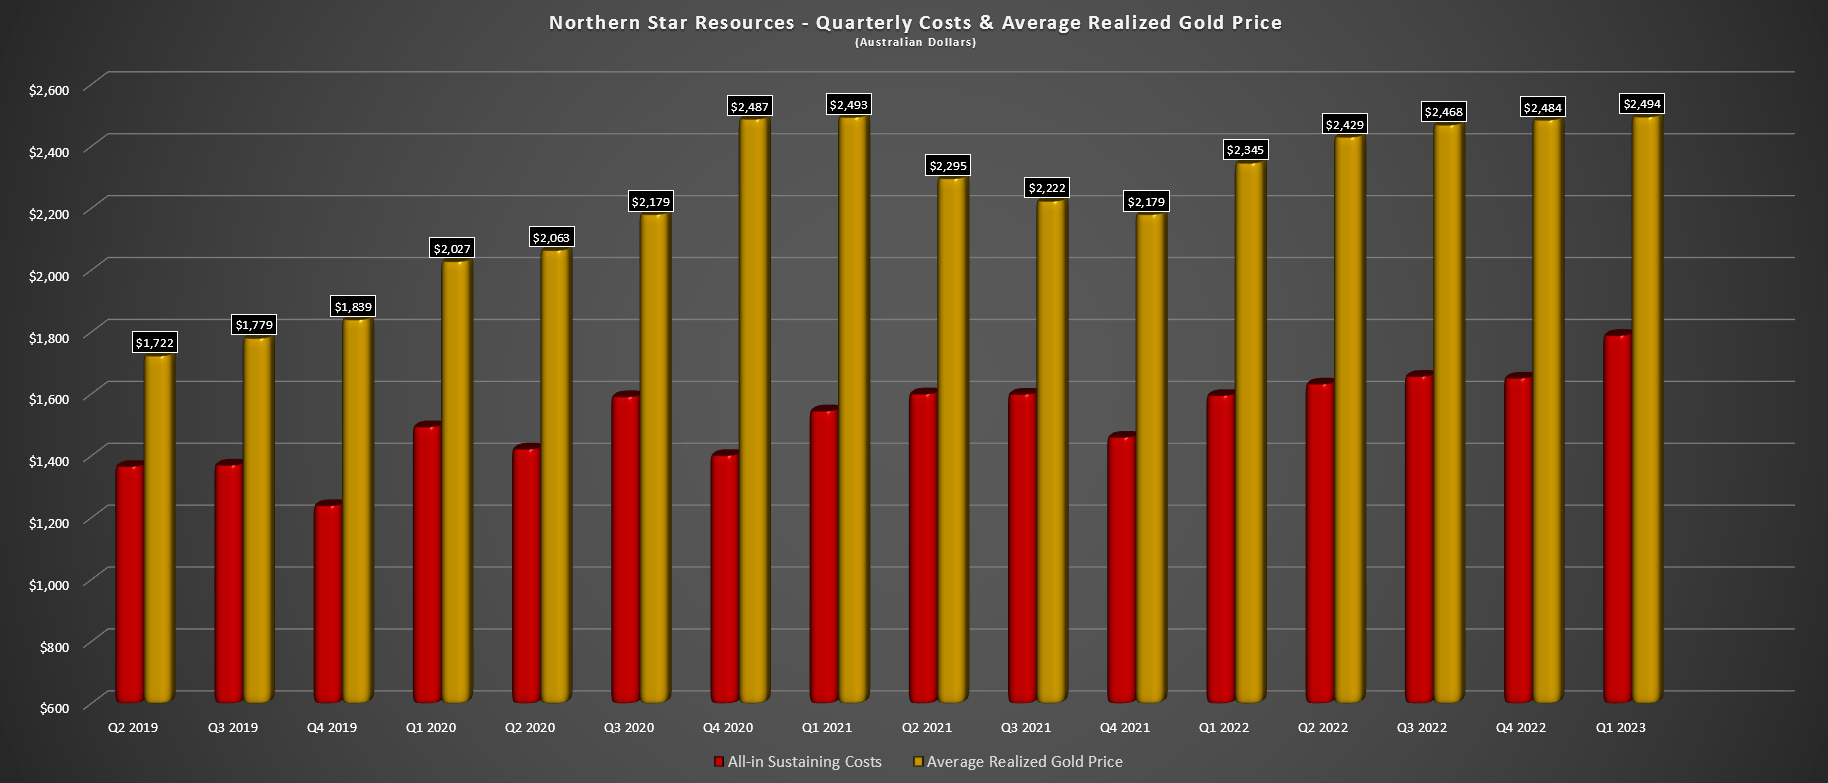
Northern Star – Quarterly Costs & Average Realized Gold Price (Company Filings, Author’s Chart)
Fortunately, the average realized gold price was higher than Q1 2022 levels due to reduced deliveries into low-priced hedges (196,700 ounces of deliveries at A$2,242/oz in fiscal Q1 2022). This resulted in a higher average realized gold price for Northern Star and only slight margin compression on a year-over-year basis (A$706/oz vs. A$751/oz) despite the weakness in the gold price. The good news is that while costs were elevated in fiscal Q1 due to fewer ounces sold (planned shutdowns at KCGM and Pogo that led to lower production and lower production at Thunderbox ahead of the major throughput increase), we should see costs come in below A$1,670/oz on a full-year basis. So, relative to fiscal Q1 2023 levels, costs are expected to decline nearly 7% on a full-year basis.
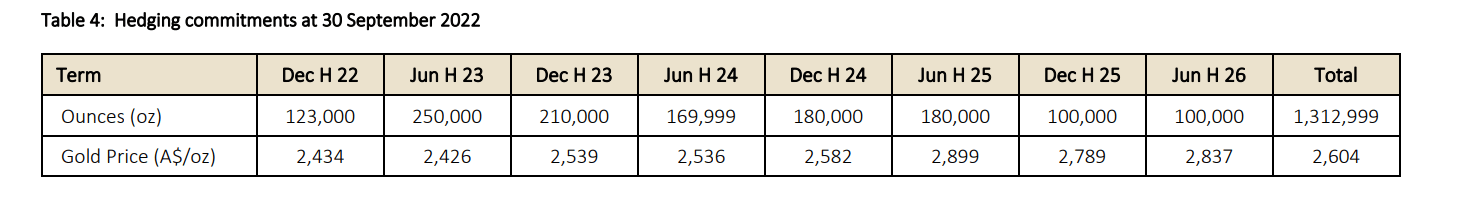
Northern Star – Hedges (Company Report)
Looking ahead, we can see that Northern Star has roughly one year of gold production between now and FY2026 that is hedged at prices above A$2,600/oz, providing protection against any further gold price weakness. While these prices aren’t much above current levels, it provides security during its growth phase as the company aims to increase production to 2.0 million ounces per annum at ~A$1,520/oz costs [US$1,065/oz]. This would translate to industry-leading costs vs. ballpark estimates of US$1,300/oz costs industry-wide in FY2025/FY2026, with some inflationary pressures expected to remain and low single-digit annual wage inflation.
Financial Results
Finally, looking at Northern Star’s financial results, the company reported quarterly revenue of A$921 million, an improvement vs. A$822 million in the year-ago period. The higher revenue benefited from a stronger average realized gold price and similar sales volume, and we should see stronger revenue in H2 2023 as we see a higher contribution from the company’s Yandal Operations with increased throughput at Thunderbox. Meanwhile, from a cash flow standpoint, net mine cash flow came in at A$78 million, down from A$210 million but with much higher capital spending in the period (A$219 million). Let’s look at the valuation:
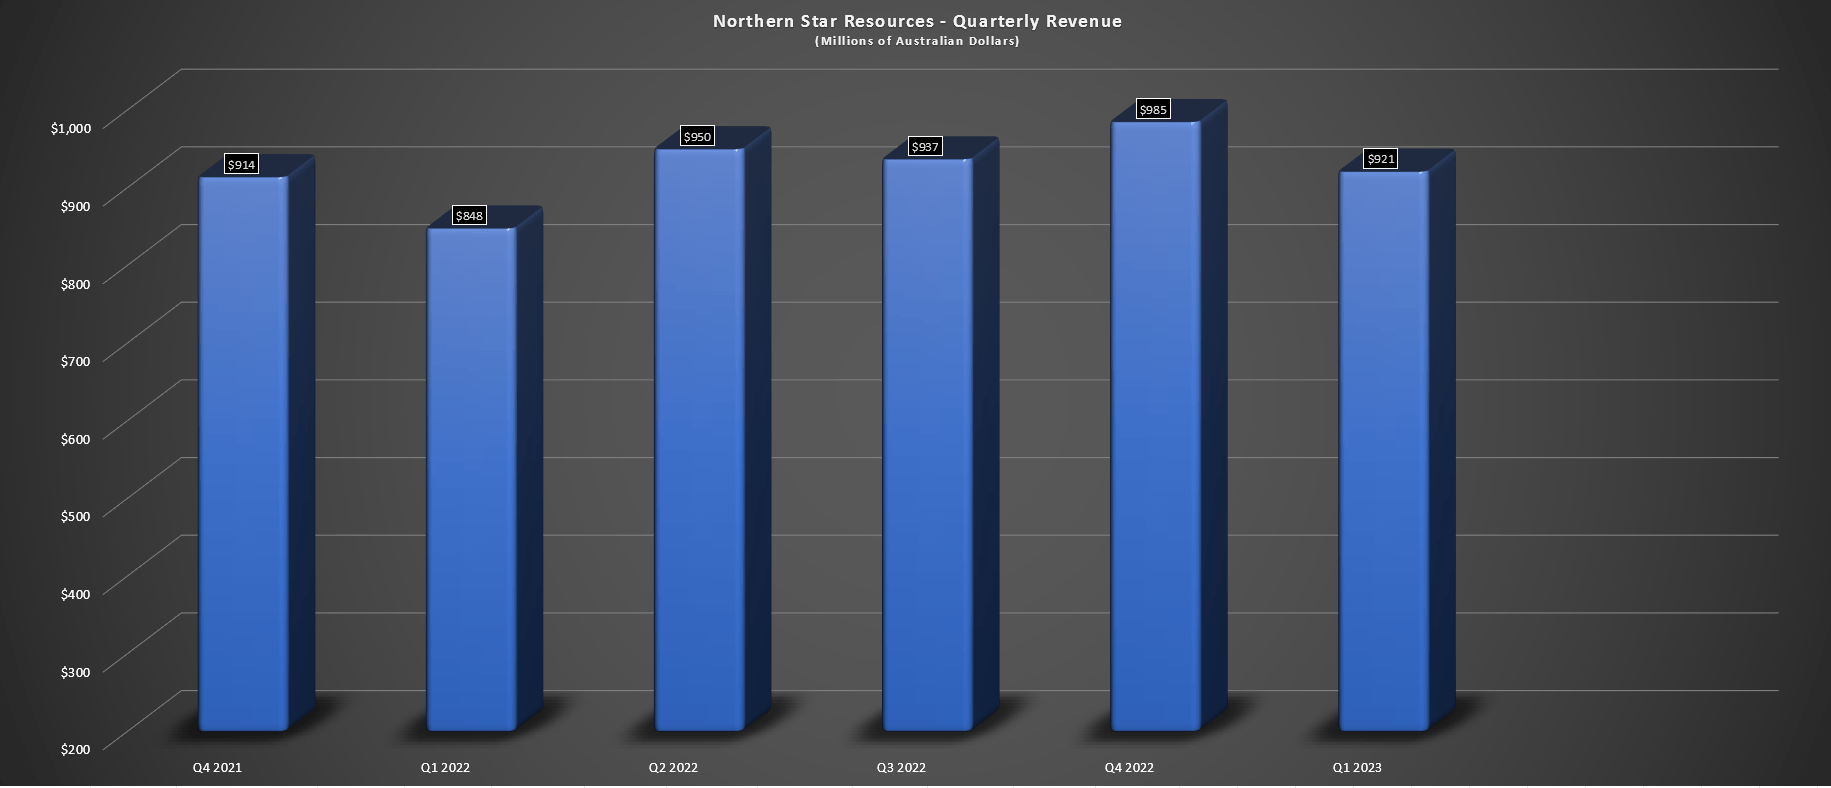
Northern Star – Quarterly Revenue (Company Filings, Author’s Chart)
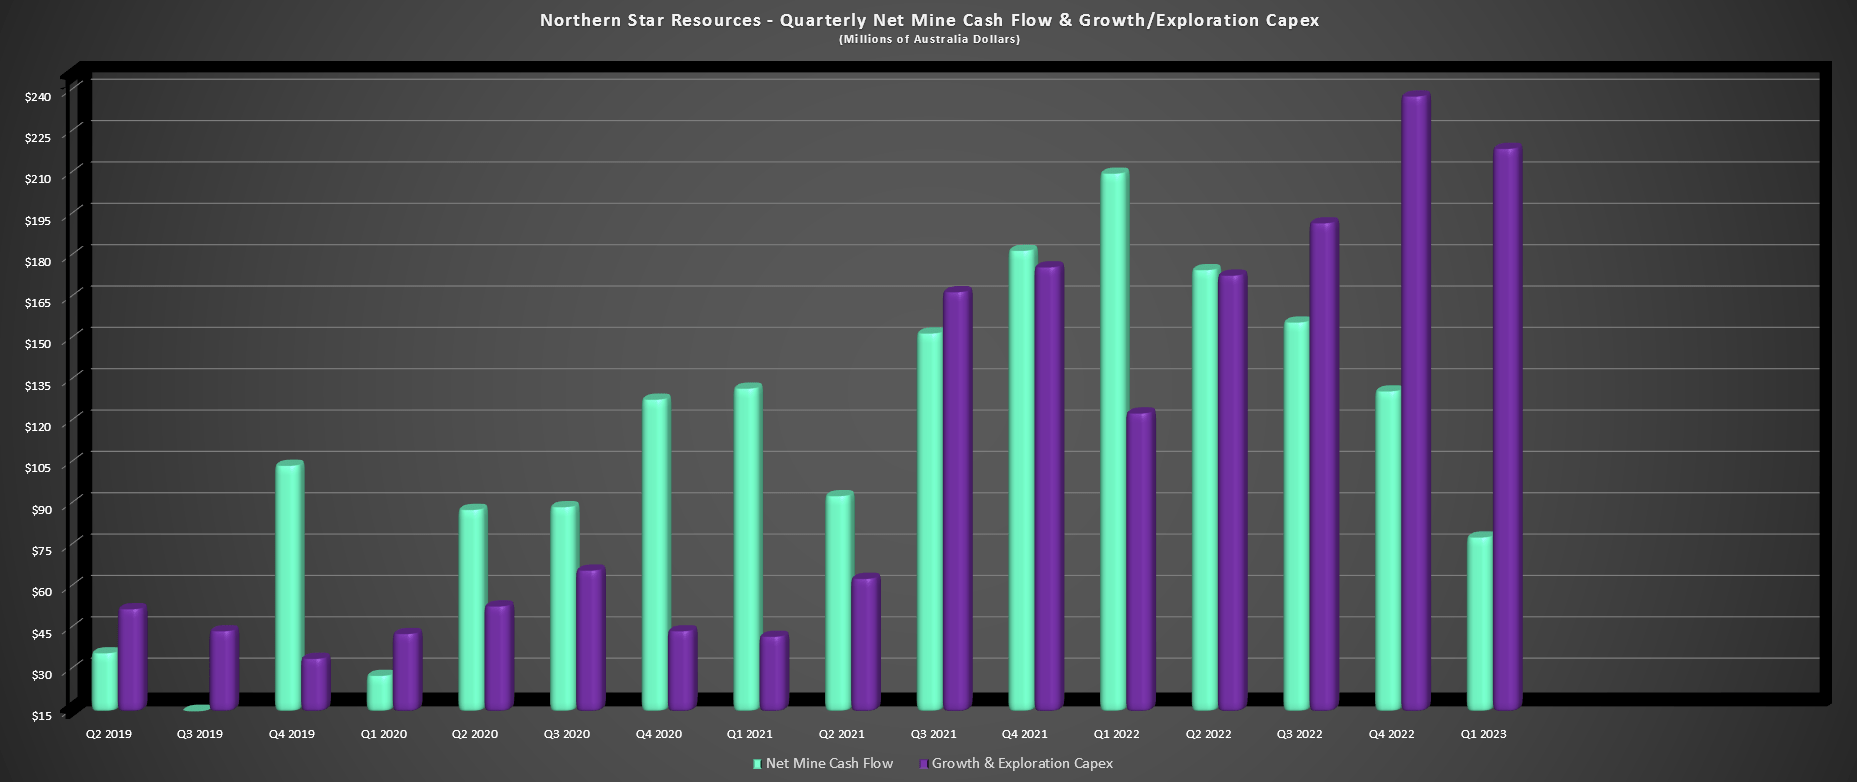
Northern Star – Net Mine Cash Flow & Growth/Exploration Capex (Company Filings, Author’s Chart)
Valuation
Based on ~1167 million shares outstanding and a share price of US$5.75, Northern Star trades at a market cap of US$6.7 billion and an enterprise value of US$6.6 billion. This is a very attractive valuation for a strictly Tier-1 jurisdiction producer (Western Australia, Alaska) that’s steadily growing to be a 2.0 million-ounce per annum producer by FY2026. If we compare the company’s market cap to an estimated net asset value of US$6.9 billion, Northern Star is trading at a slight discount on a P/NAV basis (0.97x), which is abnormal for a company with a diversified portfolio of assets in safe jurisdictions with a slightly below average cost profile (FY2023 guidance of A$1,660/oz or US$1,162/oz).
Given that I see a fair multiple for the stock being 1.40x P/NAV due to its superior jurisdictional profile vs. most major gold companies (100% Tier-1 jurisdictions) and its strong track record (industry-leading return on equity), I see a fair value for Northern Star of US$9.66 billion or US$8.25 per share. This translates to a 44% upside from current levels. Based on a required 35% discount to fair value to justify starting new positions in mid-cap stocks, I would view any pullbacks below US$5.35 [A$7.90] as buying opportunities.
Summary
For investors looking for exposure to the gold price without the added risk of less favorable mining jurisdictions or the risk of limited diversification (less than three mines), Northern Star and Agnico Eagle continue to be two of the best options sector-wide. While my preference continues to be Agnico Eagle due to its more lower-cost profile, lack of hedges, and stronger development pipeline, I continue to see Northern Star as a top-10 gold producer and one of the most attractive names in the sector from a valuation standpoint. So, if I were looking to add exposure to gold miners to gain more leverage to the gold price, I see Northern Star as a solid buy-the-dip, and I would expect any dips below A$7.90 to provide buying opportunities.
Be the first to comment