

Allieca/iStock via Getty Images
The Q4 and FY2021 Earnings Season for the Gold Miners Index (GDX) is finally coming to a close, and one of the first companies to report its results was Northern Star Resources (OTCPK:NESRF). Overall, the company put together a solid quarter in fiscal Q2 2022 (CY Q4-2021), reporting sales of ~393,000 ounces of gold, quarterly revenue of A$950 million, and a slight improvement in all-in sustaining cost margins on a sequential basis. However, the real story for Northern Star is its growth, which could top 2 million ounces per annum in FY2026. Given this favorable combination of growing production at higher margins, I would view any pullbacks below US$6.95 as low-risk buying opportunities.
Northern Star trades significant volume each day on the Australian Stock Exchange (NST.ASX) but trades very limited volume on the OTC Market. Therefore, the best way to trade the stock is on the Australian Stock Exchange. There is a significant risk to buying on the OTC due to wide bid/ask spreads, low liquidity, and no guarantee of future liquidity. All figures in this article are in Australian Dollars unless otherwise noted.
Northern Star Operations (Company Presentation)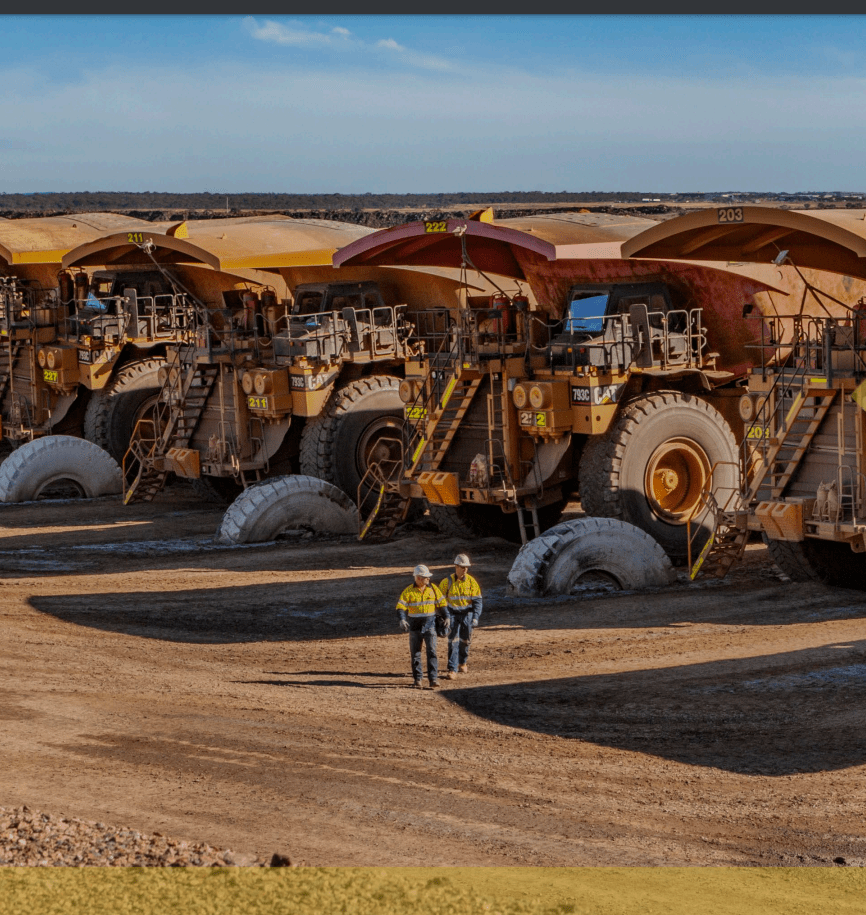
Northern Star Resources (“Northern Star”) released its fiscal Q2 2022 results (calendar year Q4 2021 results) earlier this year, reporting quarterly gold production of ~388,600 ounces, a 4% increase on a sequential basis. The higher production was driven by another solid quarter from the newly consolidated KCGM (Australian Super Pit), another strong quarter from Carosue Dam, and improving production at Pogo, though production is tracking well behind full-year guidance at this asset. Let’s take a closer look at the quarter below:
Northern Star – Quarterly Production by Mine (Company Filings, Author’s Chart)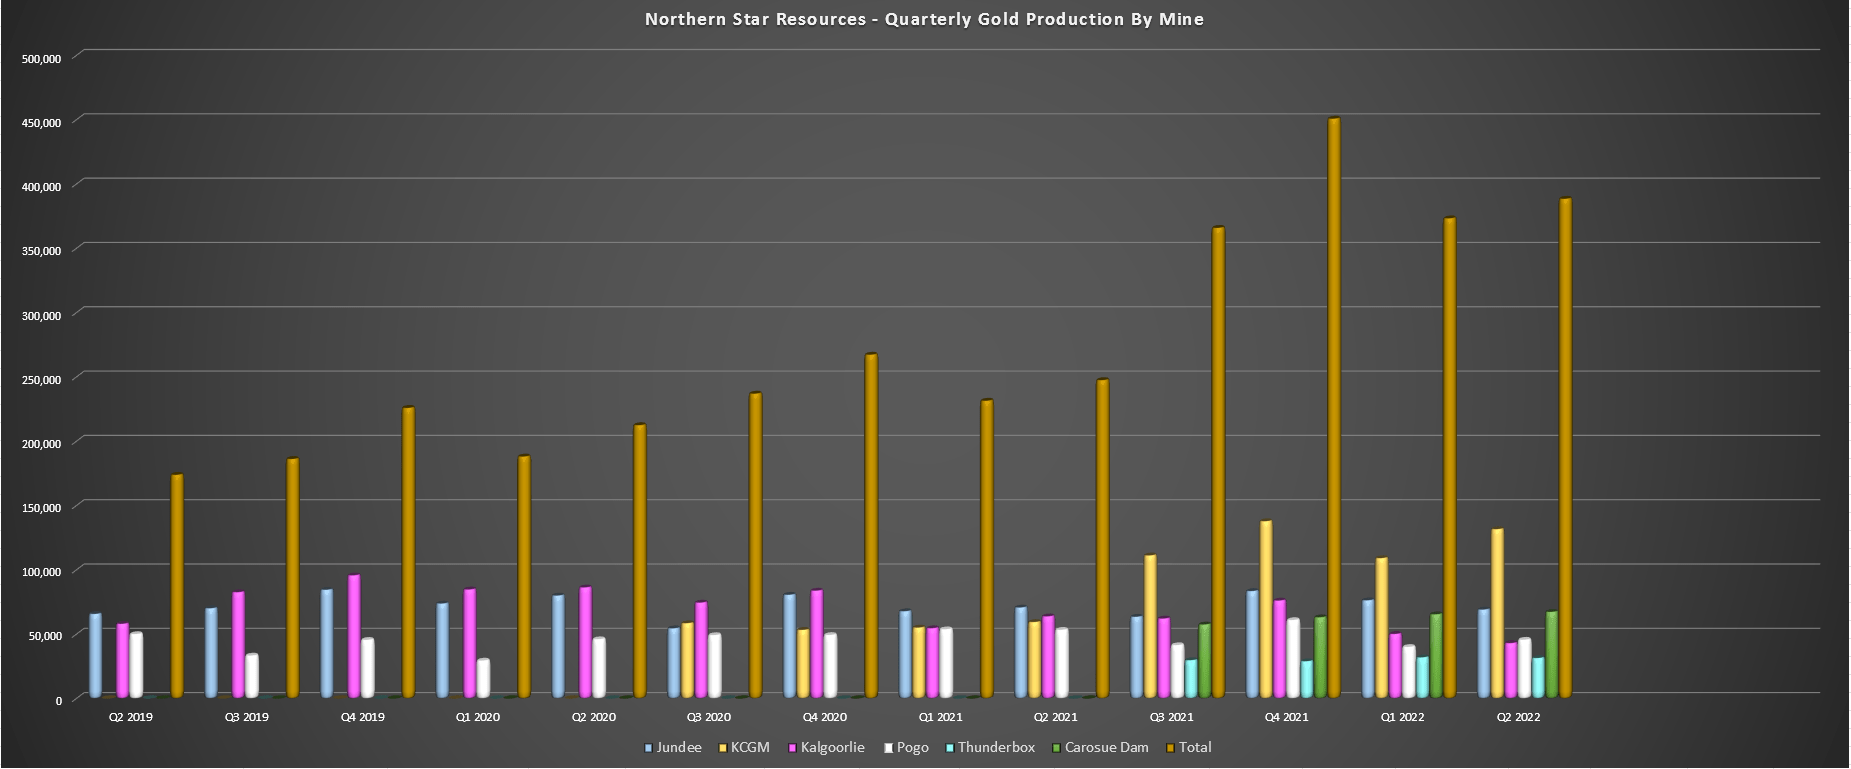
As shown in the chart above, Northern Star has seen a solid start to FY2022, with H1-2022 production of ~762,000 ounces and H2 gold sales of ~780,000 ounces. This has placed the company on track to meet its guidance mid-point of ~1.60 million ounces of gold this year, given that production is back-end weighted, with higher mining rates expected at Pogo and higher grades at Jundee. While costs are tracking above guidance at A$1,613/oz [US$1,194/oz], we should see an improvement in costs in H2 as well.
Looking at individual operations, it’s clear that it was another solid quarter from KCGM, with the operation contributing ~131,700 ounces, its second-best quarter since the Saracen/Northern Star merger. This was helped by higher throughput at improved grades, with ~3.57 million tonnes processed at an average grade of 1.4 grams per tonne gold. Meanwhile, at Carosue Dam, quarterly production also improved sequentially, increasing more than 3% to ~67,400 ounces.
Similar to KCGM, this was driven by higher throughput, with a recently completed mill expansion to 3.2 million tonnes per annum. As is clear from the production results (~1.02 million tonnes processed), the mill is operating well above nameplate capacity and is on track to process over 3.8 million tonnes this year at the current rate. Moving south to Kalgoorlie, production dipped sharply to ~43,100 ounces, with a much lower mined grade in the period (2.5 grams per tonne gold). Fortunately, KCGM and Carosue Dam more than picked up the slack for the Kalgoorlie Production Centre, with total production coming in at ~244,000 ounces.
Northern Star Operations (Company Report)
At the Yandal Production Centre, it was a weaker quarter, with Jundee production dipping to ~69,200 ounces and Thunderbox production sliding nearly 2% sequentially to ~31,500 ounces. However, ignoring the headline numbers of ~7% lower production sequentially, the Thunderbox Mill Expansion remains on track for H1 2023, and record stopping production was achieved for the quarter. Meanwhile, Jundee also reported a record quarterly development advance of 6,800 meters. Despite the higher operating costs and capex (A$77 million growth capital), net mine cash flow was flat in fiscal Q2 2022.
Finally, at Pogo in Alaska, this asset had another soft quarter, even though production did improve on a sequential basis. As the chart below shows, production increased more than 10% sequentially (~45,700 ounces) but was up against easy comps. This is because the tie-in and commissioning of the processing plant led to 24 days of downtime in fiscal Q1 2022. During fiscal Q2 2022, Pogo processed ~255,100 ounces at an average grade of 6.6 grams per tonne gold, a significant improvement in throughput following the mill expansion to 1.3 million tonnes per annum, but at lower processed grades.
While it’s clear that production is down sharply from year-ago levels (fiscal Q2 2021: ~53,400 ounces), it’s important to note that Pogo will have a much better H2, and costs will drop materially in the second half. Notably, while production was lower year-over-year, mining rates improved in December, increasing to 1,470 meters. Unfortunately, costs were up sharply, partially related to much fewer ounces sold, with costs increasing more than 20% year-over-year to US$1,735/oz. As of the end of H1, Pogo is tracking miles behind its guidance mid-point of ~235,000 ounces, with just ~90,000 ounces produced year-to-date.
Pogo Mine – Production & Costs (Company Filings, Author’s Chart)
The good news is that the combination of a sharp decline in COVID-19 cases in Alaska and Western Australia’s border restrictions being relaxed should help the operation going forward (ex-pat travel availability), with the goal of much higher mining rates in H2 2022 (January through June). Given that Pogo continues to drag Northern Star’s operating costs higher with all-in sustaining costs well above the industry average, growth to 300,000 ounces per annum at much lower costs would help improve the company’s cost profile relative to peers. For now, the mill expansion to 1.3 million tonnes per annum is complete, and the next key will be sustaining development rates of 1,500 meters per month (nearly achieved in December).
Alaska COVID-19 Cases (NYTimes.com, US Department of Health & Human Services)
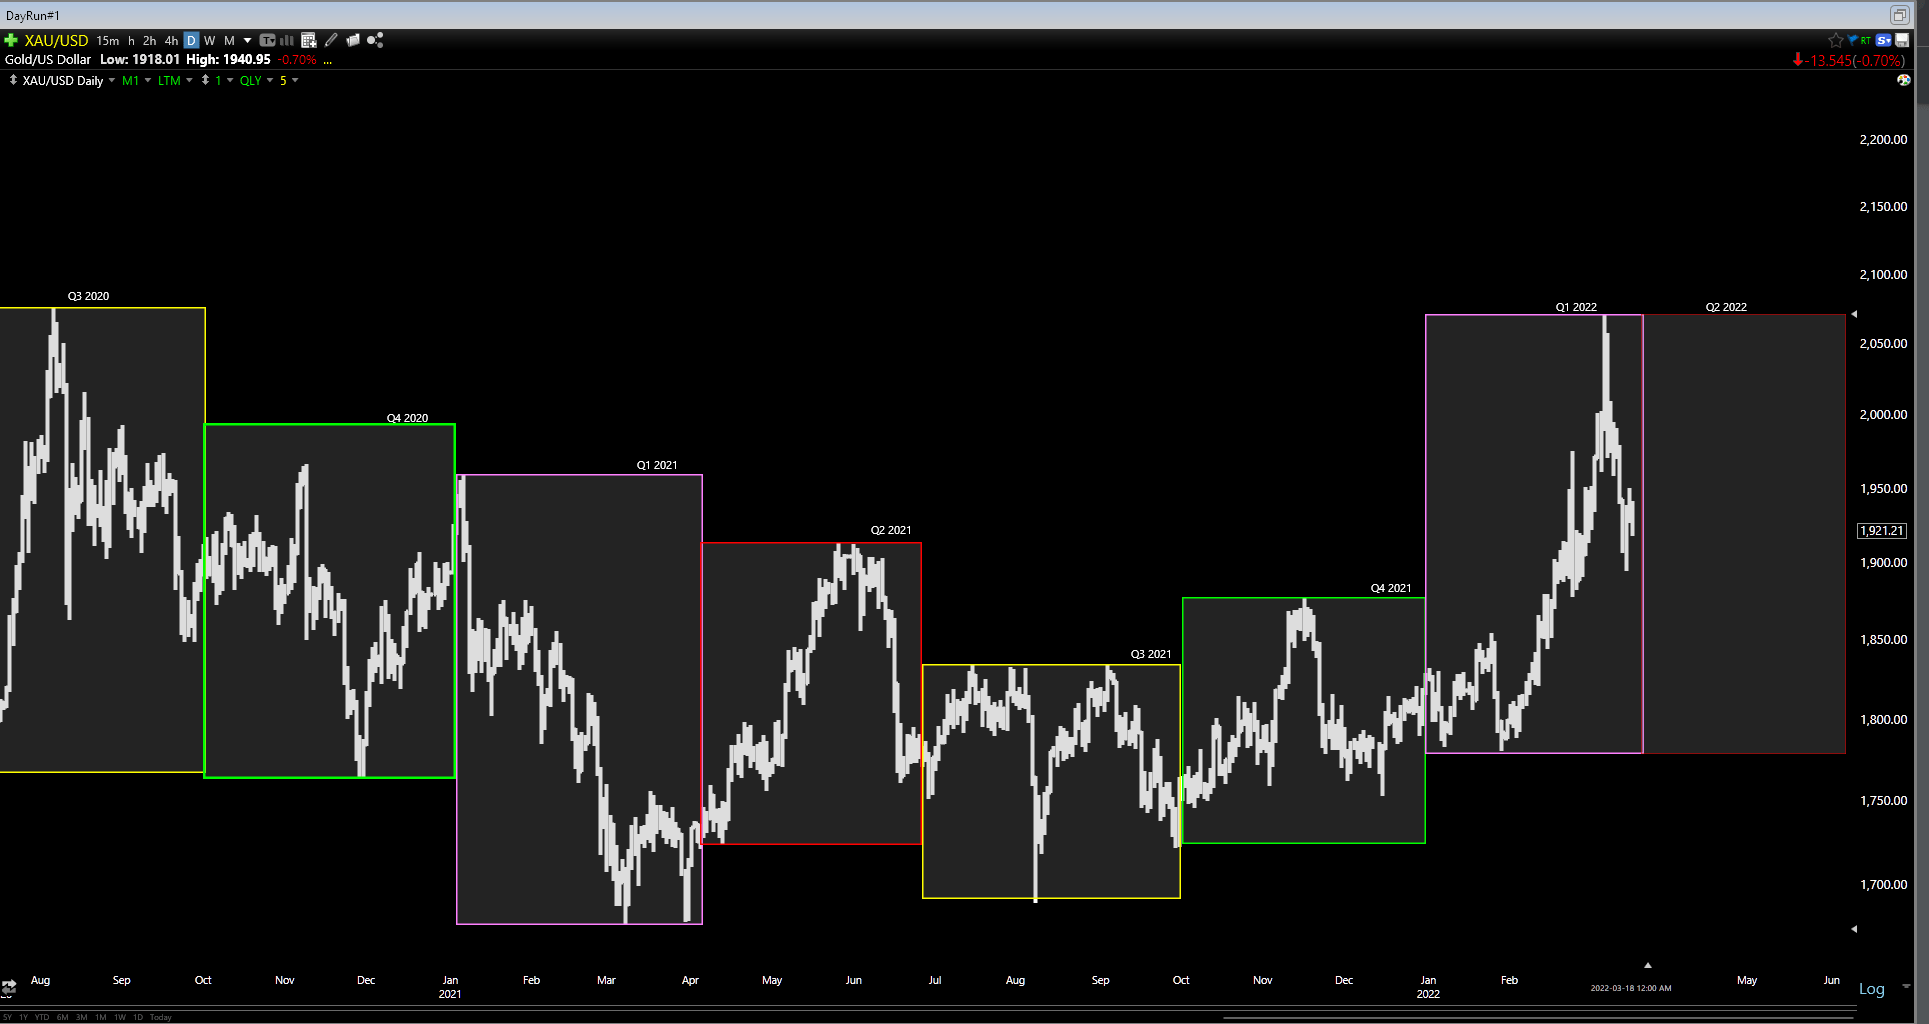
Moving over to costs and Northern Star’s average selling price, we can see that costs increased sequentially in fiscal Q2 2022, up from A$1,594/oz (Q1 2022) to A$1,631/oz. The company saw higher costs at Carosue Dam, Kalgoorlie, and Jundee, with the latter processing much lower grades, offset by very respectable costs at KCGM (A$1,344/oz). Fortunately, the company benefited from a higher average realized gold price (A$2,429/oz vs. A$2,345/oz), so AISC margins improved by more than 4% to A$798/oz. Given the strength in the gold price combined with back-end weighted production/sales, Northern Star should see meaningful margin improvement in H2 2022.
Northern Star – Quarterly Costs & Average Realized Gold Price (Company Filings, Author’s Chart) Gold Futures Price (TC2000.com)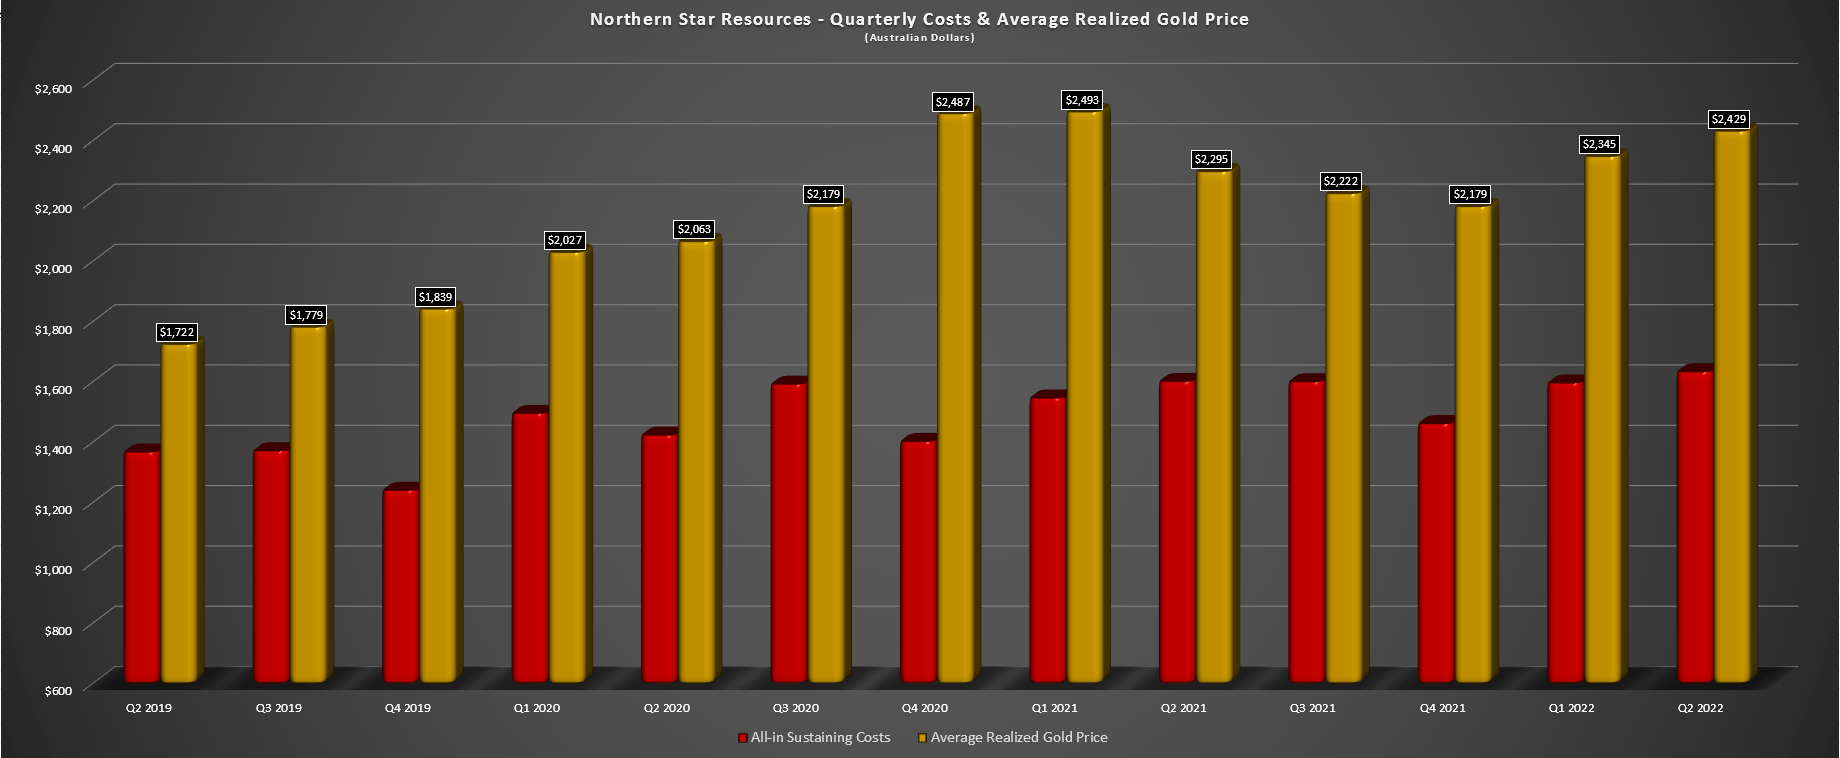
Financial Results
Let’s take a look at Northern Star’s financial results below. As shown below, we can see that quarterly revenue improved to A$950 million, helped by a 2% increase in ounces sold on a sequential basis and a higher average realized gold price. It’s worth noting that revenue also benefited from fewer ounces being sold into hedges in the period, evidenced by ~197,000 ounces delivered in Q1 2022 compared to ~117,000 ounces in Q2 2022. Based on the higher average realized gold price thus far in fiscal Q3 2022 (March quarter) and expectations of higher production, we should see another quarter for revenue in the upcoming quarter.
Northern Star – Quarterly Revenue (Company Filings, Author’s Chart)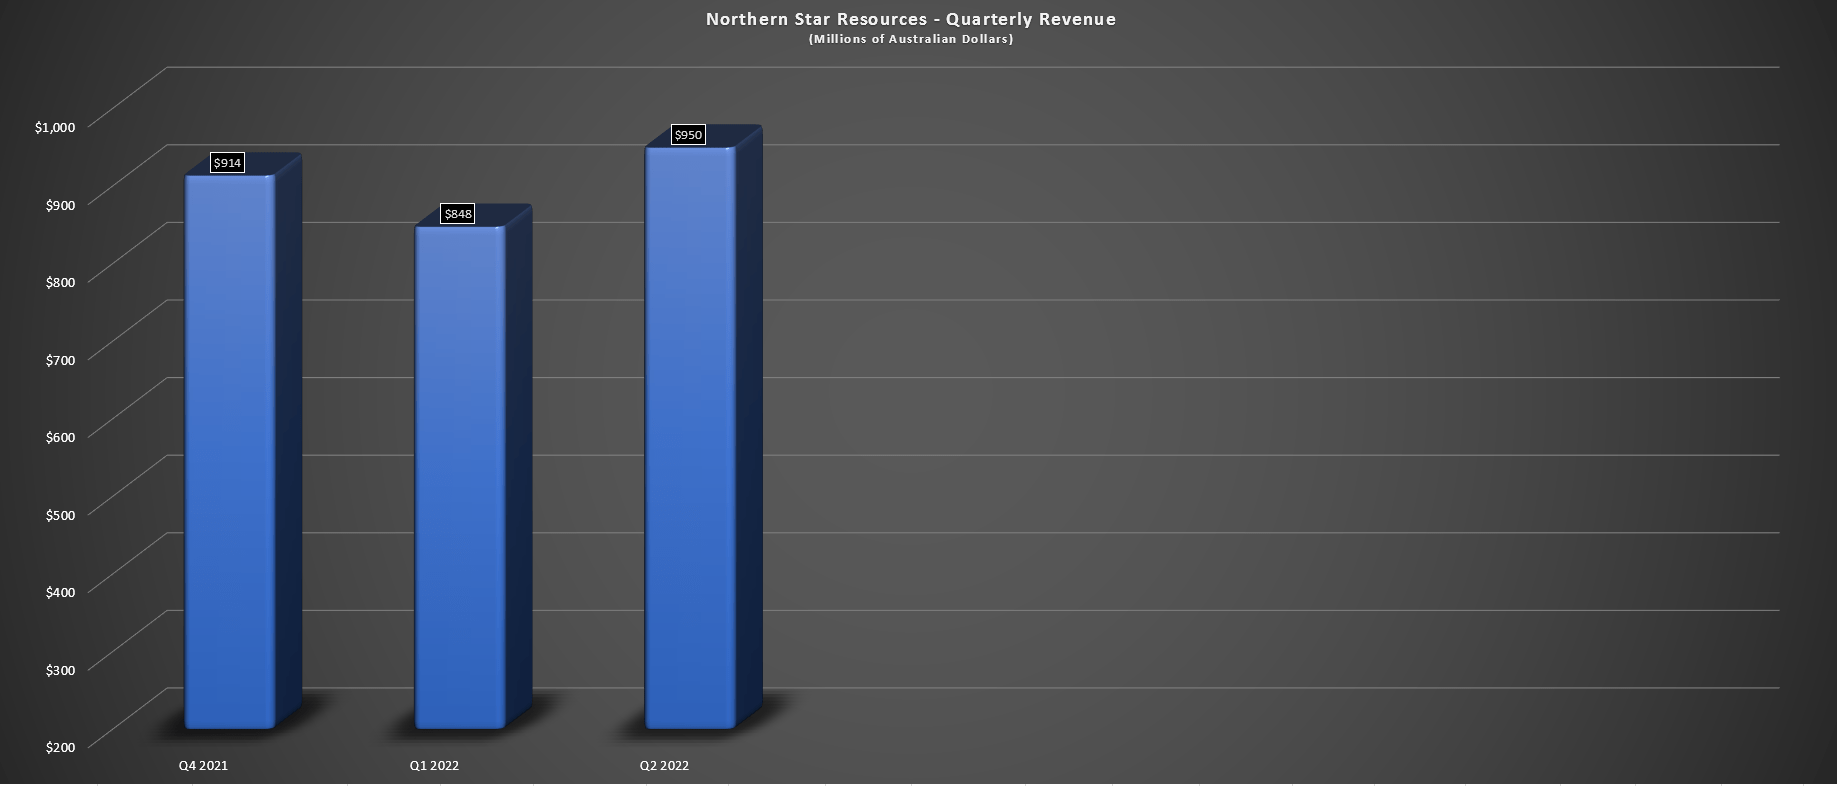
Moving over to quarterly net mine cash flow and growth/exploration capex, Northern Star also had a solid quarter. This was evidenced by Q2 net mine cash flow of A$175 million, despite significant spending in the quarter (A$173 million). Year-to-date, Northern Star has generated operating cash flow of A$622 million and EBITDA of A$926 million. The increase in revenue and cash helped the company improve its balance sheet, ending H1 2022 with A$588 million in cash and bullion, up from A$345 million in the year-ago period, and total liquidity of A$1.29 billion.
Northern Star – Quarterly Net Mine Cash Flow & Capex (Company Filings, Author’s Chart)
Negatives
The two negatives worth reporting in the quarter were the fact that ounces hedge increased yet again, with the company adding another ~405,000 ounces to its hedge book at an average price of A$2,506/oz [US$1,854/oz]. This is significantly below current gold prices, and while this is in line with the strategy employed by many gold producers, it gives Northern Star slightly less exposure to rising gold prices than many of its peers. It is worth noting that this only represents ~20% of gold production looking out to FY2024, but it’s still a large proportion of annual production when we compare this to 0% hedging for most million-ounce producers.
The other negative news was that Osisko Mining (OTCPK:OBNNF) has announced that it will be going ahead at Windfall without Northern Star, which removes what would have been a nice boost to growth outside of the company’s current growth plan. This is because Windfall looks like it could produce over 330,000 ounces of gold in its first few years of production, which would have translated to nearly 8% production growth for Northern Star, assuming a 50/50 joint-venture. Even without Windfall, Northern Star still has a very respectable growth profile. Still, for a slightly higher-cost producer (AISC: ~$1,130/oz), the addition of a sub $700/oz AISC mine would have certainly provided a meaningful margin boost.
Valuation & Technical Picture
Based on ~1.17 billion shares outstanding and a share price of US$7.85, Northern Star trades at a market cap of ~US$9.2 billion, a very reasonable valuation for a company with a path to ~2.0 million ounces of production per annum. This is especially true given that Northern Star has arguably the best jurisdictional profile sector-wide with 100% of production coming from Tier-1 jurisdictions and is one of the few 1.5+ million-ounce producers with 25% growth looking out to 2025. Assuming the company can deliver on its growth plans, I would not be surprised to see the stock trade above US$10.50 in the next 18 months, translating to more than 35% upside from current levels.
NESRF Daily Chart (TC2000.com)
However, while Northern’s valuation of less than 1.20x P/NAV is quite reasonable, the stock has rallied sharply off its lows since I noted that the stock had dropped into a low-risk buy zone below $6.60 in January. In fact, the stock is now up 30% off these lows in less than 40 trading days. This has degraded the reward/risk short-term, with the stock now having US$1.65 in potential downside to support (US$6.20) and less than US$1.00 in upside to resistance. So, with a current reward/risk ratio of 0.61 to 1.0, I don’t see this as a low-risk buy point from a trading standpoint.
For Northern Star to dip back into a favorable buy zone, the stock would need to decline to US$6.95 or lower, where the reward/risk ratio would improve to ~2.5 to 1.0. dip of this magnitude may not occur given the recent strength in the gold price, but I prefer to buy when stocks are hated, and I am rigid with my preferred buy points. Hence, if I were looking to add to a position or start a new position in the stock, this would be the area I would be watching closely.
KCGM Operations (Company Presentation)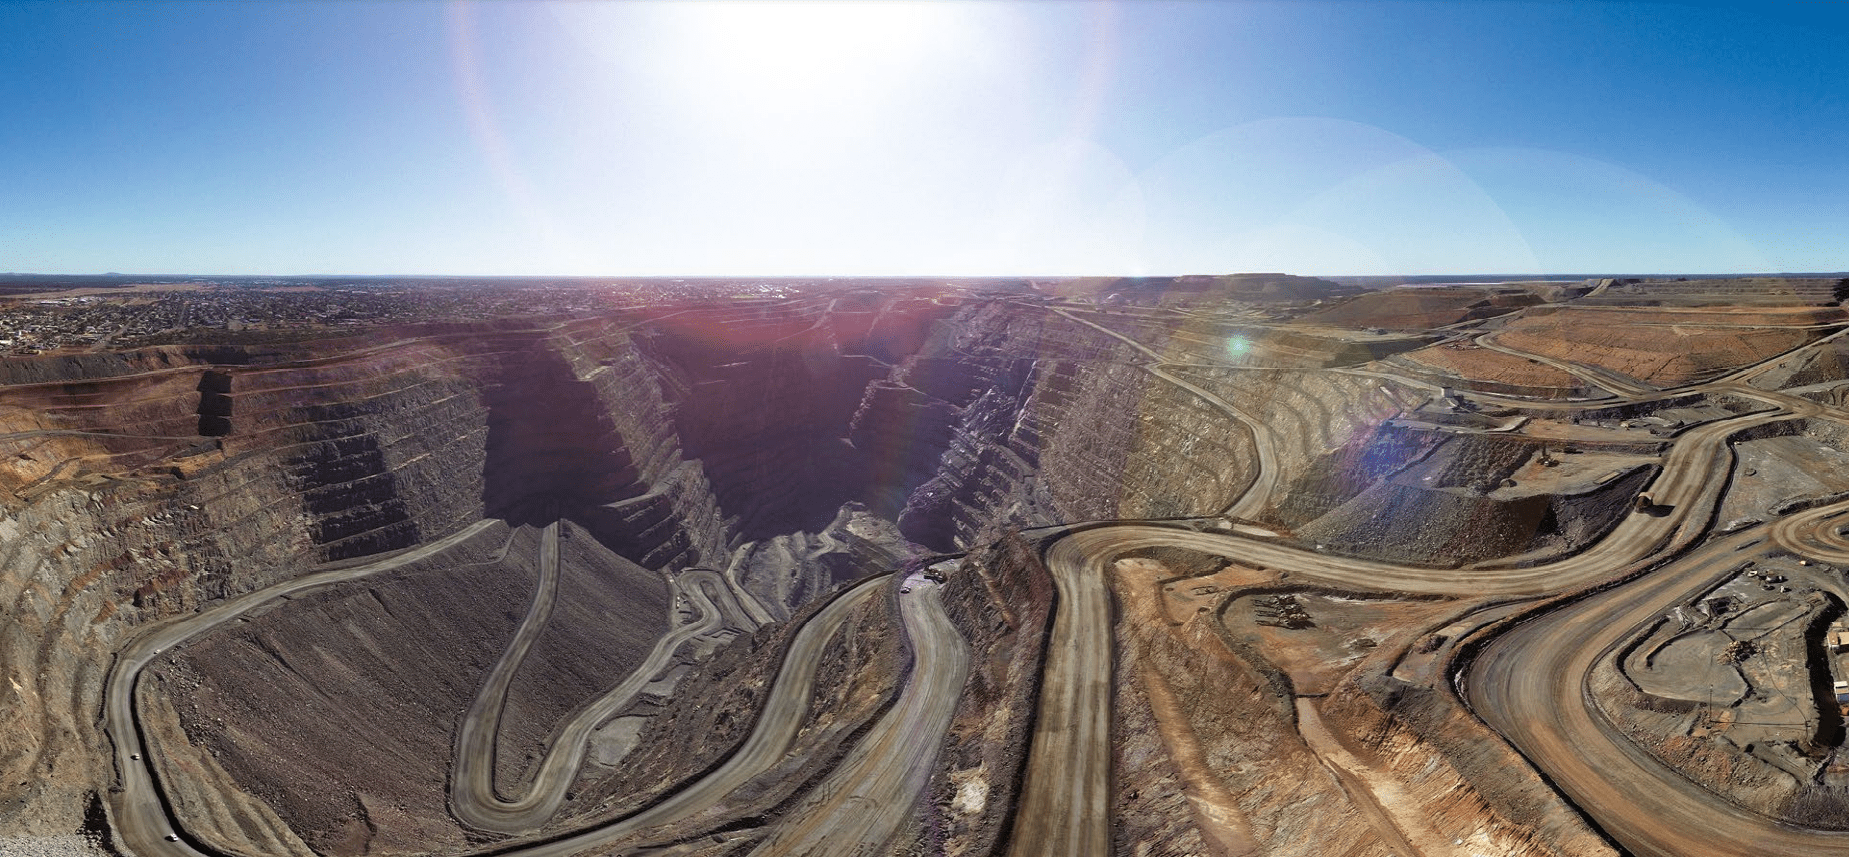
Northern Star put together a solid performance in H1, and with ~780,000 ounces sold in H1, the company remains on track to meet its guidance of ~1.6 million ounces in FY2022. If we look ahead over the next few years, a combination of higher production and declining costs should translate to meaningful growth in earnings. Notably, there looks to be some upside to its ~2.0 million-ounce target. Given this favorable combination of growing production at higher margins and an attractive dividend framework, I would view any pullbacks below US$6.95 as low-risk buying opportunities.
Be the first to comment