

Nordroden
Nordson Corporation (NASDAQ:NDSN) is an underfollowed rock star for dividend growth investors. While Nordson shares don’t typically offer an impressive current yield, their track record is very strong. With the 27% increase announced this week that brings their streak to 59 consecutive years of dividend increases.
Nordson operates in two segments: (1) Industrial Precision Solutions, and (2) Advanced Technology Solutions.
The IPS segment focuses on designing and delivering proprietary dispensing and processing technology specifically related to dispensing of sealants, paint, finishes, coatings, adhesives and more. The IPS solutions enable clients to reduce material costs while increasing efficiencies. The IPS segment primarily serves consumer facing and industrial markets.
NDSN End Markets IPS (NDSN Investor Day 2021)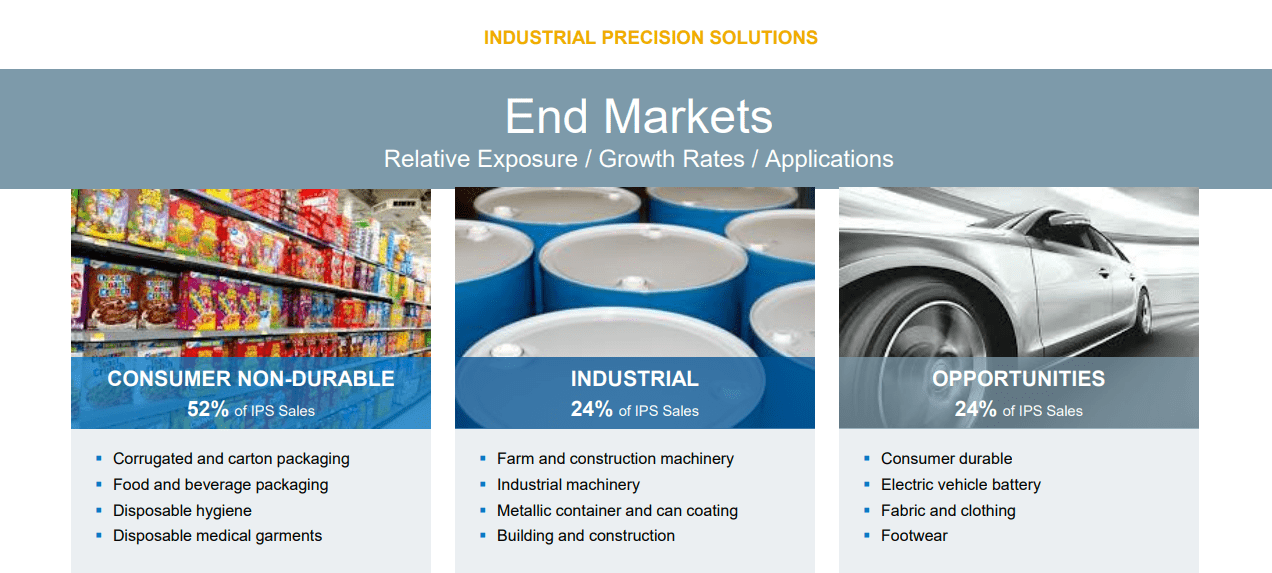
The ATS segment integrates proprietary technologies in various stages of clients’ production process including surface treatment, precise dispensing of material as well as testing, inspection, and quality. The ATS segment serves clients in the electronics, high-tech industrial, and medical markets.
NDSN End Markets ATS (NDSN Investor Day 2021)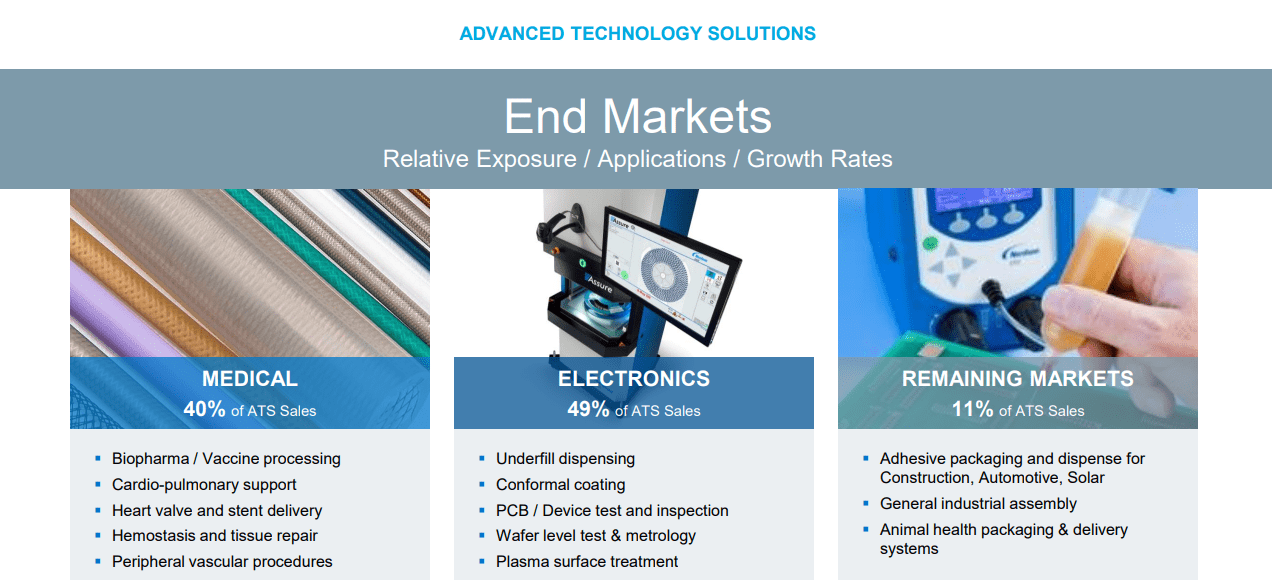
As part of their business Nordson holds over 1,900 global patents that help to protect them from competitors.
Dividend History
The dividend growth investing strategy is the one that most appealed to me when I began investing in individual businesses. It’s a simple strategy that’s based on buying high quality businesses that have a history of paying and growing their dividend payments through both good and bad times.
Nordson Dividend History (Nordson Investor Relations)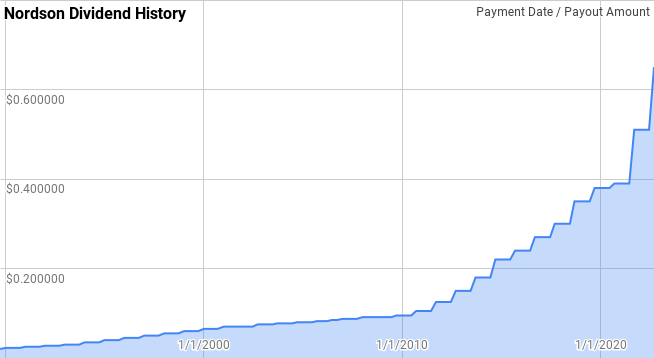
Nordson has an incredibly impressive track record of dividend growth. According to the CCC list, there’s only 13 companies that have a longer active streak of annual increases than Nordson’s 59-year streak. That inspiring streak gives Nordson the title of Dividend King.
Dating back to 1990, Nordson’s year over year dividend growth has ranged from 1.0% to 29.8% with an average of 10.6% and a median of 10.0%.
During that time, there’s been 28 rolling 5-year periods with annualized dividend growth spanning between 3.4% and 18.2% with an average of 10.1% and a median of 11.2%.
Additionally, there’s been 23 rolling 10-year periods since 1990 with Nordson’s annualized dividend growth coming in between 4.1% and 15.3% with an average of 9.5% and a median of 9.7%.
The rolling 1-, 3-, 5-, and 10-year annualized dividend growth rates from Nordson since 1990 can be found in the following table.
| Year | Annual Dividend | 1 Year | 3 Year | 5 Year | 10 Year |
| 1990 | $0.090 | ||||
| 1991 | $0.100 | 11.11% | |||
| 1992 | $0.110 | 10.00% | |||
| 1993 | $0.120 | 9.09% | 10.06% | ||
| 1994 | $0.140 | 16.67% | 11.87% | ||
| 1995 | $0.160 | 14.29% | 13.30% | 12.20% | |
| 1996 | $0.180 | 12.50% | 14.47% | 12.47% | |
| 1997 | $0.200 | 11.11% | 12.62% | 12.70% | |
| 1998 | $0.220 | 10.00% | 11.20% | 12.89% | |
| 1999 | $0.240 | 9.09% | 10.06% | 11.38% | |
| 2000 | $0.260 | 8.33% | 9.14% | 10.20% | 11.19% |
| 2001 | $0.280 | 7.69% | 8.37% | 9.24% | 10.84% |
| 2002 | $0.285 | 1.79% | 5.90% | 7.34% | 9.99% |
| 2003 | $0.303 | 6.14% | 5.18% | 6.58% | 9.69% |
| 2004 | $0.313 | 3.31% | 3.73% | 5.42% | 8.36% |
| 2005 | $0.323 | 3.20% | 4.21% | 4.40% | 7.26% |
| 2006 | $0.335 | 3.88% | 3.46% | 3.65% | 6.41% |
| 2007 | $0.350 | 4.48% | 3.85% | 4.19% | 5.76% |
| 2008 | $0.365 | 4.29% | 4.21% | 3.83% | 5.19% |
| 2009 | $0.369 | 1.03% | 3.25% | 3.37% | 4.39% |
| 2010 | $0.390 | 5.76% | 3.67% | 3.87% | 4.14% |
| 2011 | $0.440 | 12.82% | 6.43% | 5.60% | 4.62% |
| 2012 | $0.525 | 19.32% | 12.50% | 8.45% | 6.30% |
| 2013 | $0.630 | 20.00% | 17.33% | 11.53% | 7.61% |
| 2014 | $0.760 | 20.63% | 19.98% | 15.56% | 9.29% |
| 2015 | $0.900 | 18.42% | 19.68% | 18.20% | 10.81% |
| 2016 | $0.990 | 10.00% | 16.26% | 17.61% | 11.44% |
| 2017 | $1.110 | 12.12% | 13.46% | 16.15% | 12.23% |
| 2018 | $1.250 | 12.61% | 11.57% | 14.69% | 13.10% |
| 2019 | $1.430 | 14.40% | 13.04% | 13.48% | 14.51% |
| 2020 | $1.530 | 6.99% | 11.29% | 11.20% | 14.65% |
| 2021 | $1.680 | 9.80% | 10.36% | 11.16% | 14.34% |
| 2022 | $2.180 | 29.76% | 15.09% | 14.45% | 15.30% |
Source: Author; Data Source: Nordson Corporation Investor Relations
For dividend growth investors, the payout ratio is a critical metric to track. First off, it lets you know how much of earnings or free cash flow is committed to the dividend, or in other words, the ability for the company to continue paying the dividend even if the business stumbles temporarily. Secondly, in conjunction with the dividend growth rate, it lets you know if the underlying business has been growing along with the dividend or if dividend growth has been fueled by a rising payout ratio.
NDSN Dividend Payout Ratios (NDSN SEC filings)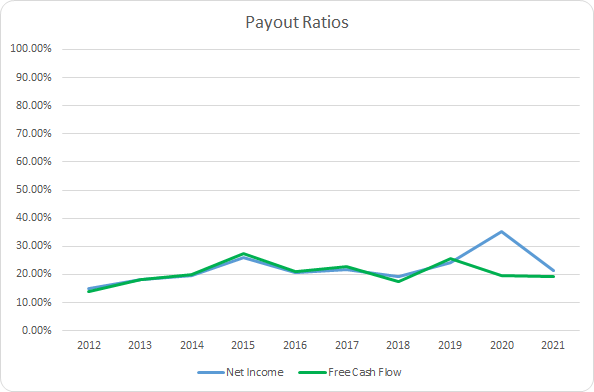
Even in the face of strong dividend growth, Nordson’s payout ratio is still very conservative. The 10-year average net income payout ratio is just 22.2% with the 5-year average at 24.4%. Likewise, the average free cash flow payout ratios are 20.5% and 21.0%, respectively. Nordson’s dividend is well covered by net income and free cash flow and likely has little to no risk of a dividend cut anytime soon.
Quantitative Quality
My aim is to buy companies that I believe are high quality and that have the ability to continue thrive in the future, rewarding me along the way of course with higher dividends. It’s the business quality, and its ability to continue to improve, that ultimately leads to strong returns for investors. As such there’s a variety of financial metrics that I track.
NDSN Revenue Profits and Cash Flow (NDSN SEC filings)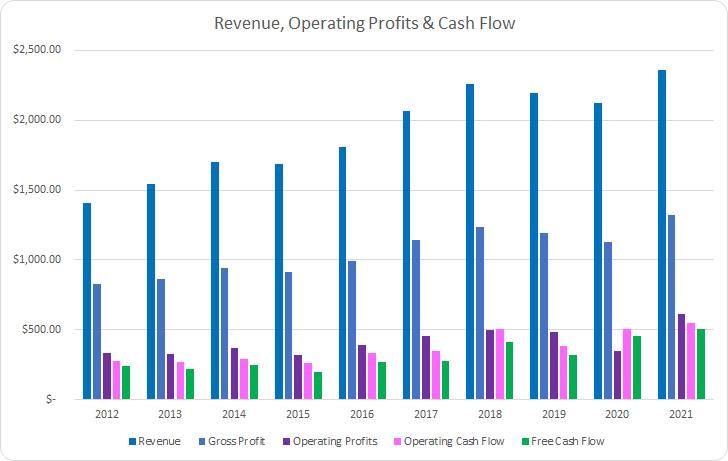
Through a combination of organic as well as acquired growth, Nordson has grown revenues 67.6% in total over the last decade or 5.9% annualized. Meanwhile gross profits improved just 60.1% or 5.4% annually.
Operating profits surpassed revenue growth improving 83.6% in total or 7.0% annually with operating cash flow growing by 98.9% in total or 7.9% annually. Best of all, Nordson’s free cash flow increased by 108.5% over that time or 8.5% annualized.
My expectation is that good businesses will be able to show stable margins over time. However, my preference is to see improving margins as the business becomes more operationally efficient. I want to see free cash flow margins greater than 10%.
NDSN Margins (NDSN SEC filings)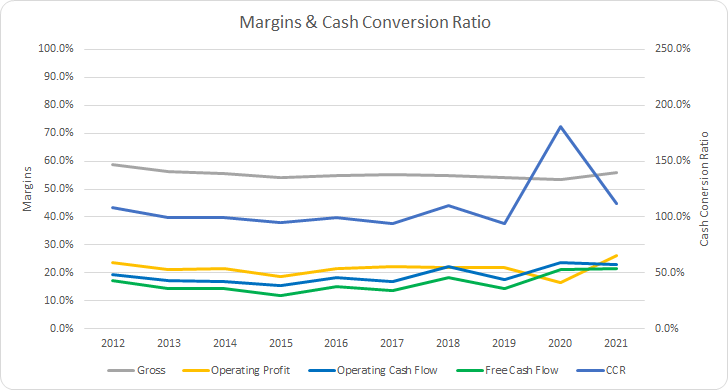
Nordson’s gross margin has retreated slightly during the last decade although it has been relatively stable. The 10-year average gross margin is 55.3% with the 5-year average coming to 54.7%.
Nordson’s free cash flow margin was declining from FY 2012 through FY 2015; however, since then it’s been on a steady increase. The 10-year average free cash flow margin for Nordson is 16.2% with the 5-year average at 17.8%.
Additionally, I track how well the business uses its assets and invested capital to generate free cash flow. The primary metric that I follow is the free cash flow return on invested capital, FCF ROIC; however, I also look at the FCF ROA and FCF ROCE. Similar to margins, I want to see FCF ROICs being relatively consistent over time and prefer to see them greater than 10%.
NDSN Free Cash Flow Returns (NDSN SEC Filings)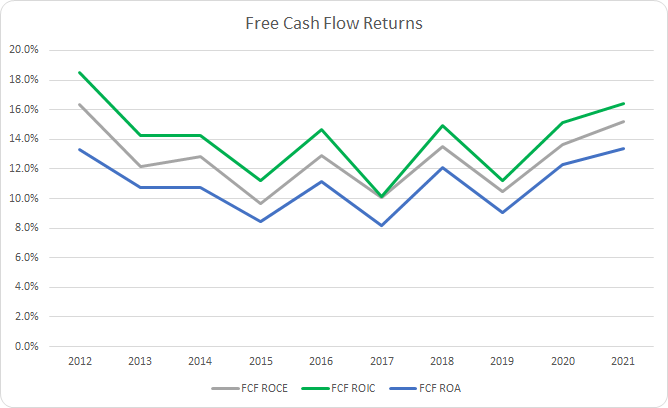
Nordson has easily surpassed the 10% threshold for FCF ROIC besting that level each year over the last decade. The 10-year average FCF ROIC for Nordson comes to 14.1% with the 5-year average at 13.6%.
To understand how Nordson uses its free cash flow, I calculate three variations of the metric, defined below:
- Free Cash Flow, FCF: Operating cash flow less capital expenditures
- Free Cash Flow after Dividend, FCFaD: FCF less total cash dividend payments
- Free Cash Flow after Dividend and Buybacks, FCFaDB: FCFaD less net cash used on share repurchases
NDSN Free Cash Flows (NDSN SEC filings)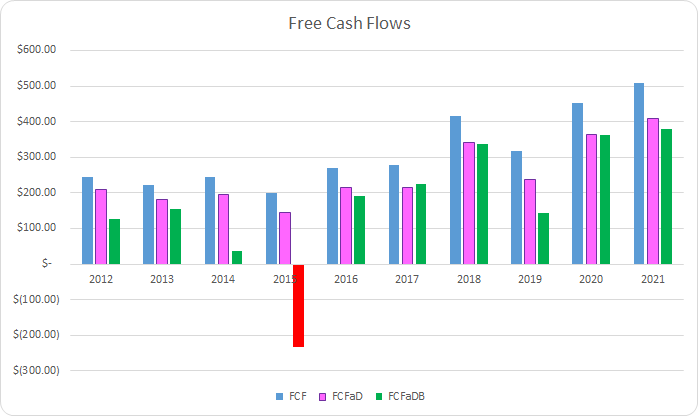
Over the last decade, Nordson generated a total of $3.15 B in FCF which is all the more impressive considering their market capitalization roughly 10 years ago around the $3.0 B mark. Nordson has paid out $638 M in dividends over that time putting the 10-year total FCFaD at $2.51 B.
Nordson has not heavily utilized share repurchases, opting instead to make acquisitions, although they have used a net total of $790 on buybacks over the last decade. That puts the cumulative FCFaDB at a very strong $1.72 B.
Share buybacks are typically utilized as a means to return additional cash to shareholders without the more firm commitment that comes with a higher dividend payment. While I would prefer special dividends to share repurchases, share buybacks can be a boost to remaining shareholders when performed at cheap valuations.
NDSN Shares Outstanding (NDSN SEC filings)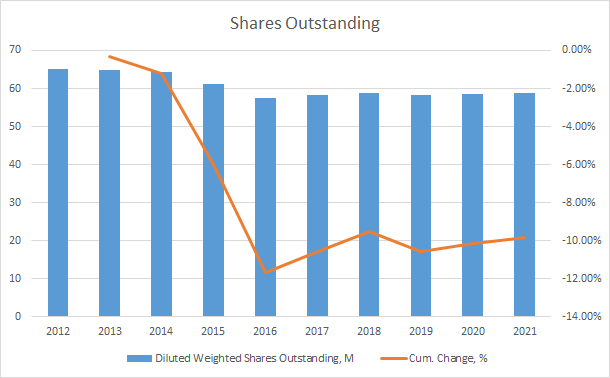
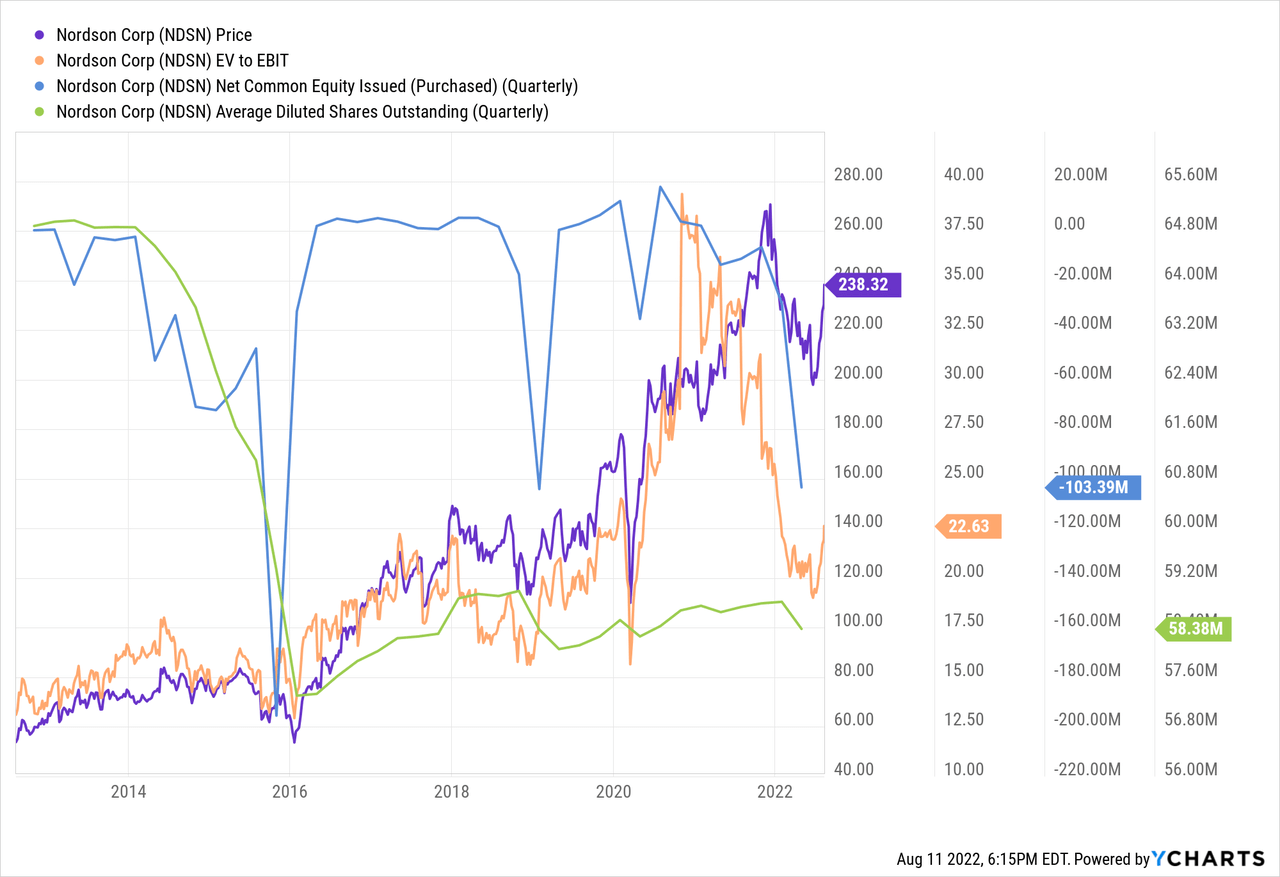
Nordson’s share count has declined by 9.8% in total over the last decade which works out to roughly a 1.1% annualized reduction. However, the bulk of that decline came in FY 2015 and FY 2016 and buybacks have been quite lumpy which is a good thing. As the following YChart shares Nordson has been fairly aggressive with buybacks whenever the share price, in turn valuation, has been under pressure.
When I choose to invest in a business the balance sheet, and in turn leverage, is something I track as my goal is to invest for the long term. While I would prefer little to no debt on the balance sheet, I’m comfortable with prudent amounts of leverage.
NDSN Debt to Capitalization (NDSN SEC Filings)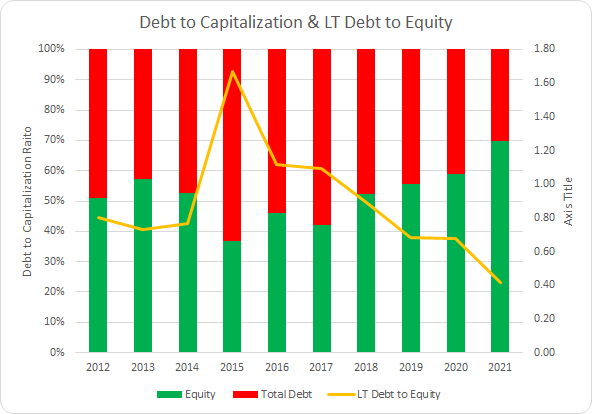
Nordson has routinely maintained a solid capital structure that’s been improving consistently since FY 2015. The 10-year average debt to capitalization ratio is 48% with the 5-year average at 44%.
Additionally, I believe the net debt ratios are a better point of reference for the leverage demands placed on the earnings and cash flows of the business. The net debt ratios let you know how quickly the business could de-lever if needed.
NDSN Debt Ratios and Interest Coverage (NDSN SEC filings)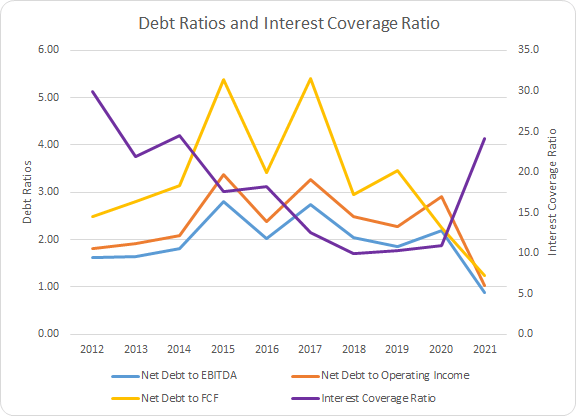
Nordson has maintained moderate leverage compared to the profits and cash flow of the underlying business. The 10-year average net debt-to-EBITDA, net debt-to-operating income, and net debt-to-FCF ratios are 2.0x, 2.4x, and 3.3x, respectively. Accordingly, the 5-year averages are 1.9x, 2.4x, and 3.1x.
Valuation
When valuing a potential investment, I like to use multiple valuation methods to try and center in on a fair price to pay for the business. The valuation methods that I use are dividend yield theory, a reverse discounted cash flow model, and a minimum acceptable rate of return analysis.
Dividend yield theory is a valuation method that attempts to value a business based on the dividends that it pays out. It’s a reversion to the mean-based methodology that assumes that investors will value a business around a normal dividend yield over time. For Nordson I’ll use the 5-year average forward dividend yield as a proxy for the fair value.
Nordson Dividend Yield Theory (NDSN Investor Relations and Google Finance)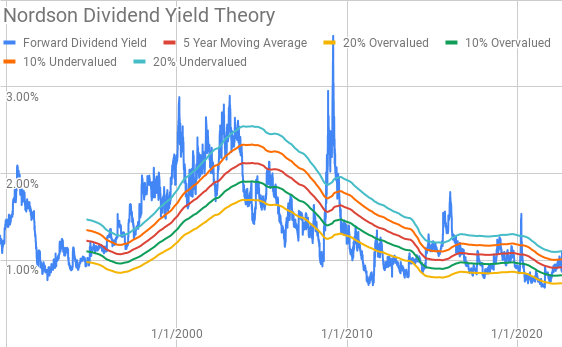
Nordson’s 5-year average forward dividend yield sits at 0.92% while shares currently offer a forward dividend yield of 1.08% thanks to the recent increase to $0.65 per share per quarter.
A reverse discounted cash flow analysis is a valuation method that instead of making explicit assumptions about the future growth, margins, etc. for a business to determine the value, you instead work backwards from the current market valuation to see what the business must generate in cash flows to support that valuation.
I use a simplified DCF model built on revenue growth, an initial free cash flow margin of 19.0% that improves to 22.5% during the forecast period, and a terminal growth rate of 3.0%.
For the discount rate I use an after-tax cost of debt of 2.40% with an estimated cost of equity of both 10% and 8%. Using that the WACC’s for the reverse DCF model becomes 9.5% for the 10% cost of equity and 7.7% for the 8% cost of equity.
Based on those assumptions Nordson needs to grow revenues 11.3% annually through FY 2031 in order to generate the cash flows necessary to support the current market valuation while delivering 10% equity returns. With the 8% cost of equity, 7.7% discount rate, Nordson would need to grow revenues 6.1% annually during the forecast period.
Analysts expect Nordson to report FY 2022 EPS of $9.31 and FY 2023 EPS of $9.89. They also expect Nordson to be able to grow EPS at a 13.0% annual rate over the next 5 years. I then assumed that earnings growth would slow to 5.0% annually for the following 5 years. Dividends are assumed to target a 25% payout ratio.
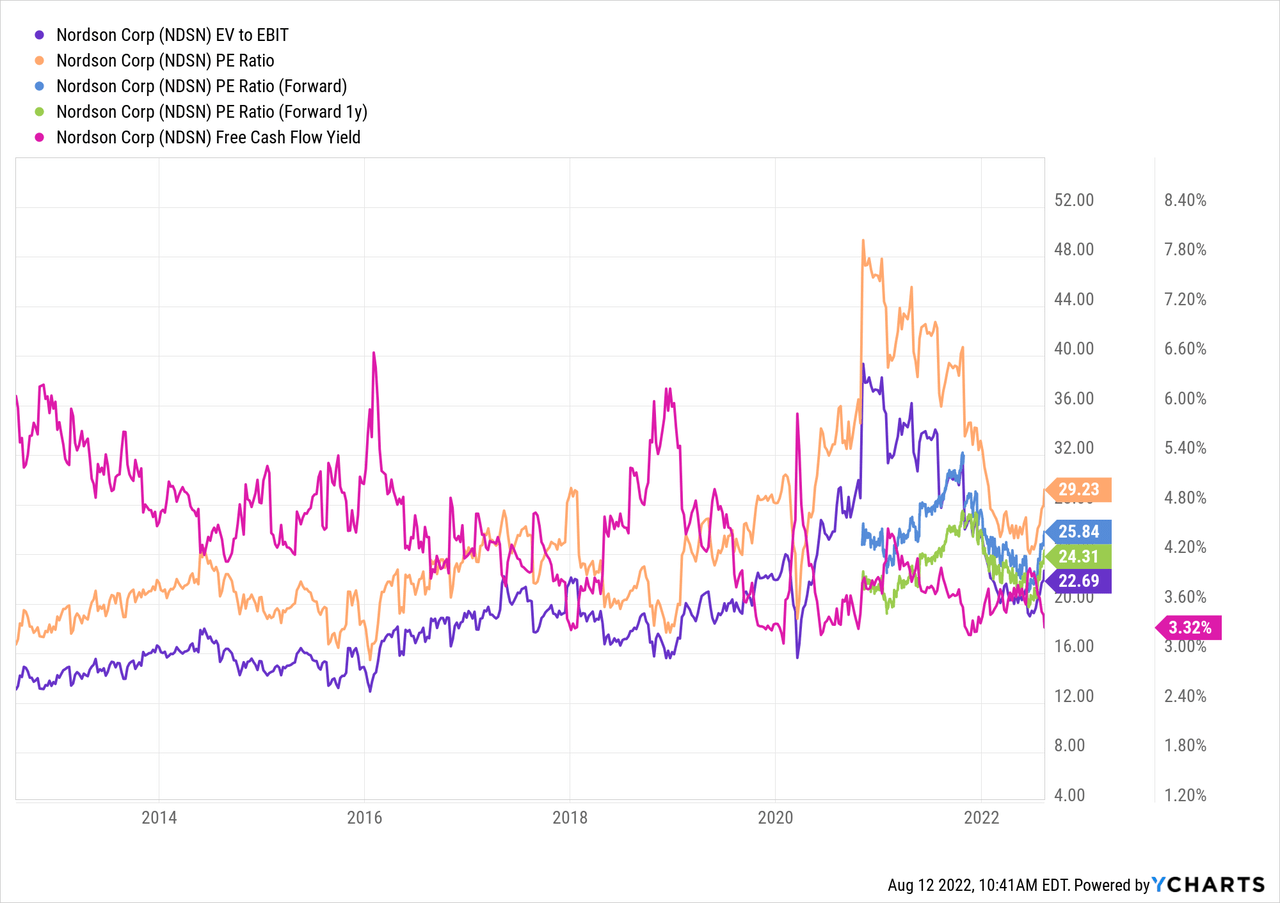
Additionally, we need to determine potential terminal or exit multiples that Nordson might trade at in the future. Over the last decade Nordson has usually been valued between ~15x to ~30x TTM EPS. For the MARR analysis I’ll examine multiples spanning that range.
The following table shows the potential internal rates of return that Nordson could provide if the assumptions laid out above prove to be reasonable forecasts of how the future plays out. Dividends are assumed to be paid and raised along the timeline that Nordson has typically followed. Returns assume that shares are purchased around $241, intraday pricing from Friday.
| IRR | ||
| P/E Level | 5 Year | 10 Year |
| 30 | 16.3% | 10.8% |
| 25 | 11.7% | 8.7% |
| 22.5 | 9.1% | 7.6% |
| 20 | 6.3% | 6.3% |
| 17.5 | 3.2% | 4.9% |
| 15 | -0.3% | 3.3% |
Source: Author
Additionally, I use the MARR analysis setup to work backwards to find the maximum price I could pay for shares today in order to generate the returns that I desire from my investments. My base hurdle rate is a 10% IRR and I’ll also examine 12% and 8% minimum return thresholds.
| Purchase Price Targets | ||||||
| 10% Return Target | 12% Return Target | 8% Return Target | ||||
| P/E Level | 5 Year | 10 Year | 5 Year | 10 Year | 5 Year | 10 Year |
| 30 | $308 | $257 | $285 | $219 | $333 | $303 |
| 25 | $258 | $218 | $239 | $186 | $279 | $256 |
| 22.5 | $233 | $198 | $216 | $169 | $252 | $233 |
| 20 | $209 | $179 | $193 | $153 | $226 | $210 |
| 17.5 | $184 | $159 | $171 | $136 | $199 | $187 |
| 15 | $159 | $139 | $148 | $120 | $172 | $163 |
Source: Author
Conclusion
Nordson has an incredible track record of generating wealth for its owners. On top of the impressive 59-year streak of dividend increases the business has continued to improve and grow.
Nordson’s revenue growth isn’t mind-blowing at just 5.9% annualized over the last decade; however, they consistently grow both organically and through acquisitions. Nordson also maintains strong free cash flow margins in the upper-teens with free cash flow returns on invested capital in the mid-teens.
Nordson employs a more flexible approach to share repurchases preferring to pursue acquisitions to continue to push the business forward rather than committing a large amount of cash flow to buybacks. Management gets aggressive with buybacks when they feel the share price has been unjustly punished due to the whims of the market. That’s great news for shareholders and lends credence to a skilled capital allocation policy.
Dividend yield theory suggests a fair value range for Nordson between $257 and $313 implying that shares are trading below fair value and potentially undervalued.
The reverse DCF analysis suggests that 10% returns are likely going to be hard to come by for investors as it requires pretty aggressive growth and margin expansion assumptions. Although 8% returns do appear achievable requiring more modest growth expectations. Share repurchases were not taken into account which would help boost the per share returns for equity investors.
Meanwhile the MARR analysis appears to show that Nordson is fairly expensive with current prices near $241 and that 10% returns would require shares to continue trading near the high end of its historic multiples. My fair value range based on a 10% IRR target 5-years out with a fair multiple between 20x and 25x comes to $209 to $258.
Nordson is a business, and stock, that I’ll continue to keep my eye on; however, at this time I would refrain from adding shares to my portfolio. Shares were quite attractive back in June before the ensuing rebound in the markets. Should the share price retrace back to the $220s or lower Nordson would become quite attractive.
Be the first to comment