

NFP Talking Points:
This morning brought the release of Non-Farm Payrolls data for the month of December, and this release perhaps carried a bit of extra importance after the December FOMC rate decision. At that meeting, Chair Powell shared that the FOMC was opening the door to tighter policy options in 2022, largely in response to the persistent inflation that continues to run through the U.S. economy. The one sticking point was the same item that the bank has been tracking since early 2021 and that’s the continued recovery in the labor market.
During the press conference of the December rate decision Powell said that the bank was waiting for confirmation of full employment in the U.S. economy before making any adjustments to rates. This week saw the release of meeting minutes from that rate decision and the large takeaway was a Fed that’s now more open to both a faster tapering of asset purchases and faster rate hikes. Markets have responded by pricing in a median of 3-4 hikes this year out of the Fed, even after the bank highlighted a possible 2-3 hikes at the December meeting.
This morning’s Non-Farm Payrolls came out at +199k with an unemployment rate of 3.9%.
Updated 8:47 AM ET
This report seems to have something for either side of the hawkish/dovish argument. While the headline number disappointed again similar to last month, with a wide miss from the expected number – the unemployment rate continued to sink and this month we see that go below 3.9%.
The immediate market reaction seems to be taking this in a slightly hawkish manner, with USD-strength showing up along with a quick pullback in stocks.
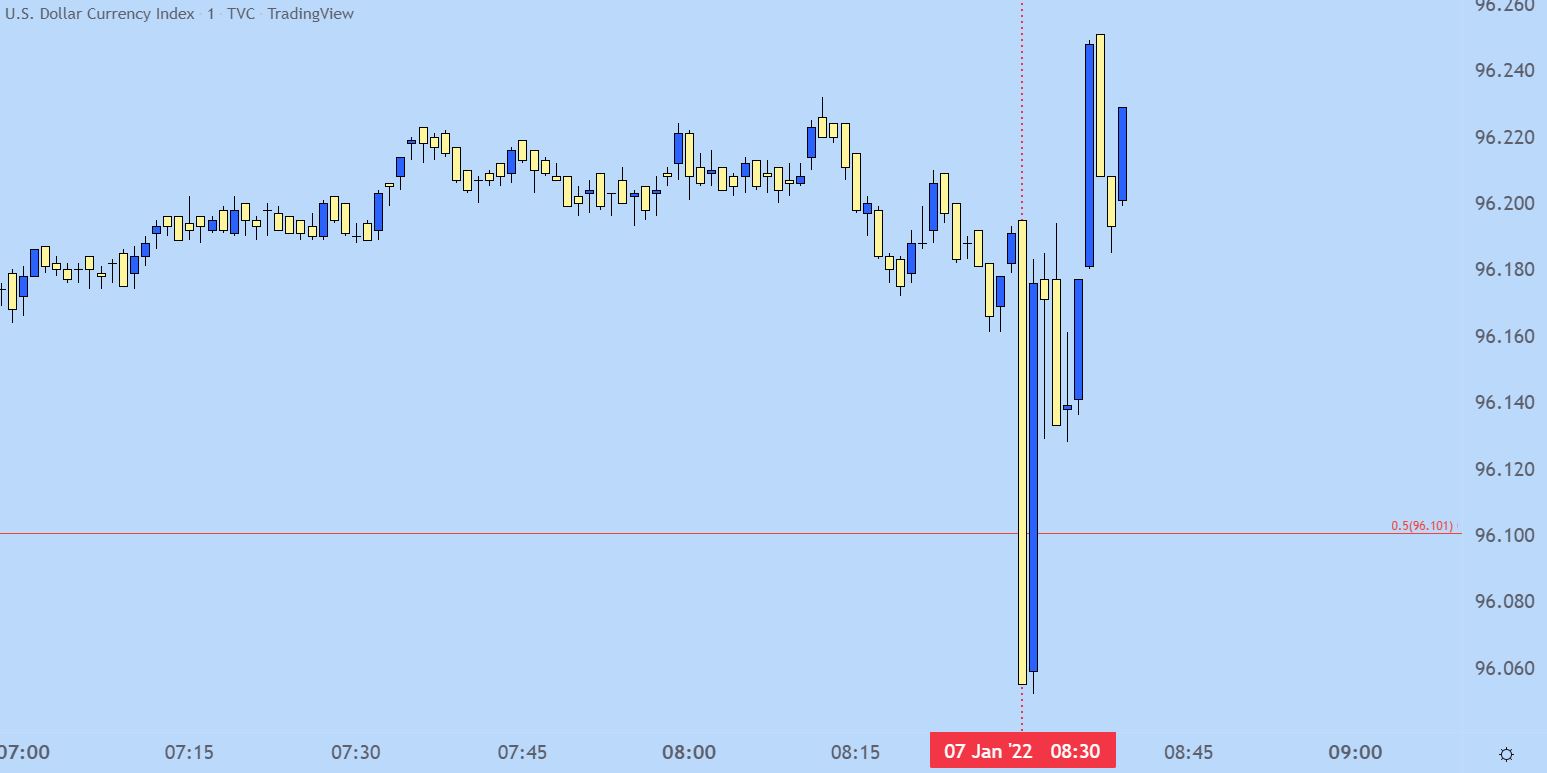
US Dollar One-Minute Price Chart
Chart prepared by James Stanley; USD, DXY on Tradingview
The big question on USD is whether this might be enough to help break the range that’s built-in over the past seven weeks. Given the miss on the headline number, this morning’s report may not be enough even with the unemployment rate sinking below 4%.
But – next week brings CPI data on Wednesday and this could certainly provide that motive for US Dollar bulls should inflation once again continue to push-higher.
US Dollar Daily Price Chart: Range Remains
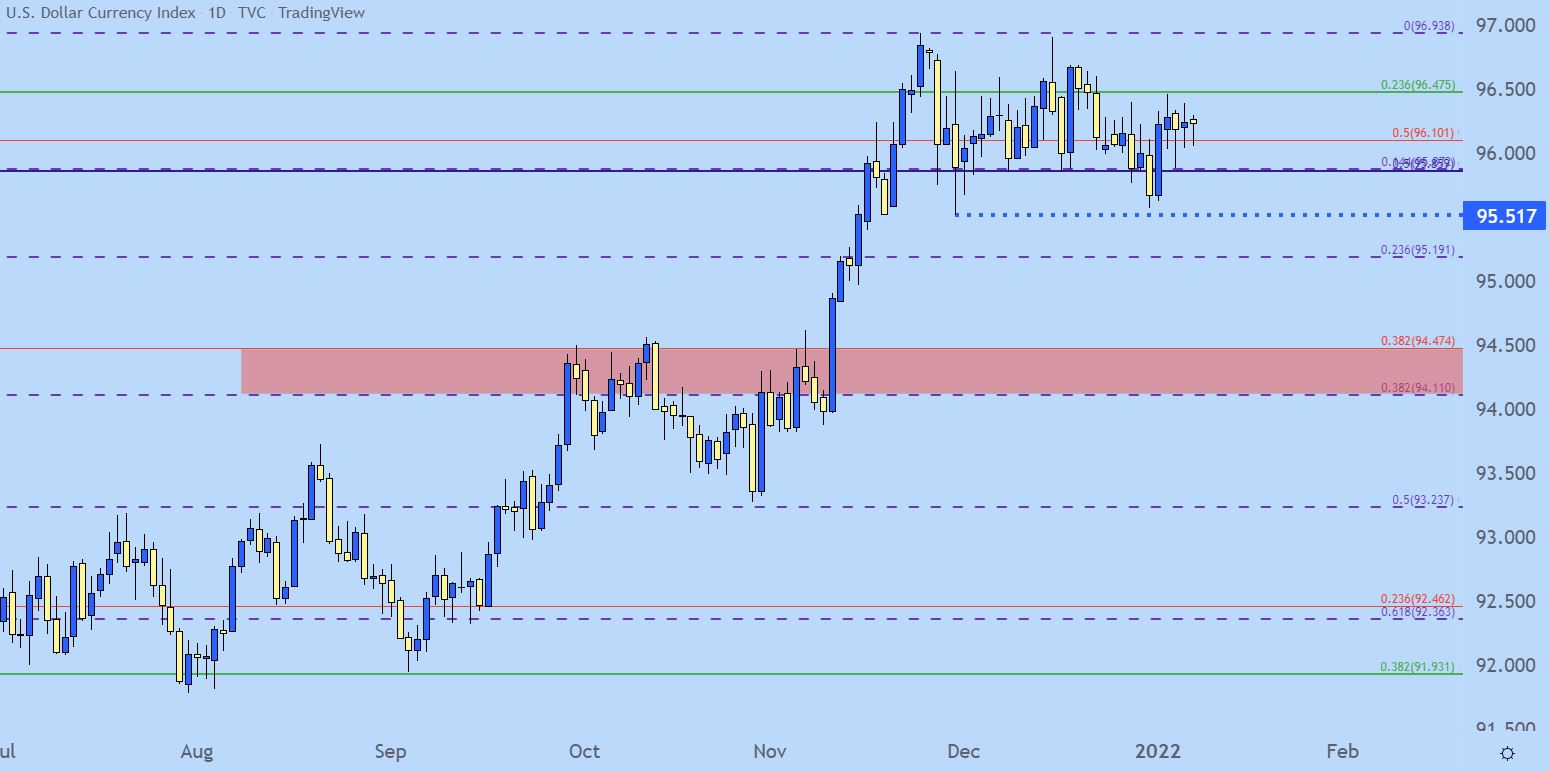
Chart prepared by James Stanley; USD, DXY on Tradingview
Stocks Getting Hit
Equities have been on their back foot all week and this morning’s report doesn’t seem to be helping matters. The S&P 500 has been in a bee-line lower since the release of NFP data, putting in a move of 40 handles peak-to-trough. The 4700 level of resistance was looked at earlier this week, although at the time it was serving as support with bulls not showing much deterrence to the continued rise in U.S. yields.
Well, no more than a week later and bulls are now showing a deterrence to U.S. yields, and this morning’s NFP report doesn’t seem to be helping matters. The 10-year note set a fresh seven-month-high this week and that coupled with the release of December FOMC minutes have helped bears to make a push-lower on charts.
S&P 500 One-Minute Chart

Chart prepared by James Stanley; S&P 500 on Tradingview
Update 9:07 AM ET
10 Year Treasury Yield To Fresh Yearly High
In the aftermath of this morning’s report, treasury yields have moved higher with the 10 year note now yielding at a fresh yearly high. Previous resistance at 1.765% was last traded at in late March of 2021, when markets were gearing up for a more-hawkish Federal Reserve later in the year.
When that didn’t happen, yields pulled back and that remained the case until August, at which point yields began to climb again with another jump in September and December around FOMC rate decisions.
10 Year Treasury Note Yield
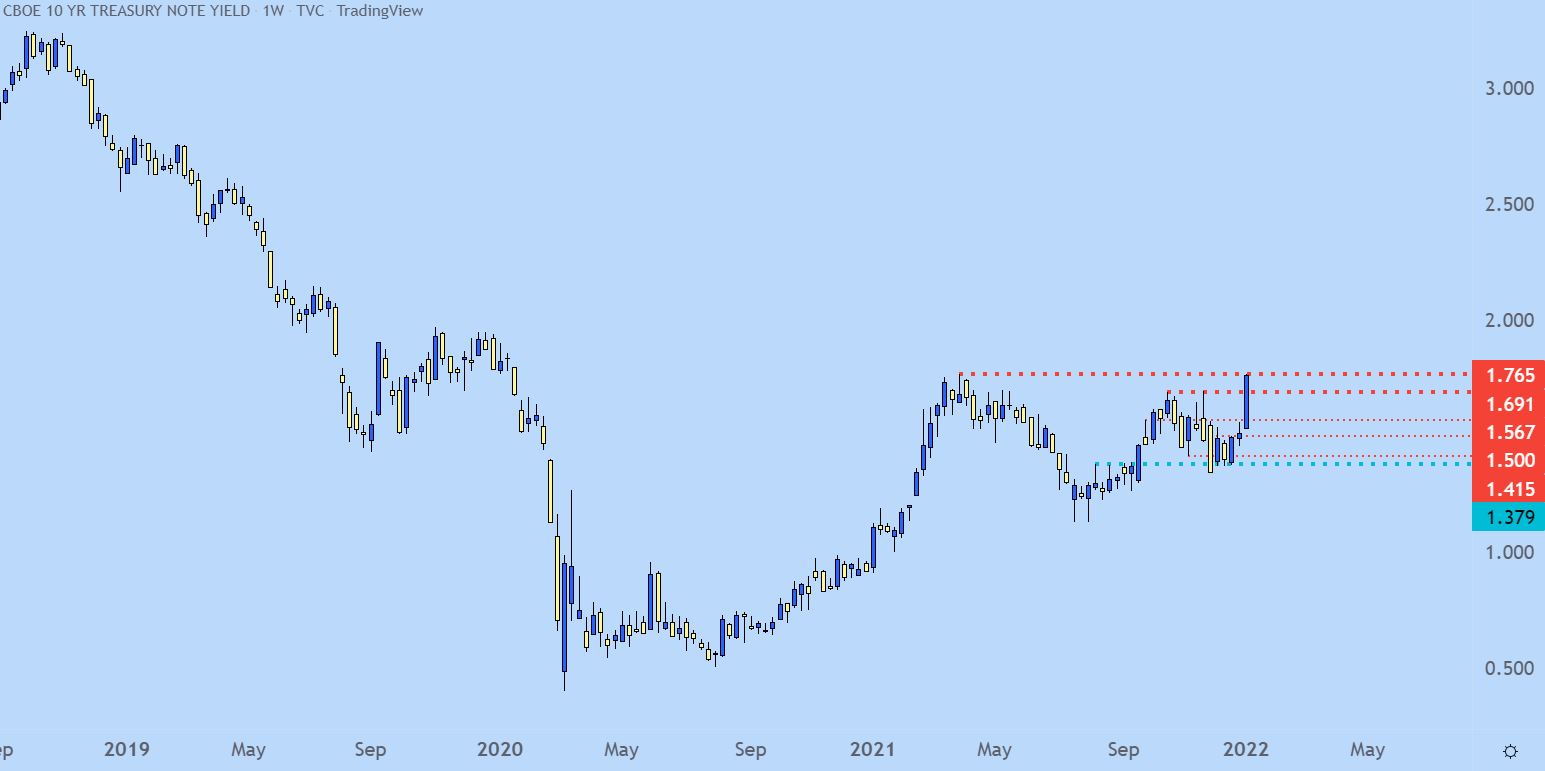
Chart prepared by James Stanley; TNX on Tradingview
— Written by James Stanley, Senior Strategist for DailyFX.com
Contact and follow James on Twitter: @JStanleyFX
Be the first to comment