

nathanaparise/iStock via Getty Images
Investment Thesis
A reader recently suggested I look into the Russell U.S. Dividend Growers ETF (BATS:TMDV), an ETF tracking a rare breed of U.S. securities that have increased dividends for 35 consecutive years or more. Naturally, the S&P 500 Dividend Aristocrats ETF (BATS:NOBL) came to mind, given its popularity for raising dividends for 25 straight years or more, so I figured a comparison article was in order. This article has two goals. First, to assess whether TMDV’s larger stock universe improved the quality of the fund. Second, to determine if TDMV’s additional ten years of dividend consistency provide added safety. To answer these questions, I’ll start with each fund’s strategy and exposures, then look at their historical track records and examine their fundamentals from volatility, risk, growth, valuation, and quality perspective.
ETF Overview
NOBL Strategy and Exposures
ProShares lists three reasons to invest in NOBL:
- It’s the only ETF focusing exclusively on S&P 500 stocks that have raised dividends for 25 consecutive years or more.
- Companies are often household names with solid fundamentals on earnings and growth.
- It has a demonstrated history of weathering market downturns by capturing most of the gains in rising markets and fewer of the losses in falling markets.
The third point is up for debate, and I’ll discuss that more in the performance analysis section. However, let’s first review NOBL’s sector exposures.
ProShares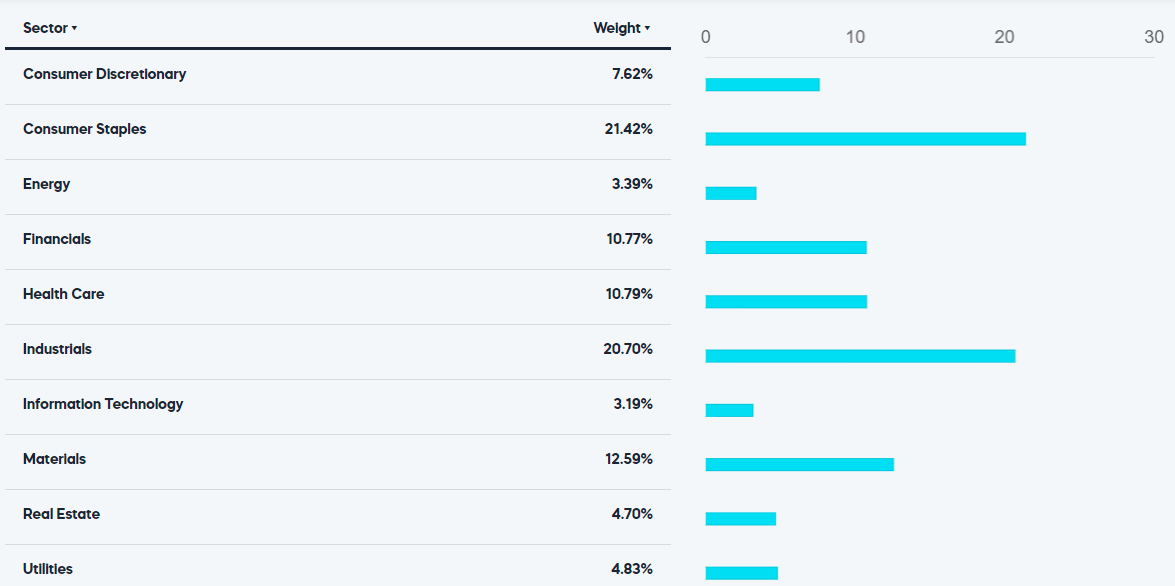
Consumer Staples (21.42%) and Industrials (20.70%) are the two leading sectors, followed by Materials (12.59%), Health Care (10.79%), and Financials (10.77%). It has very little exposure to Energy and Technology stocks, which have probably canceled each other out lately since they are the best and worst-performing sectors YTD. Otherwise, it’s reasonably well-diversified.
NOBL is an equal-weighted fund, so the top holdings won’t reveal much other than what’s performed best since the last quarterly rebalancing. However, here are the top 20, and the household names’ claim rings true. Chevron (CVX) and Exxon Mobil (XOM) cover the Energy sector, Genuine Parts (GPC) is the leading Consumer Discretionary holding, and Archer-Daniels-Midland (ADM) is one of 14 Consumer Staples securities in the portfolio.
ProShares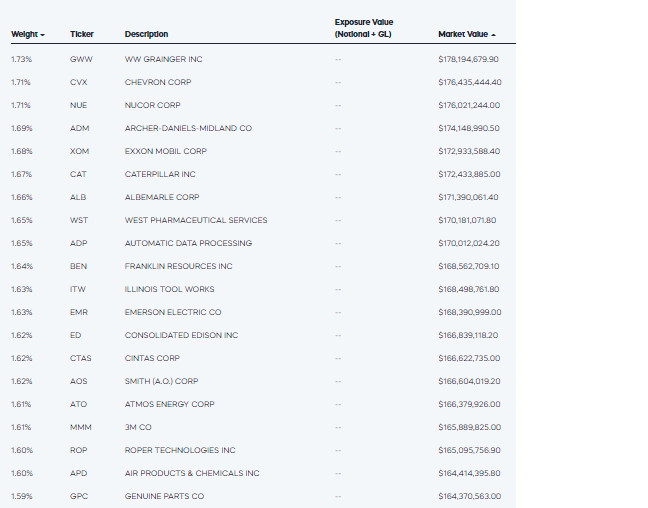
TMDV Strategy and Exposures
TMDV is also an equal-weight ETF, but it requires constituents to have 35 years of consecutive dividend increases, and its stock universe isn’t restricted to the large caps in the S&P 500 Index. ProShares lists two reasons to invest in TMDV:
- It’s the only ETF focusing exclusively on the Russell 3000 Dividend Elite Index, comprised of 64 companies meeting the 35-year dividend increase requirement.
- TMDV’s holdings are quality names that, as a group, have solid fundamentals and strong histories of growth.
Notice the difference in language compared with NOBL. The second point suggests that TMDV’s constituents may not have solid fundamentals on their own and only work best if purchased together as part of a diversified portfolio. It may be just semantics, but it hints at a lower-quality portfolio that I will explore later.
TMDV is also overweight Consumer Staples (25.06%) and Industrials (17.00%) but has significantly more Utilities exposure than NOBL. There are eight holdings with market capitalizations ranging from $1.7 billion to $34.9 billion, but Consolidated Edison (ED) is the only overlap. The average ten-year total return for these stocks is 254% compared to 175% for the Utilities Select Sector SPDR ETF (XLU), so from this perspective, expanding into the small-caps in this sector proved beneficial.
ProShares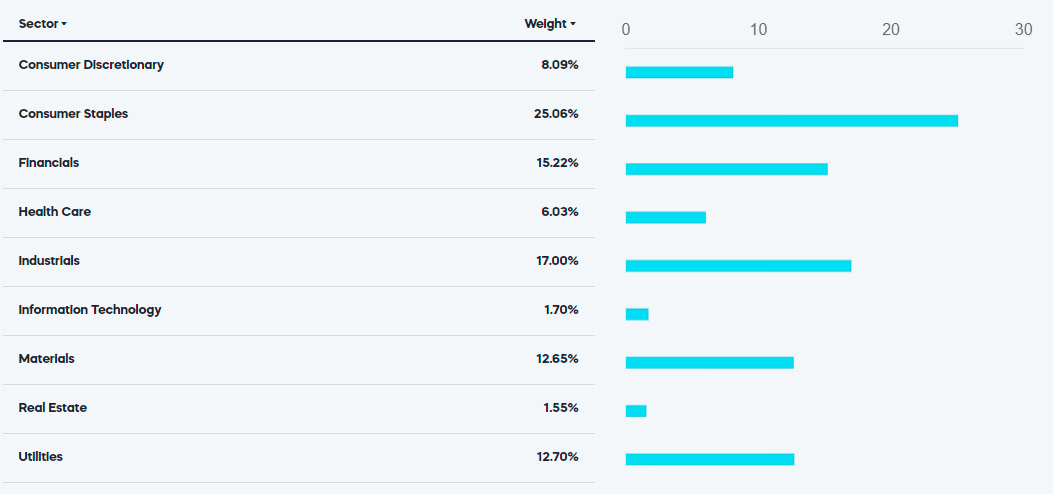
TMDV’s top 20 holdings are listed below and include many of these small-cap Utilities stocks like Middlesex Water (MSEX), California Water Service Group (CWT), and American States Water Company (AWR). Large-cap companies include Automatic Data Processing (ADP), S&P Global (SPGI), McDonald’s (MCD), Target (TGT), and Walmart (WMT).
ProShares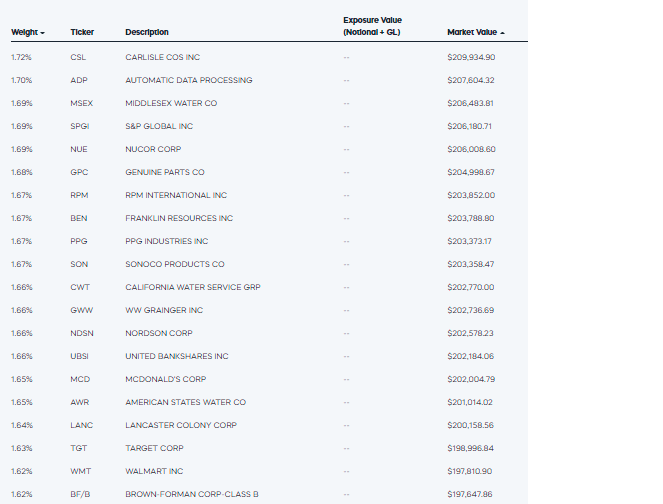
As for fund overlap, 25 securities in NOBL aren’t in TMDV, representing a 39.53% weight. There are also 25 securities in TMDV that aren’t in NOBL that total 39.32% in weight, so the average fund overlap is 60.57%. I’ve calculated these figures using the latest holdings data, but the Fund Overlap Tool at the ETF Research Center provides a pretty good estimate using prior month-end holdings.
ETF Research Center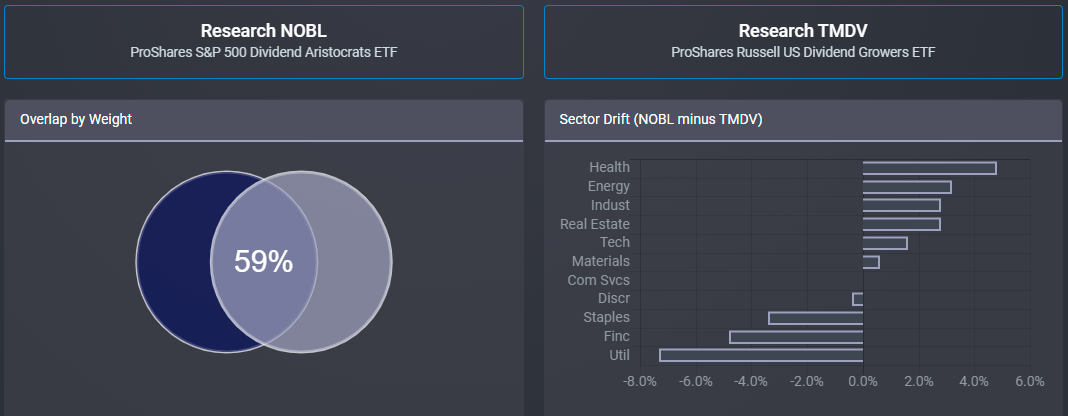
Performance Analysis
The following performance comparison is limited due to TMDV’s short track record. Still, through July 2022, NOBL has outperformed TMDV by an annualized 1.61% (9.85% vs. 8.24%) with slightly higher annualized volatility (18.98% vs. 17.91%). Both ETFs were less volatile than the SPDR S&P 500 ETF (SPY) but significantly underperformed with lower risk-adjusted returns (Sharpe and Sortino Ratios).
Portfolio Visualizer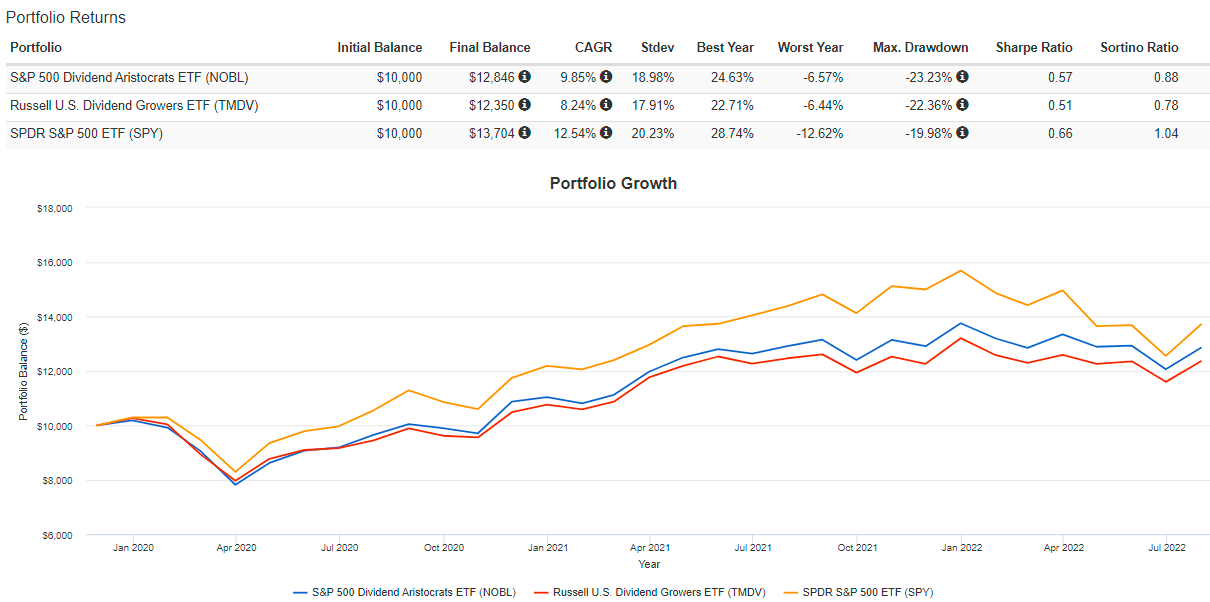
NOBL and TMDV seem to move in line with each other, primarily due to the 60% overlap mentioned previously. Excluding TMDV from the analysis, we can judge ProShares’ claim that NOBL captures most of the upside in bull markets and less of the downside in bear markets.
Portfolio Visualizer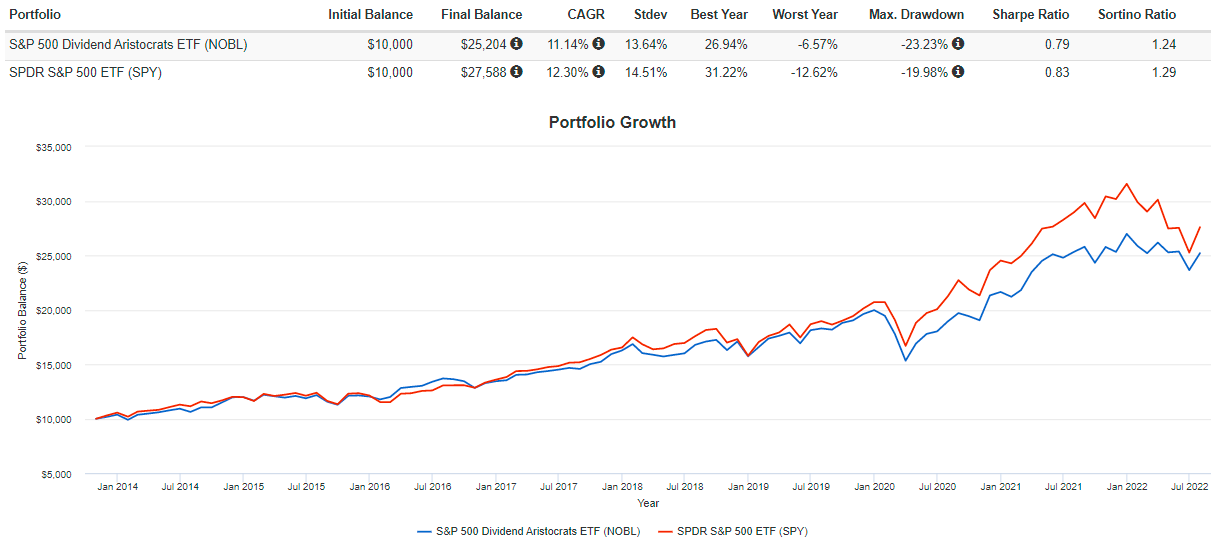
As is the case for most value and dividend-oriented ETFs, NOBL began to lag the broader market when the pandemic started because it lacked much exposure to Technology stocks. In Q1 2020, NOBL fell 23.23% compared to 19.98% for SPY, so this is one example where ProShares’ claim didn’t pan out. The following graph helps us understand historical drawdowns even more.
Portfolio Visualizer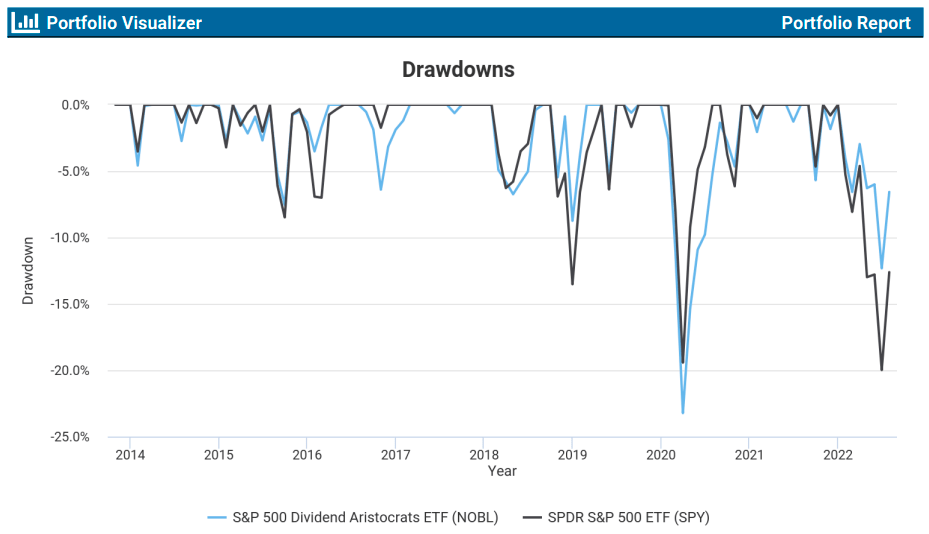
- In January 2016, NOBL ended down 3.51% compared to 6.92% for SPY.
- In October 2016, NOBL ended down 6.39% compared to 1.73% for SPY.
- In December 2018, NOBL ended down 8.74% compared to 13.52% for SPY.
- In June 2022, NOBL ended down 12.33% compared to 19.98% for SPY.
Along with the Q1 2020 drawdown, that’s three wins and two losses for NOBL. I think it’s more accurate to claim NOBL is better equipped to handle market downturns because of its low exposure to Technology stocks. Since there’s a nearly 25% exposure gap, you’re betting on that sector’s failure to drive outperformance.
Fundamental Analysis
NOBL vs. TMDV
The following table highlights selected fundamental metrics for NOBL’s top 20 industries and compares them with TMDV. I want to point out that although both are equal-weighted ETFs with the same number of holdings, NOBL is better diversified, as indicated by its lower percentage of assets in these top 20 industries. Household Products stocks like Colgate-Palmolive (CL) help drive down the portfolio’s volatility, but there’s not much growth potential in exchange, and the valuation is pretty high at 26.99x forward earnings.
The Sunday Investor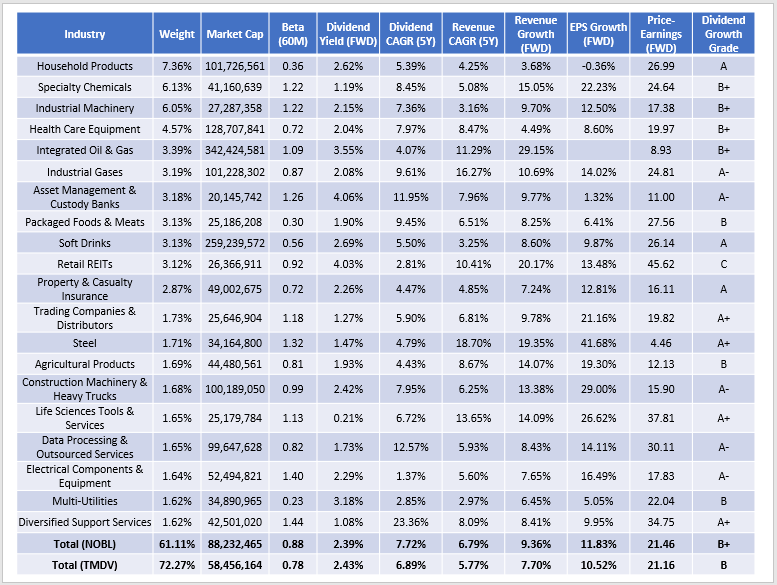
Overall, NOBL’s five-year beta climbs to 0.88 due to the addition of more volatile Energy and Materials stocks. The average for the 65 dividend ETFs in my database is 0.92, so that’s not a unique factor. Its constituents yield 2.39%, and after deducting the 0.35% expense ratio, a net dividend yield of 2.04% is about on par with the ETF’s current 1.97% yield. Furthermore, NOBL’s holdings have raised dividends at an annualized 6.79% rate over the last five years, below the 10.07% growth rate the ETF experienced over the same period. For this reason, I think future dividend growth will fall back to single digits, as the quarterly rebalancings won’t provide any yield boost since it’s an equal-weight portfolio.
In general, growth is an issue for nearly all Dividend Aristocrats. NOBL’s constituents have a one-year forward revenue and earnings growth rate of 9.36% and 11.83%. It sounds pretty good, but it’s quite average. Out of 65 dividend ETFs, these rank 32nd and 39th, respectively. Add in the 21.46x forward earnings valuation, which ranks dead last in affordability, and it appears investors are paying a hefty premium for the Dividend Aristocrat status. NOBL’s Dividend Growth Grade of “B+” is only 21nd best, and its Profitability Grade is only 31st best, so I’m not yet sold on this ETF given the many alternatives.
TMDV vs. NOBL
TMDV is a more concentrated ETF, ultimately touching 38 industries compared to 45 for NOBL. Before we look at TMDV’s top 20 industries, I want to point out the biggest industry differences in case there’s a specific one you’re looking to target. Here are the top five most overweight industries for TMDV relative to NOBL:
- Water Utilities: 6.59% vs. 0.00% = 6.59%
- Regional Banks: 3.24% vs. 0.00% = 3.24%
- Packaged Foods & Meats: 6.35% vs. 3.13% = 3.22%
- Property & Casualty Insurance: 5.54% vs. 2.87% = 2.67%
- Specialty Chemicals: 7.79% vs. 6.13% = 1.66%
And here are the top five most underweight industries for TMDV:
- Integrated Oil & Gas: 0.00% vs. 3.39% = -3.39%
- Industrial Gases: 1.50% vs. 3.19% = -1.70%
- Construction Machinery & Heavy Trucks: 0.00% vs. 1.68% = -1.68%
- Life Sciences Tools & Services: 0.00% vs. 1.65% = -1.65%
- Diversified Support Services: 0.00% vs. 1.62% = -1.62%
As shown, TMDV has a much higher allocation to Water Utilities and less exposure to Energy stocks, which helps explain its lower 0.78 beta and makes it one of the more defensive dividend ETFs on the market (8th least-volatile). Let’s look closer at some of its other fundamentals.
The Sunday Investor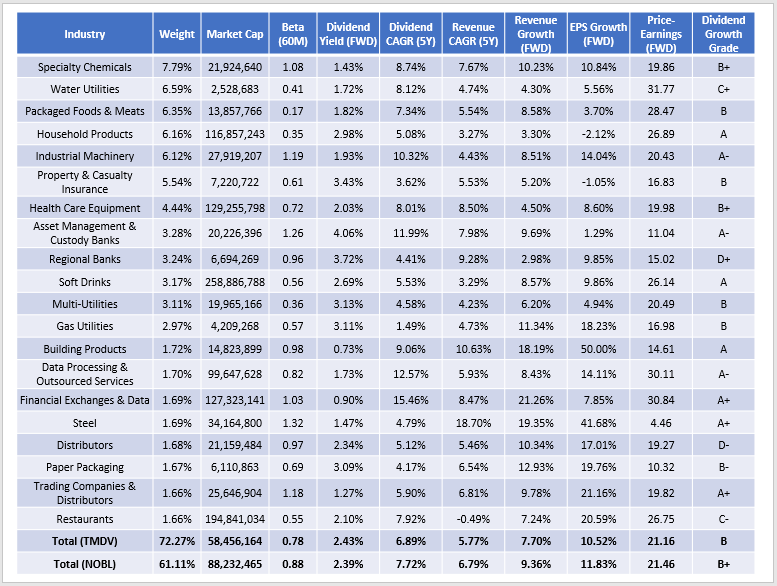
We can see three of the five most-overweighted industries at the top of this list: Specialty Chemicals, Water Utilities, and Packaged Foods & Meats. The betas of the last two are incredibly low and a key differentiator. One of the holdings, Tootsie Roll Industries (TR), has a negative 0.03 five-year beta, but while that’s helped control risk, it hasn’t done much on the returns side. The stock has been a drag recently, gaining only 6.16% since TMDV’s launch.
Seeking Alpha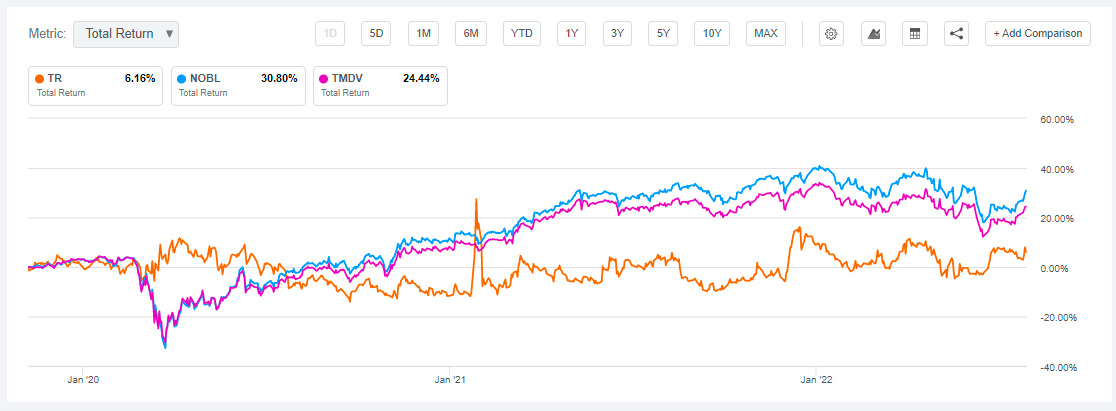
I’ve pointed out how NOBL’s growth metrics aren’t great, but TMDV’s are even worse. TMDV ranks 50th and 49th out of 65 ETFs on revenue and earnings per share growth. Its 21.16x forward earnings valuation is third-worst, just ahead of NOBL and the Vanguard Dividend Appreciation ETF (VIG). Like NOBL, I expected TMDV to yield around 2%, but I think there’s less potential for dividend growth. Historically, its constituents are about a percentage point behind (6.89% vs. 7.72%), supported by a weaker Dividend Growth Grade from Seeking Alpha (B vs. B+).
Investment Recommendation
Initially, I figured TMDV would be useful for its low-volatility feature. Still, since its 2% yield is unlikely to be a draw for dividend investors, you could buy a dedicated low-volatility ETF with a much lower expense ratio to achieve that goal (category review here). After reviewing its fundamentals, it appears the 35 years of dividend growth requirement has reduced the fund’s quality, which goes against what we think “Dividend Elites” should be. However, the expansion into small-cap Utilities has been beneficial, so that’s probably an area dividend investors should explore more.
NOBL has slightly better fundamentals but is also more volatile and will likely offer less protection in bear markets. In contrast, it should capture more upside in a bull market, and its constituents look to be in better shape financially. Still, the lack of Technology exposure is an issue that isn’t going away anytime soon, which is the primary problem with the strict dividend consistency requirement. You can fill that gap with the more lenient S&P Technology Dividend Aristocrats ETF (TDV), but on their own, neither NOBL nor TMDV impresses me. I’m rating both as a hold, and I look forward to discussing more in the comments below.
Be the first to comment