

Thank you for your assistant
Footwear and apparel legend Nike (NYSE:NKE) is set to report earnings on Tuesday after the bell. The stock has been on a tear since the last time the company reported earnings, but some signs of a breakdown have occurred in the past couple of weeks.
The last time I covered Nike, I said the stock was a sell and it almost immediately flew higher into a sustained rally. I’ll own that; I didn’t like the setup but the setup was invalidated by overwhelmingly bullish action. I use technical analysis heavily when finding stocks to buy or sell, and technical analysis is very much about probabilities, not certainties. That’s also why I tell subscribers over and over and over again to use stops, because sometimes things happen outside of what the setup says.
Below, we’ll take a look at the current setup for Nike heading into is earnings report, along with some key metrics to pay attention to when the company does release its earnings.
Signs of a short-term top
We’ll begin with the chart, and as the header says, I see signs that buyers are already exhausted before the report comes out. That means the odds of a move lower are much higher than the odds of a move up. Permit me to explain.
StockCharts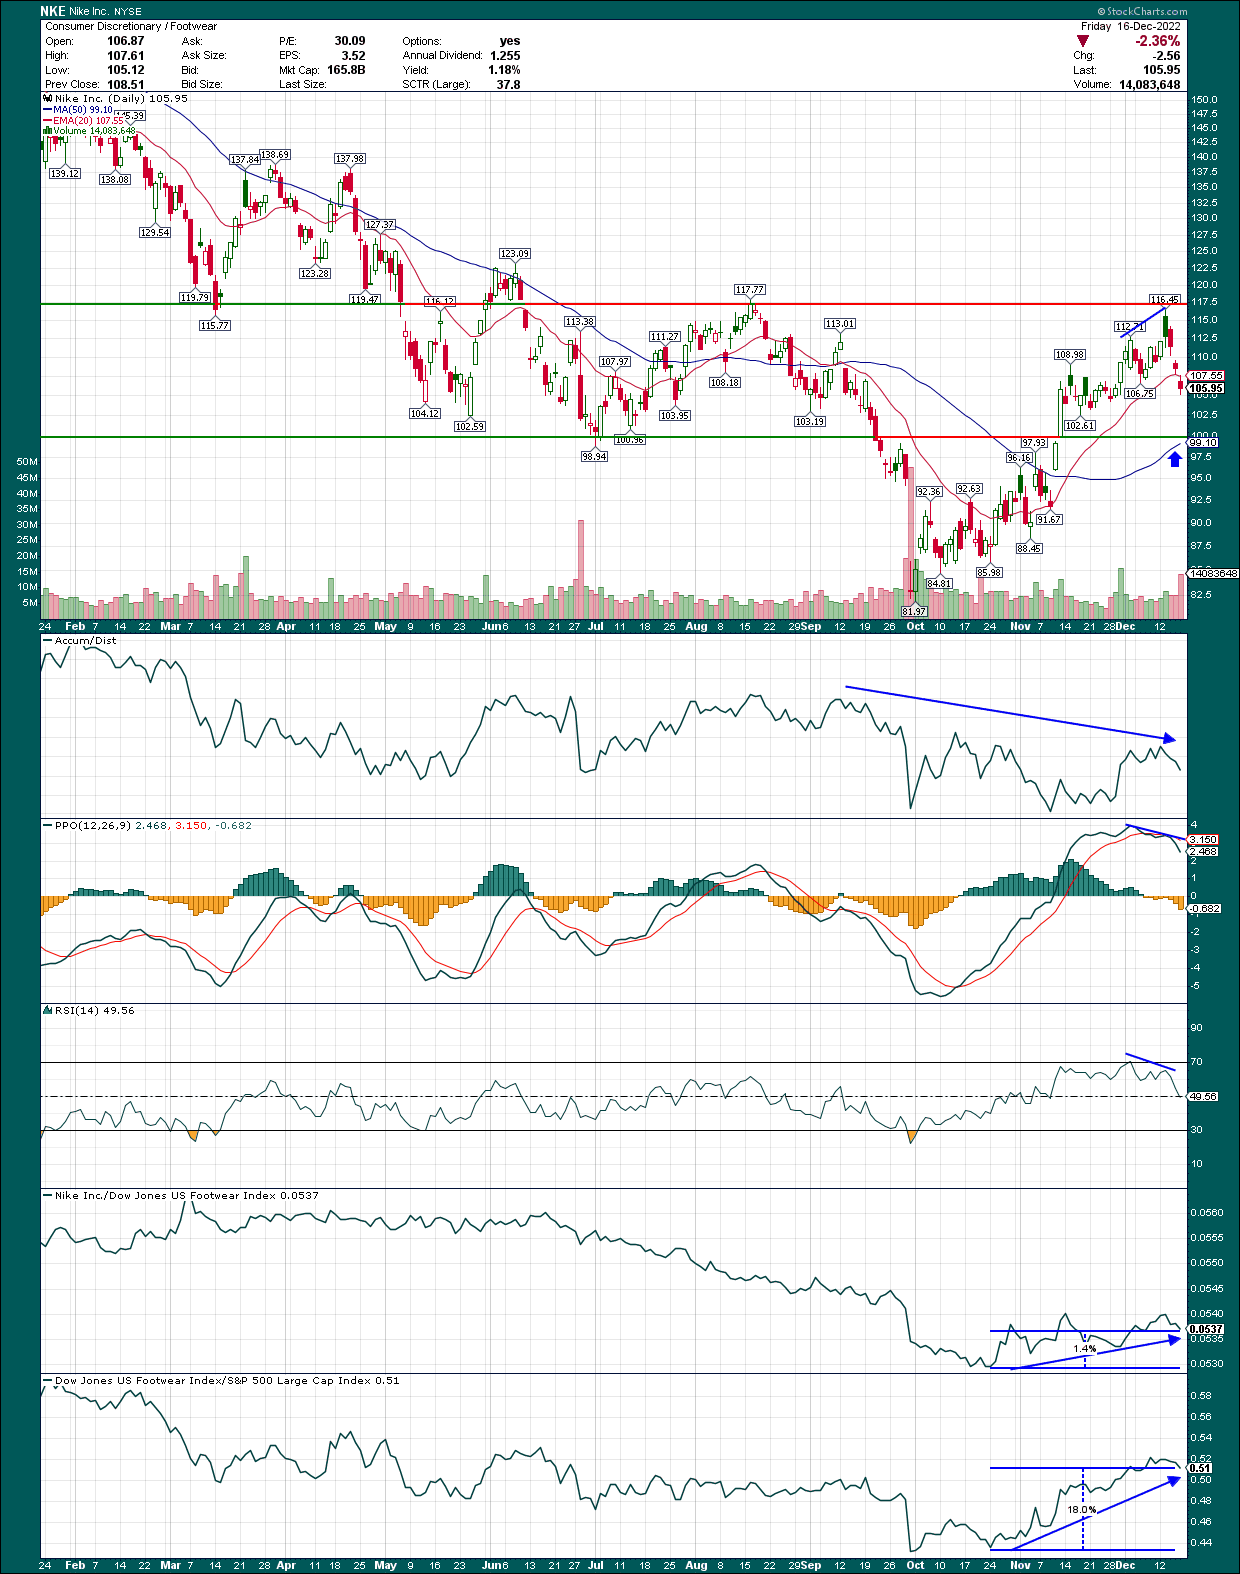
On the price chart, we can see the most recent rally stalled right at the level it did back in August. That’s not surprising as stocks rarely just blast right through significant points of resistance. It also doesn’t mean that Nike isn’t going higher; resistance just provides a stop along the way for up trending stocks. However, I don’t like the look of the indicators as Nike tries to break through, nor do I like the fact that the stock is already down $10+ in the space of three days after failing at resistance. You’d want an up trending stock to bounce off the rising 20-day exponential moving average, but we can see the stock failed that level quite convincingly on Friday. That’s not a good sign for the bulls.
Below that, there should be good support in the area of $99/$100, as that was a strong support level earlier this year, was gap support from November, and has the rising 50-day simple moving average. When levels like that converge, it makes for what should be very strong support. Thus, if we get a selloff after the earnings report, unless there’s some horrendous guidance, Nike would be a buy at that level of converging support.
I’m skeptical here because the indicators look very weak, and when that coincides with topping action on the price chart, I simply cannot reconcile the risk against the possible reward of getting long the stock.
The accumulation/distribution line is near its lows, meaning that the stock is – more often than not – finishing trading closer to the lows of the day than the highs. That’s not a bullish sign by any means as it indicates there’s selling going on throughout the day rather than sustained buying.
The PPO and 14-day RSIs also put in negative divergences in the past couple of weeks, meaning they failed to confirm the highs made in price. In plain English, that means buyer momentum fell off during a price rally, which generally happens near tops. As buyers dry up, momentum indicators show negative divergences, and we generally see a meaningful pullback after that.
Finally, the bottom two panels show the relative strength of Nike against its peers, and its peers against the S&P 500, respectively. Nike has basically kept pace with the group, but the group has blown away the S&P 500 in the past couple of months. That’s one feather in the cap of the bulls, but in my view, it’s not enough to risk owning this stock heading into earnings.
What to watch for
The last time I covered Nike I pointed out a few fundamental issues that remain issues in my view. As such, the earnings report will show either the company has made progress – and made the stock more attractive as a result – or it hasn’t. Given the price chart, it is my belief that a fair amount of good news has already been priced in, so it will take a monumental effort to move the needle without a larger pullback first.
First up is inventory and gross margins, which are linked. Basically, the more inventory a wholesaler/retailer has, the more likely it is they’ll have to use promotions and discounting to move through that inventory, which causes margins to deteriorate. Inventory also has an implied and explicit cost as it consumes cash while the company waits to sell it, but that’s a separate issue from this discussion. TL;DR is that more inventory is bad, generally speaking.
Below we have gross margins as a percentage of revenue, as well as inventory in millions of dollars. Both are on a quarterly basis.
TIKR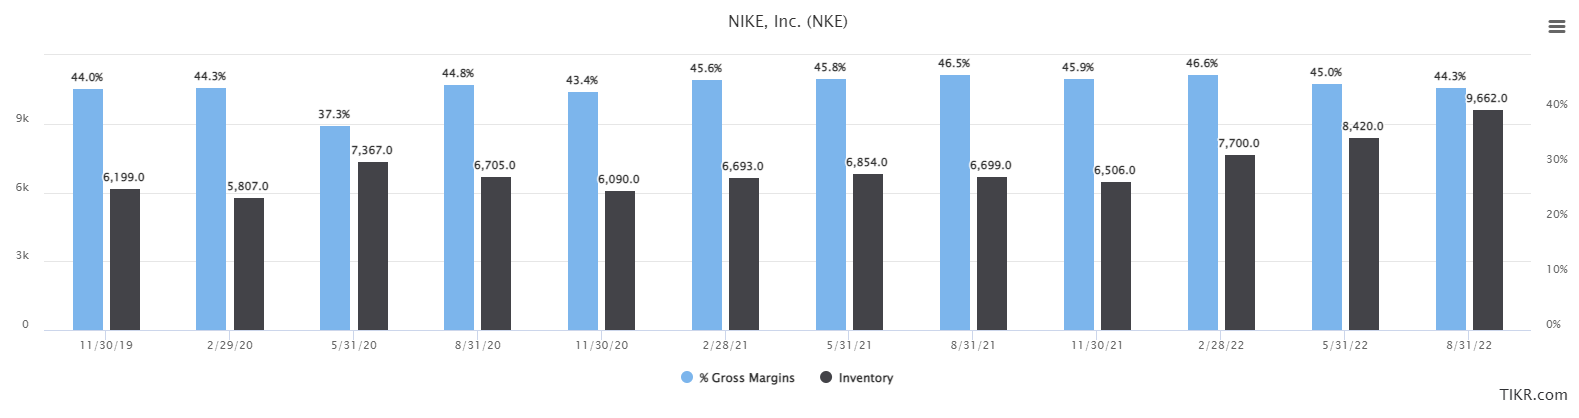
We can see the inflection point in 2021 when inventory began to rise and gross margins began to fall. That has continued through the most recent quarter, and we need to see that Nike has figured out a way to reduce inventory without giving away product at horrible margins. The first thing to look for is that Nike has less inventory, and that its gross margins are at least 44.3% of revenue. If we get another quarter of decline in gross margins and/or another rise in inventory, I think there’s significant downside for the stock.
“But wait”, says the astute reader, “it’s okay because Nike has higher revenue than prior quarters, so more inventory makes sense.” That’s true to an extent, but as we can see below, normalizing for higher sales still shows Nike has too much inventory.
TIKR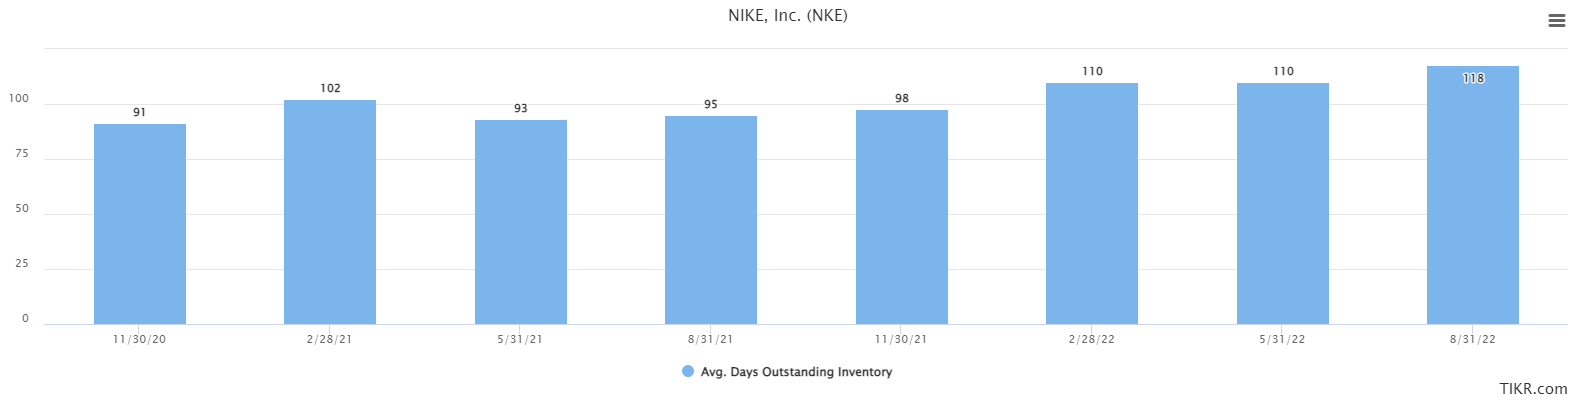
The company ended last quarter with 118 days of revenue outstanding in inventory, which basically means it could theoretically completely stop all forms of production for four months and still hit its revenue level. This is about 30 days longer than what is normal for Nike; it has too much inventory.
Apart from that issue, I’ve always maintained that Nike spends far too much money on SG&A. You’d think a company with the tremendous revenue growth Nike has shown over the years would see significant SG&A leverage, but you’d be wrong. Below numbers are quarterly.
TIKR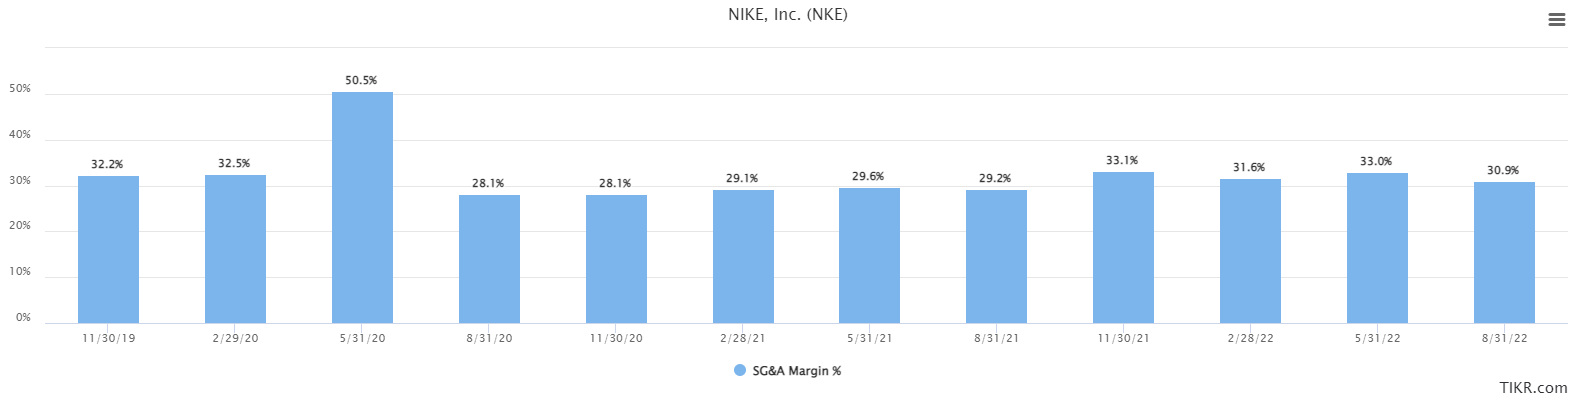
We’ve seen slight improvements off of multi-year highs in the past couple of quarters, but that’s nothing to write home about. We’re still nearly 300bps off the company’s best levels, which is just unacceptable to me. There’s no reason Nike has to spend so freely, but it always has and it appears it always will. At any rate, look for signs of SG&A leverage during the earnings release to see if there’s any progress to be had here. It’s critical for operating margins, and therefore, earnings.
Revisions are ugly
There’s really no nice way to put it; revisions have been absolutely awful for the past year and a half or so.
Seeking Alpha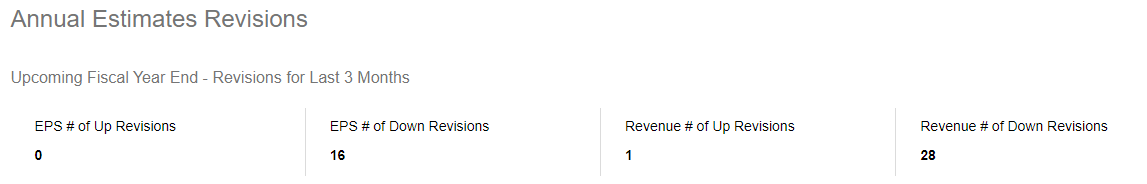
In the past three months alone, all 16 EPS revisions have been lower, while 28 of 29 revenue revisions have been lower. We want to see upward revisions, not lower ones, so there’s really nothing I can point to here for the bull case.
Seeking Alpha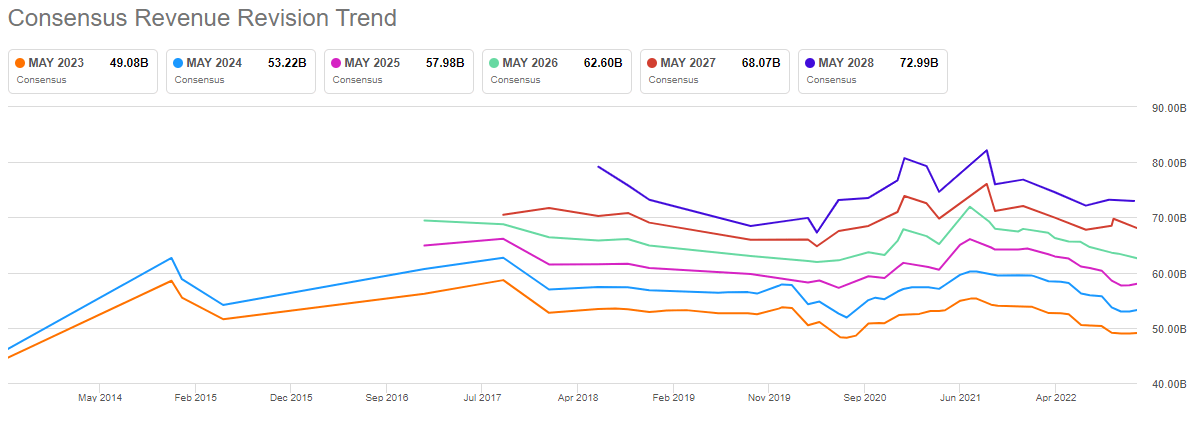
Revenue revisions are now back near their 2020 lows after rising sharply, so maybe there’s a bottom in there somewhere. The earnings release could give us some signs of demand, particularly if management is bullish on China’s reopening.
Seeking Alpha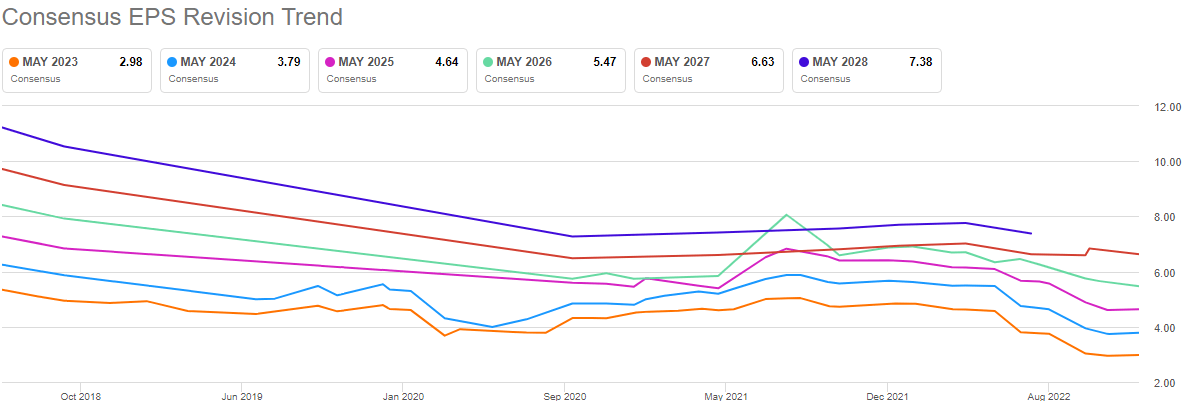
EPS revisions actually look much worse than revenue, and it’s because of the gross margin and SG&A issue we looked at above. Declining revenue and declining operating margins equals a down sloping EPS curve, and that’s exactly what we have.
That’s why it’s critical that Nike starts to show some improvement in gross margin and SG&A costs, because without it, these lines are going to continue to fall.
One final point here as it relates to the company beating earnings expectations; as we can see below, investors are going to expect a beat.
Seeking Alpha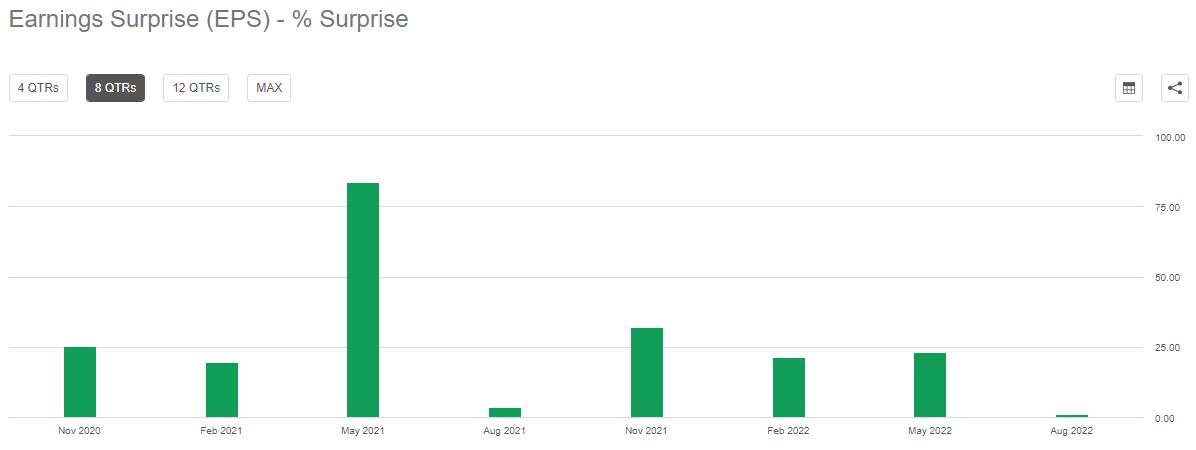
Each of the last eight quarters has shown some upside surprise. While that might make bulls feel warm and fuzzy, when a beat is expected, it makes the bar very high. And heaven forbid the company misses EPS; the bottom would likely fall out of the stock and we could see a massive selloff. Again, this is about probabilities, and when I see that a company always beats estimates, it tips the scales towards too much risk and not enough reward heading into the report.
Let’s value this thing
We’ll start with Seeking Alpha’s quant rating system, the summary of which can be seen below as of last Friday.
Seeking Alpha Quant Rating
The overall quant rating is a hold, as it has been for some time. The company scores highly for profitability and momentum, but that’s it. Given what we looked at above, I’m actually wondering if some of these scores are a little generous, but it more or less aligns with my assessment.
In order to value the stock, we’ll take a look at the forward P/E ratio, which can be seen below for the past three years.
TIKR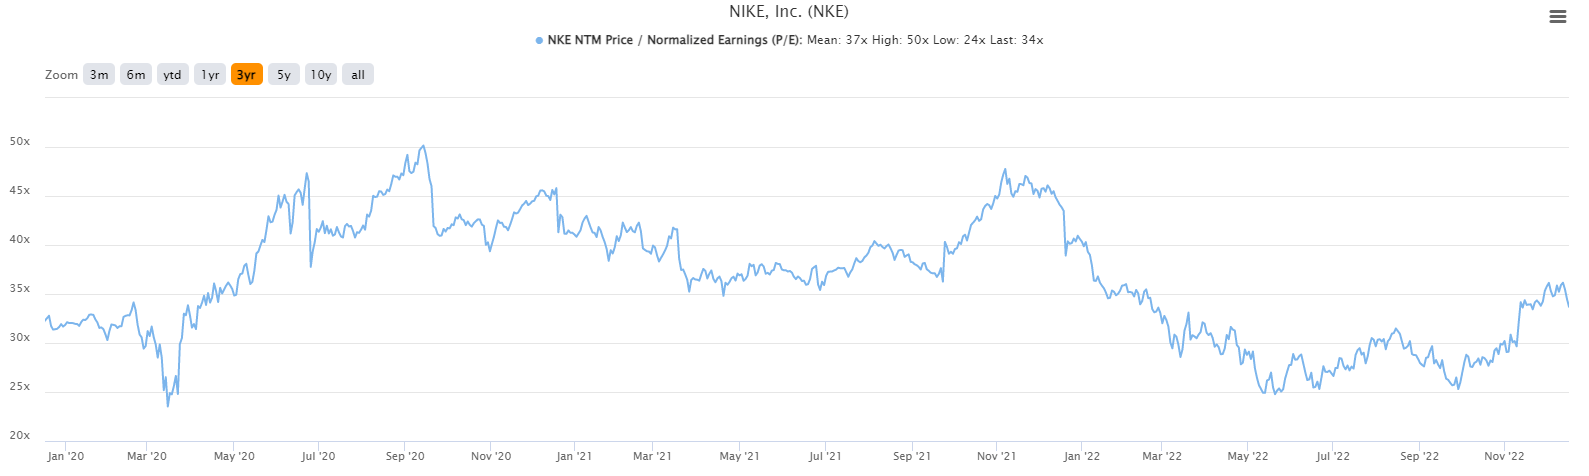
The average multiple during this time is 37X forward earnings, and the stock is about 34X today. That would argue the stock is at least somewhat cheap, but I’d invite you to remember that during this period, inventory has become bloated, gross margins have fallen, SG&A costs have risen, and analysts have consistently and significantly downgraded revenue and earnings expectations.
In other words, the fundamental picture for Nike is much worse than it was a year or two ago, and the stock should be priced accordingly. As far as I can tell, it isn’t, and that means there is simply too much risk in holding it into the earnings report. I would like the stock on a pullback to support at $99/$100, but if that level fails, look out below. I’m placing a hold rating on the stock because it is in no man’s land at this point, but the lines are drawn at support of $99/$100, and resistance at $116/$117.
Be the first to comment