

winhorse/iStock Unreleased via Getty Images
Investment Thesis
- I rate Nike (NYSE:NKE) as a buy: Nike’s strong brand image and endorsements with the most valuable sports teams and athletes in the world provide the company with a wide economic moat.
- I also rate Under Armour (NYSE:UA) (NYSE:UAA) as a buy: its current valuation and financial strength in combination with the expected return as according to my DCF model show that Under Armour could be an appealing investment. However, it comes with much higher risk compared to Nike.
- According to the Seeking Alpha Quant Ranking, Nike is clearly ahead of its competitor Under Armour. Within the sector, Nike is ranked at position 293 and Under Armour is at 438 (out of 531). Considering the industry ranking, Nike is 5th (out of 7) and Under Armour is 32nd (out of 33).
- According to the HQC Scorecard, Nike scores 80 out of 100 points. This is a very attractive overall rating in terms of risk and reward. The company produces particularly strong results in the categories of Economic Moat (94 out of 100 points), Profitability (80 out of 100), Valuation (80 out of 100) and Expected Return (80 out of 100).
- Under Armour scores 56 out of 100 points according to the HQC Scorecard. This is only a moderately attractive scoring in terms of risk and reward. The company achieves very attractive ratings in the categories of Valuation (96 out of 100 points) and Expected Return (100 out of 100) and attractive ratings for Financial Strength (72 out of 100). In terms of Economic Moat, however, Under Armour is rated as unattractive (29 out of 100).
- The overall rankings of the HQC Scorecard demonstrate that Nike is currently much more attractive than Under Armour in terms of risk and reward.
Nike’s and Under Armour’s Competitive Positions
In a previous Under Armour analysis, which I recently wrote for Seeking Alpha, I examined the competitive advantages and disadvantages of the company in greater detail:
“Although Under Armour has been able to find its niche in the sporting goods manufacturing industry, its competitors Nike and adidas are still far in front of Under Armour in terms of brand value and brand recognition. Proof of this is the fact that Under Armour is not even listed in the ranking of the 500 most valuable brands in the world according to Brand Finance, while Nike is listed at position 49 (with an estimated brand value of $33,176 million) and adidas at 130.”
In the same analysis, I pointed out Nike’s strong financial capabilities and demonstrated what this means for Under Armour:
“Compared to its main opponents Nike and adidas, Under Armour has additional competitive disadvantages: Nike in particular has much stronger financial capabilities to invest in the marketing of its products as well as in technology and innovation. Furthermore, Nike’s stronger financial capabilities enable the company to contract the best and most high potential athletes in order to promote their brand and products. Proof of Nike’s stronger financial capabilities is the fact that the company generated EBIT’s of $7,231 million in 2021 while Under Armour generated EBIT’s of only $524 million in the same year.”
All of these examples show that Nike has a much stronger competitive position as compared to Under Armour, which is a first indicator that Nike would be the more appealing investment choice when investing with a long investment-horizon.
The Valuation of Nike and Under Armour
Discounted Cash Flow [DCF]-Model
In terms of valuation, I have used the DCF Model to determine the intrinsic value of Nike and Under Armour. The method calculates a fair value of $133.72 for Nike and $18.27 for Under Armour. At the current stock prices, this gives Nike an upside of 22.5% and 111.5% for Under Armour.
Nike has an average Revenue Growth Rate [FWD] of 7.92% over the last five years. Therefore, over the next 5 years, I assume it will have a Revenue Growth Rate of 6% and an EBIT Growth Rate of 8%.
Under Armour has a Revenue Growth Rate [FWD] of 4.0% from the last five years on average. I assume a Revenue Growth Rate and EBIT Growth Rate of 3% over the next 5 years for the company.
The GDP Growth Rate of the United States is about 3% per year on average. Therefore, I assume a Perpetual Growth Rate of 3% for Under Armour. Due to Nike’s strong brand image, its economic moat and growth prospects, I expect it to grow with a higher growth rate and therefore assume a Perpetual Growth Rate of 4%.
For my calculations, I’ve used Nike’s current discount rate [WACC] of 8% and Under Armour’s current discount rate [WACC] of 8.75%. Furthermore, I used an EV/EBITDA Multiple of 23.6x for Nike and 8.0x for Under Armour. Both are the companies’ latest twelve months EV/EBITDA.
My calculations are based on the following assumptions as presented below (in $ millions except per share items):
|
Nike |
Under Armour |
|
|
Company Ticker |
NKE |
UAA |
|
Revenue Growth Rate for the next 5 years |
6% |
3% |
|
EBIT Growth Rate for the next 5 years |
8% |
3% |
|
Tax Rate |
14% |
8.2% |
|
Discount Rate [WACC] |
8.00% |
8.75% |
|
Perpetual Growth Rate |
4% |
3% |
|
EV/EBITDA Multiple |
23.6x |
8.0x |
|
Current Price/Share |
$109.12 |
$8.64 |
|
Shares Outstanding |
1,568 |
462 |
|
Debt |
$12,627 |
$1,476 |
|
Cash |
$8,574 |
$1,009 |
|
Capex |
$758 |
$101 |
Source: The Author
Based on the above, I calculated the following results (in $ millions except per share items):
Market Value vs. Intrinsic Value
|
Nike |
Under Armour |
|
|
Market Value |
$109.12 |
$8.64 |
|
Upside |
22.5% |
111.5% |
|
Intrinsic Value |
$133.72 |
$18.27 |
Source: The Author
Relative Valuation Models
Nike and Under Armour’s P/E [FWD] Ratio
With Nike’s P/E Ratio currently being 28.26, which is 21.23% below its 5 Year Average P/E Ratio (35.88), it provides us with an indicator that the company is currently undervalued.
Under Armour’s P/E Ratio is currently 10.49, which is 18.5% below the sector median of 12.87. For this reason, Under Armour is also currently slightly undervalued.
Dividend Projections for Nike
For the calculation below, I will assume an average dividend hike of 7% per year for Nike. Due to its strong competitive position, growth prospects, low dividend payout ratio of only 30.86% and the company’s dividend growth rate of 11.2% on average over the last five years, I expect Nike to be able to raise its dividend by at least 7% per year on average.
Another indicator demonstrating that Nike should be able to raise its dividend by at least 7% per year on average is the company’s 5 Year Average EPS Diluted Growth Rate [FWD] of 16.24%.
Projection of Nike’s Dividend and Dividend Yield When Assuming a Dividend Growth Rate of 7% per Year on Average
Source: The Author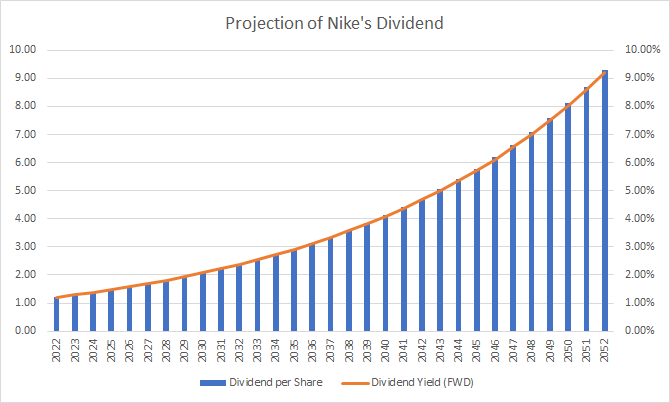
In the table below, you can find Nike’s accumulated dividend when assuming a dividend growth rate of 7% per year. You can also see that in 2042, you would have received 54.19% of your initial investment in the form of dividends (for simplification, no withholding tax has been taken into account) and 123.30% after 30 years.
Projection of Nike’s Accumulated Dividend When Assuming a Dividend Growth Rate of 7% per Year on Average
|
Year |
Dividend per Share |
Dividend Yield [FWD] |
Accumulated Dividend |
|
2022 |
1.22 |
1.21% |
1.21% |
|
2032 |
2.40 |
2.38% |
19.07% |
|
2042 |
4.72 |
4.67% |
54.19% |
|
2052 |
9.29 |
9.20% |
123.30% |
Source: The Author
Dividend Projections for Under Armour
For 2023, consensus EPS estimates are 0.63 for Under Armour. Below you can find the dividend and dividend yield in the case that Under Armour were to pay a dividend. These calculations are based on the EPS estimate of 0.63 multiplied by a range of hypothetical payout ratios:
|
EPS [FWD] |
Payout Ratio |
Annual Dividend |
Yield |
|
0.63 |
10% |
0.06 |
0.72% |
|
0.63 |
20% |
0.13 |
1.44% |
|
0.63 |
30% |
0.19 |
2.16% |
|
0.63 |
40% |
0.25 |
2.88% |
|
0.63 |
50% |
0.31 |
3.60% |
|
0.63 |
60% |
0.38 |
4.31% |
Source: Seeking Alpha
In the following, it will be assumed that Under Armour will have a dividend payout ratio of about 30% in 2023, which is similar to Nike. For the calculation below I will assume an average dividend hike of 3% per year beginning in 2023. Due to the uncertainty of Under Armour’s dividend and the fact the company is currently not paying a dividend, I have made more conservative estimates for its growth rate than for Nike.
Projection of Under Armour’s Dividend and Dividend Yield When Assuming a Dividend Growth Rate of 3% per Year on Average beginning in 2023
Source: The Author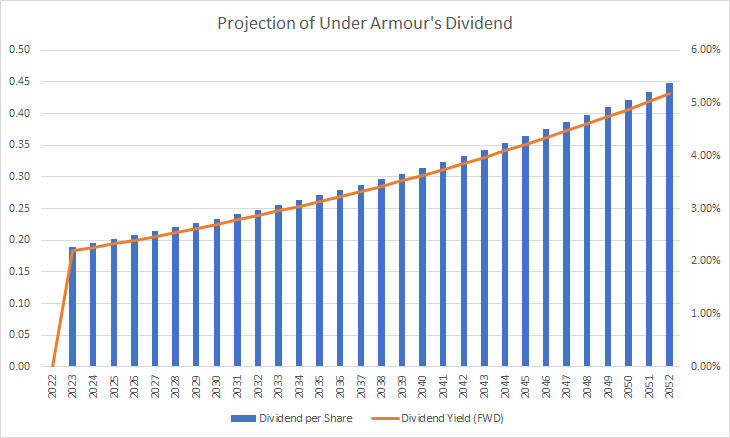
Below you can find the results of Under Armour’s accumulated dividend when assuming a growth rate of 3% per year on average beginning in 2023. In 2042, you would have received 59.09% of your initial investment in the form of dividends (again, for simplification no withholding tax has been included in the calculation).
In 30 years, your dividend yield would be 5.18% (assuming a growth rate of 3%), and the accumulated dividend would be 104.62%. The dividend yield for Nike would be 9.2% (when assuming a growth rate of 7%), and after 30 years the accumulated dividend would be 123.30% (as shown in the previous section).
Projection of Under Armour’s Accumulated Dividend When Assuming a Dividend Growth Rate of 3% per Year on Average beginning in 2023
|
Year |
Dividend per Share |
Dividend Yield [FWD] |
Accumulated Dividend |
|
2022 |
0.00 |
0.00% |
0.00% |
|
2032 |
0.25 |
2.87% |
25.21% |
|
2042 |
0.33 |
3.86% |
59.09% |
|
2052 |
0.45 |
5.18% |
104.62% |
Source: The Author
The results of the dividend projections for Nike and Under Armour strengthen my belief that Nike is the more attractive proposition when investing with a very long time-horizon. In my opinion, Nike’s dividend is much more secure and predictable than that of Under Armour.
Financial Overview: Nike vs. Under Armour
|
Nike |
Under Armour |
|
|
Ticker |
NKE |
UAA |
|
Sector |
Consumer Discretionary |
Consumer Discretionary |
|
Industry |
Footwear |
Apparel, Accessories and Luxury Goods |
|
Market Cap |
171.16B |
3.84B |
|
Revenue |
46.71B |
5.73B |
|
Revenue Growth 5 Year [CAGR] |
6.34% |
3.18% |
|
EBITDA |
7.51B |
562.13M |
|
EBIT Margin |
14.29% |
7.36% |
|
ROE |
43.11% |
12.73% |
|
P/E GAAP [FWD] |
28.26 |
10.49 |
|
Dividend Yield [FWD] |
1.12% |
– |
|
Dividend Growth 3 Yr [CAGR] |
11.43% |
– |
|
Dividend Growth 5 Yr [CAGR] |
11.20% |
– |
|
Consecutive Years of Dividend Growth |
20 Years |
– |
|
Dividend Frequency |
Quarterly |
– |
Source: Seeking Alpha
The High-Quality Company [HQC] Scorecard
“The aim of the HQC Scorecard that I have developed is to help investors identify companies which are attractive long-term investments in terms of risk and reward.” Here you can find a detailed description of how the HQC Scorecard works.
Overview of the Items on the HQC Scorecard
“In the graphic below, you can find the individual items and weighting for each category of the HQC Scorecard. A score between 0 and 5 is given (with 0 being the lowest rating and 5 the highest) for each item on the Scorecard. Furthermore, you can see the conditions that must be met for each point of every rated item.”
Source: The Author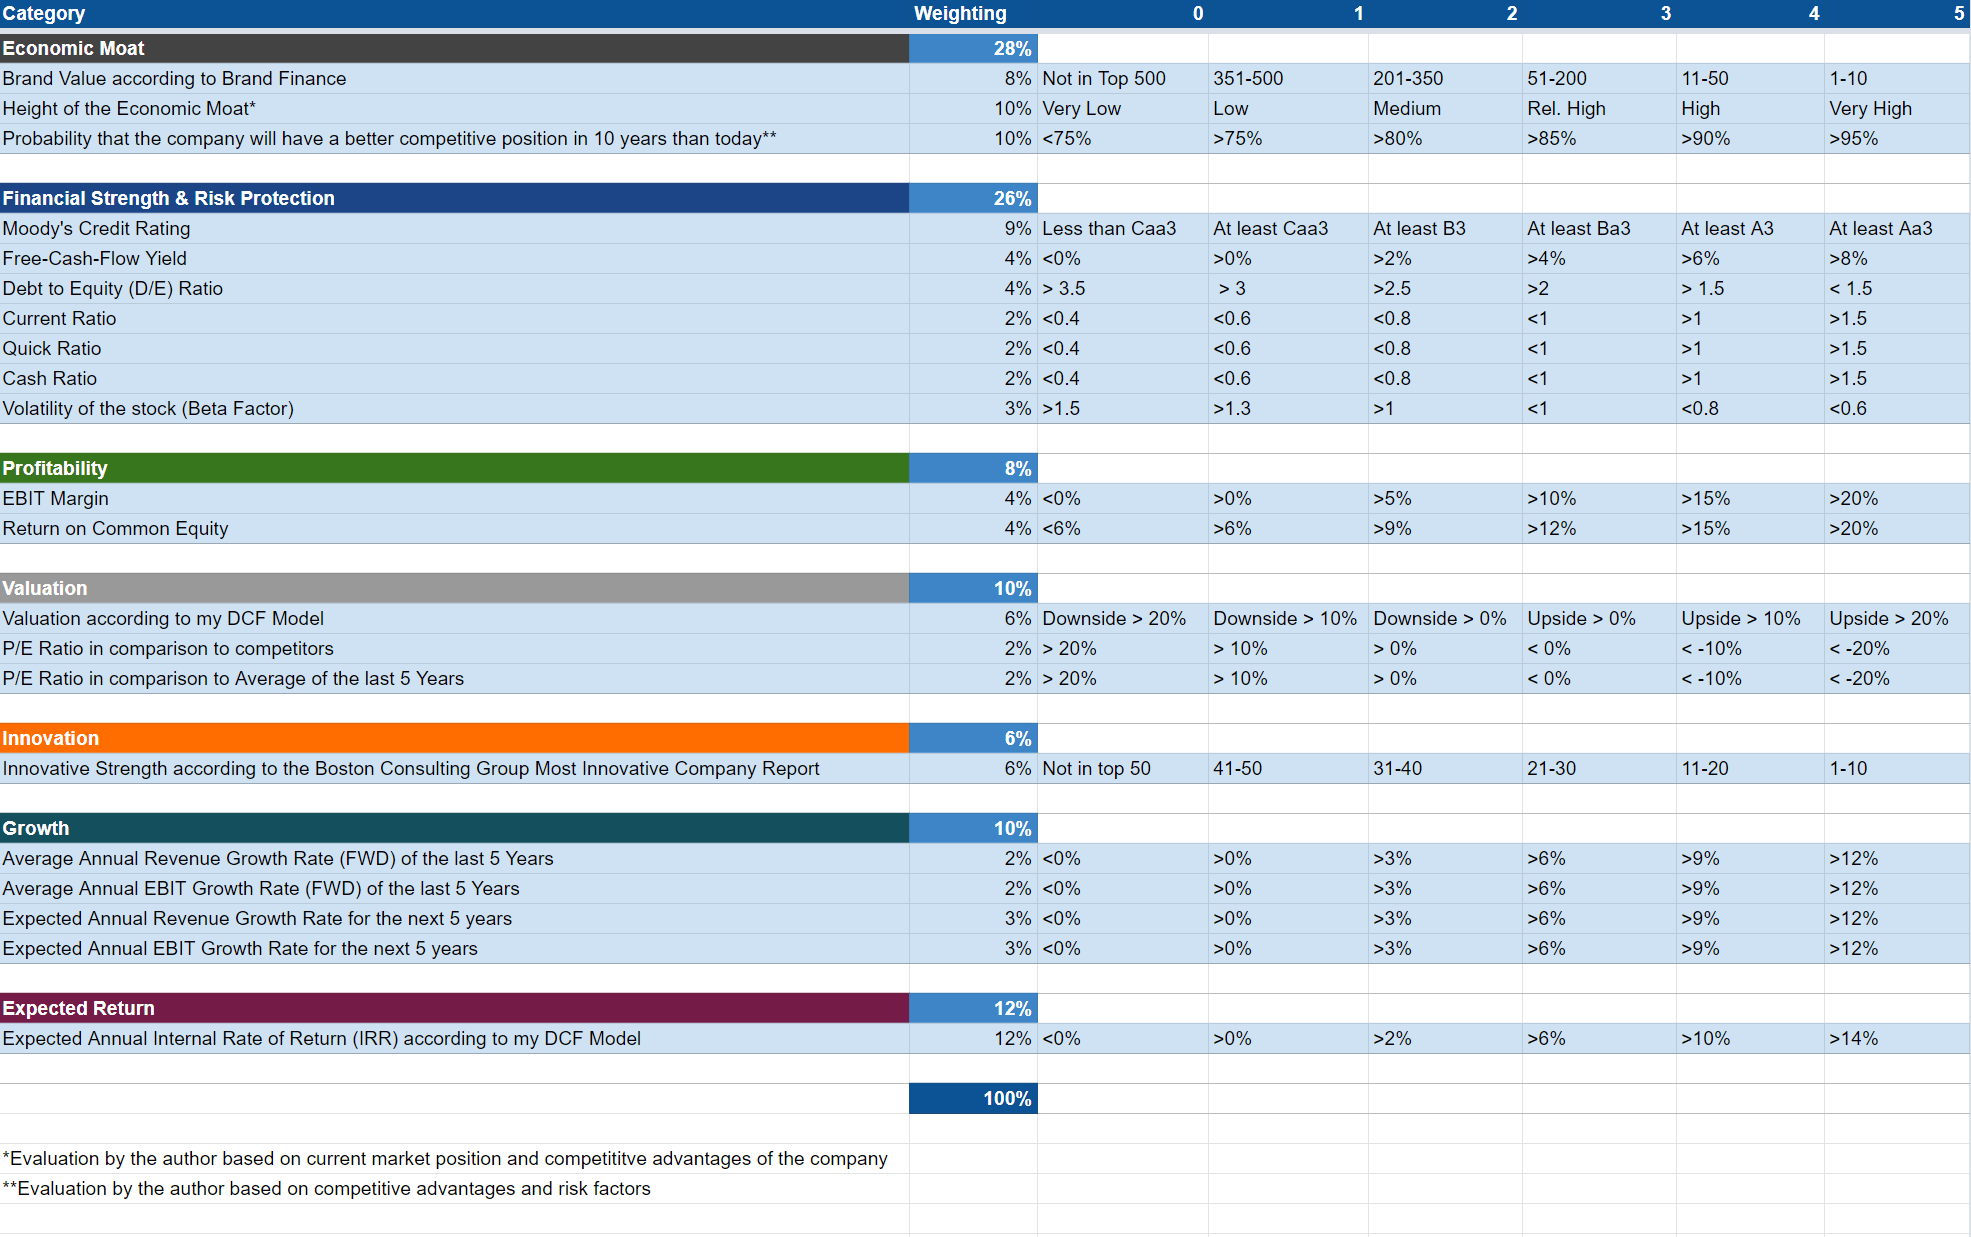
Nike and Under Armour According to the HQC Scorecard
Source: The Author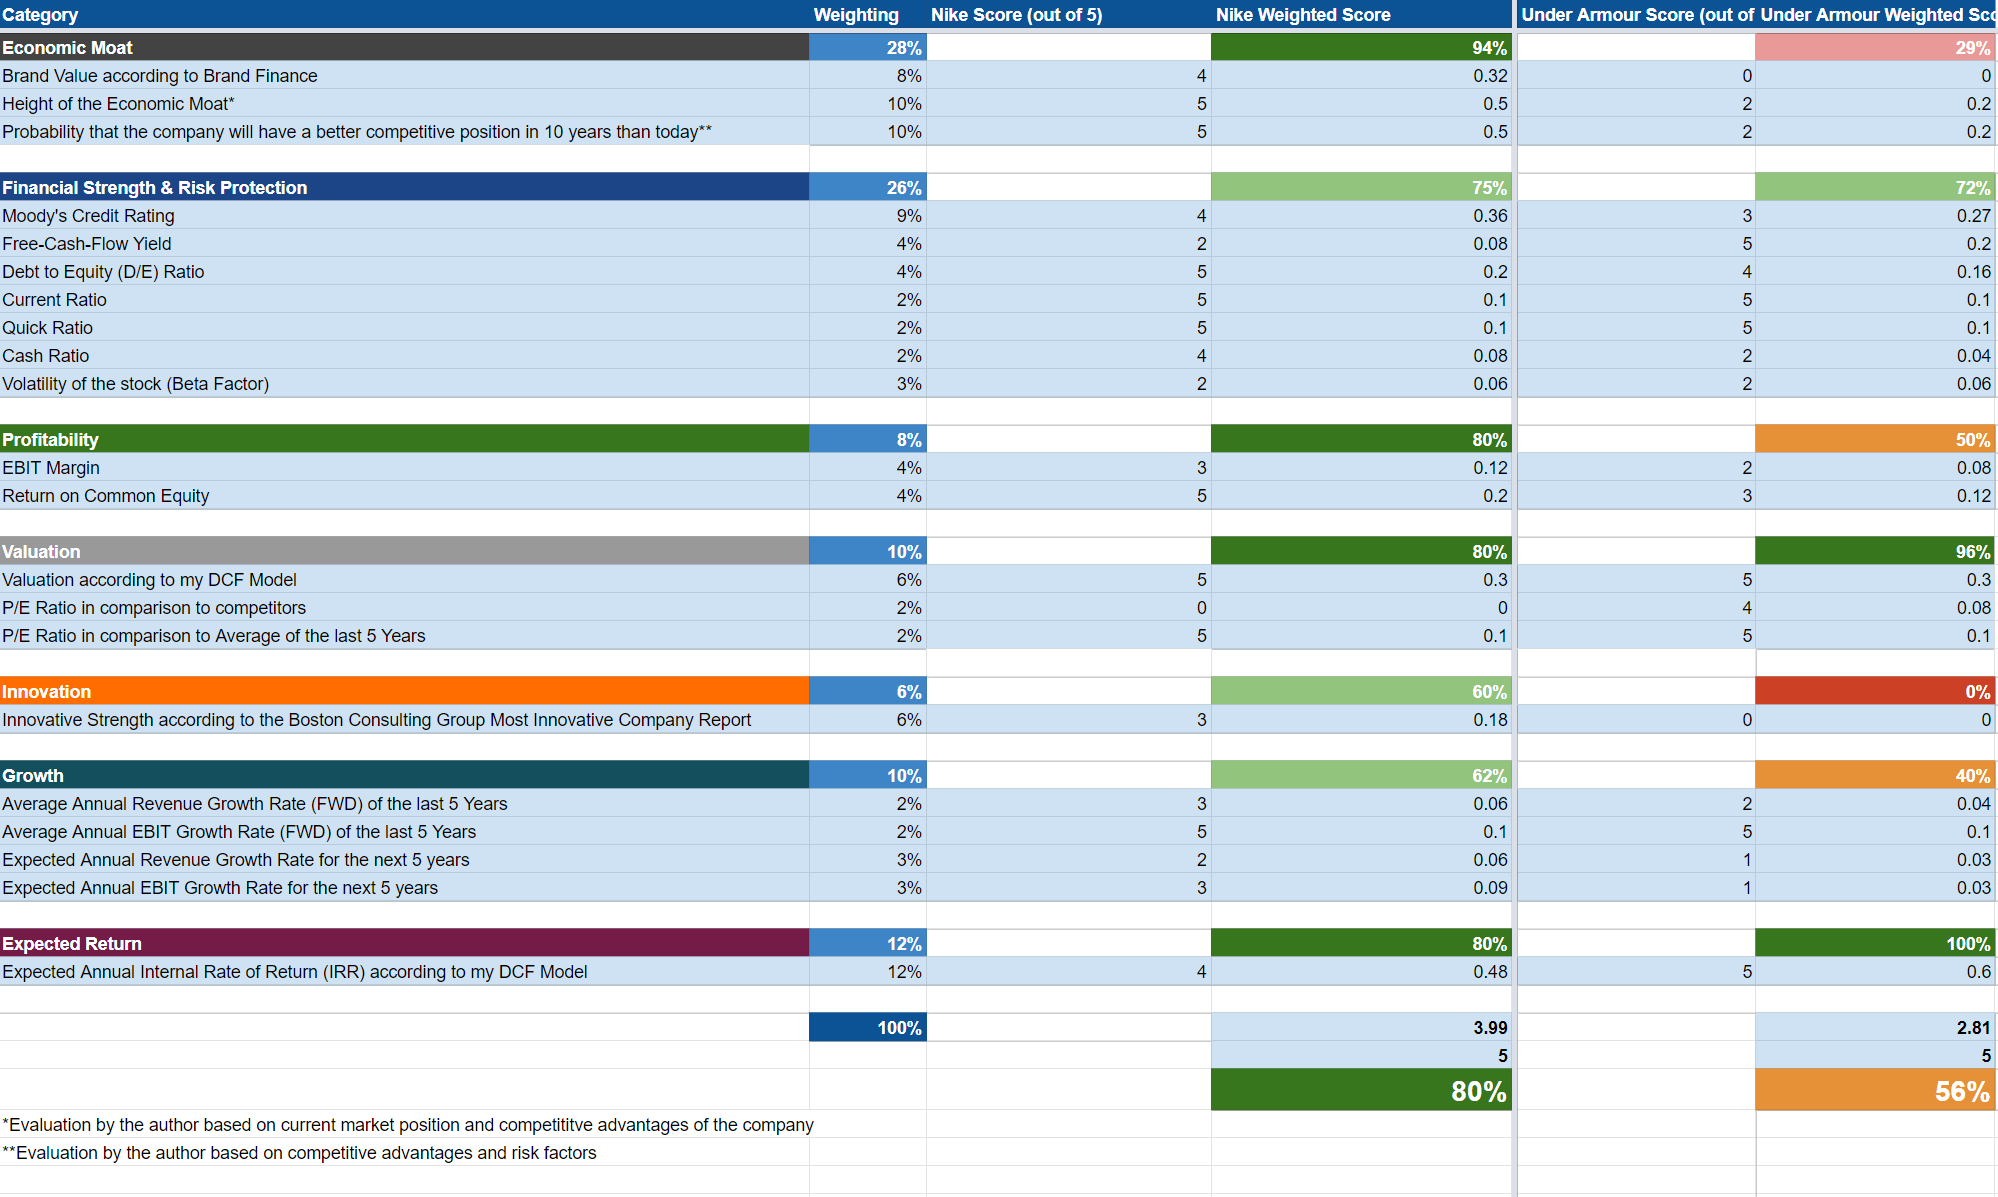
According to the HQC Scorecard, the overall score of Nike is 80 out of 100 points. The scoring of the HQC Scorecard shows that Nike can be classified as a very attractive investment in terms of risk and reward.
Nike is rated as very attractive in the categories of Economic Moat, Profitability, Valuation and Expected Return and the company is rated as attractive in the categories of Financial Strength, Innovation and Growth. In all categories of the HQC Scorecard, Nike is considered to be either very attractive or attractive, which is yet another indicator of the company’s enormous strength.
Under Armour’s overall score is 56 out of 100, resulting in a moderately attractive rating in terms of risk and reward.
Under Armour is rated as very attractive in the categories of Valuation and Expected Return. Furthermore, the company is rated as attractive in the category of Financial Strength. For Profitability and Growth, it achieves a moderately attractive rating. However, the company scores low in terms of Economic Moat, showing a high discrepancy compared to Nike’s rating in the same category.
Nike’s overall HQC Scorecard rating (80 out of 100 points) is currently much higher than that of Under Armour (56 out of 100), which reinforces my argument for choosing Nike.
Nike and Under Armour According to Seeking Alpha’s Quant Factor Grades
According to Seeking Alpha’s Factor Grades, Nike is rated with an F and Under Armour with a C+ in terms of Valuation. For Growth, Nike gets a D+ while Under Armour gets an A+. In terms of Profitability, Nike is A+ and Under Armour B-. In the category of Momentum, Nike receives a C while Under Armour gets a D-. Below you can find the Seeking Alpha Quant Factor Grades in full:
Source: Seeking Alpha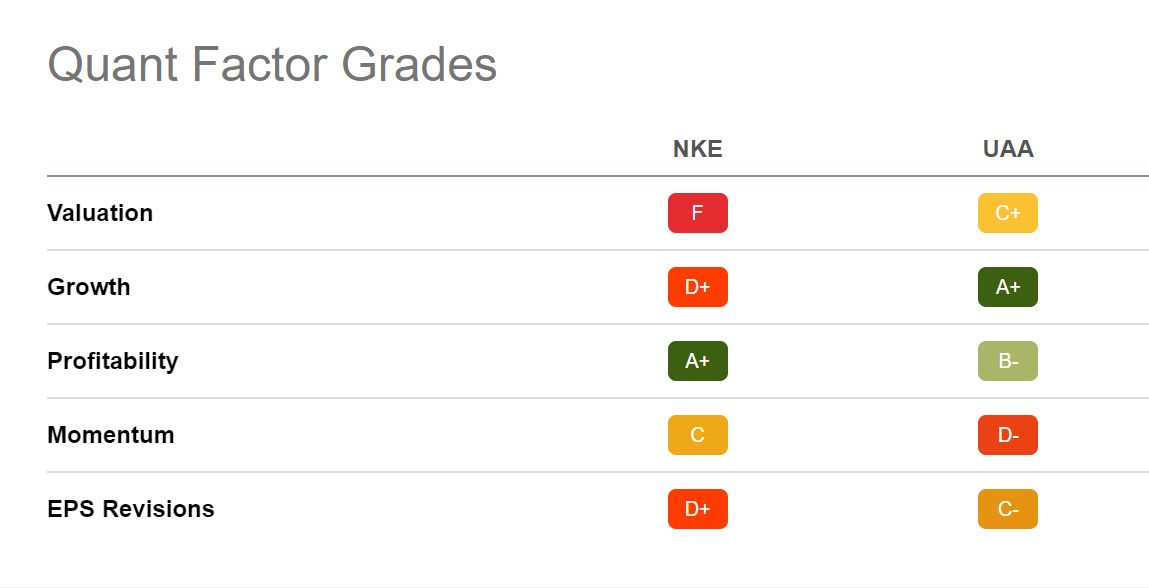
Nike and Under Armour According to Seeking Alpha’s Quant Ranking
Taking into account the Seeking Alpha Quant Ranking, Nike is significantly better positioned than Under Armour. Within the sector, Nike is ranked 293rd while Under Armour is 438th (out of 531). In terms of industry ranking, Nike is 5th (out of 7) and Under Armour is 32nd (out of 33). Below you can find the results of the Seeking Alpha Quant Ranking for both Nike and Under Armour:
Source: Seeking Alpha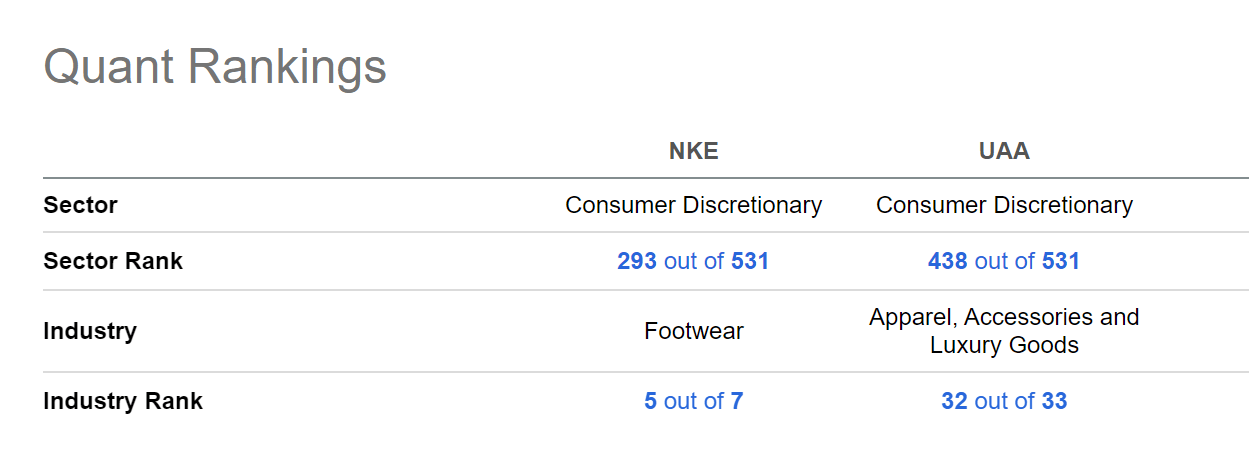
The Seeking Alpha Quant Ranking reinforces the theory that an investment in Nike is currently more attractive than investing in Under Armour.
Risks
One of the main risk factors of investing in Under Armour is the strong competition the company has with Nike and adidas (OTCQX:ADDYY), which I described in more detail in my previous analysis:
“From my point of view, the existence of two strong competitors such as Nike and adidas is the biggest risk factor for Under Armour. This intense competition could result in a loss of Under Armour’s market share and furthermore could result in a decrease of the company’s revenue and profit margin. Additionally, Under Armour competes with companies such as PUMA (OTCPK:PMMAF) and Lululemon Athletica (LULU) as well as with smaller and regional companies who may have local brands with stronger recognition regionally than Under Armour.”
In the same article, I also mentioned that the level of risk is significantly higher when investing in Under Armour compared to Nike:
“Under Armour’s strong and intense competition, especially with Nike and adidas, are strong indicators that the risk of investing in the company is relatively high. This is also proven by the rating of the HQC Scorecard, in which Under Armour only received a moderately attractive rating in terms of risk and reward.”
One of the risk factors that is relatively similar for both companies is the impact of a damaged brand image. This would have adverse effects on their revenues and profit margins. In this case, I also see a significantly higher risk for Under Armour, since the company has not managed to build such a strong and robust brand image.
All in all, I see a significantly higher risk when investing in Under Armour, which reinforces my belief that Nike would be the better long-term investment when choosing one of the two sporting goods manufacturers.
The Bottom Line
Although Under Armour’s current valuation (P/E [FWD] Ratio of 10.49) is currently more attractive than that of its competitor Nike (P/E [FWD] Ratio of 28.26), different valuation methods show that Nike seems to be the more appealing choice when selecting one of the two sporting goods manufacturers and while investing with a long investment-horizon.
The Seeking Alpha Quant Ranking demonstrates a significantly better ranking for Nike: within the industry, it is ranked at position 5 (out of 7) while Under Armour is ranked at 32 (out of 33). Within the sector, Nike holds position 293 while Under Armour sits at 438 (both out of 531).
When it comes to risk and reward, the HQC Scorecard also confirms Nike to be currently much more attractive than Under Armour. While Nike is rated as very attractive in terms of risk and reward (with an overall score of 80 out of 100 points), Under Armour only reaches a moderately attractive score (56 out of 100). Nike shows very strong results in the categories of Economic Moat, Profitability, Valuation and Expected Return while Under Armour only shows the same for Valuation and Expected Return.
For these reasons I would choose Nike if I had to select one out of the two sporting goods manufacturers, although I still rate both companies as a buy. If you decide to buy both, I would recommend not to overweight the Under Armour position in an investment portfolio due to the higher risk factors shown in this analysis.
Author’s Note:
Thank you very much for reading! If you have any questions regarding this analysis, feel free to leave a comment below!
Be the first to comment