

simarik
By Levi at StockWaves, produced with Avi Gilburt
It was about this same time last year that tech stocks were on an absolute tear. Valuations were straining to absurd extensions a la Stretch Armstrong (do you remember that toy?). You know, even Stretch had his limits. I actually remember finding that limit one day and the results were quite messy.
It would seem that many stocks found their limits last fall and in the present have come smashing down to Earth. Case in point is Netflix (NASDAQ:NFLX) from a high of $700 down to the low found at $163. We’re going to share what we were giving as guidance just before that $700 high and then the evolution of that analysis over the past 12 months.
Now, this is not to just look into the Way Back Machine and congratulate ourselves on explaining what happened in a storm that has already past like some Rip Van Winkle weatherman. Our aim in these articles is to share our methodology with the readership and hopefully shed some light on what truly drives markets.
As we have reiterated many times, yes, fundamentals are important. That’s why we use them in our work produced for our members. Lyn Alden is top of class in that world. In recent discussions regarding NFLX and other stocks she shared her current view.
The Fundamental View
Lyn’s comments: “NFLX is a stock that I have been bearish on for a while, and have compared it unfavorably to DIS for years. NFLX was operating in an increasingly competitive industry with a high valuation, and has now crashed.”
YCharts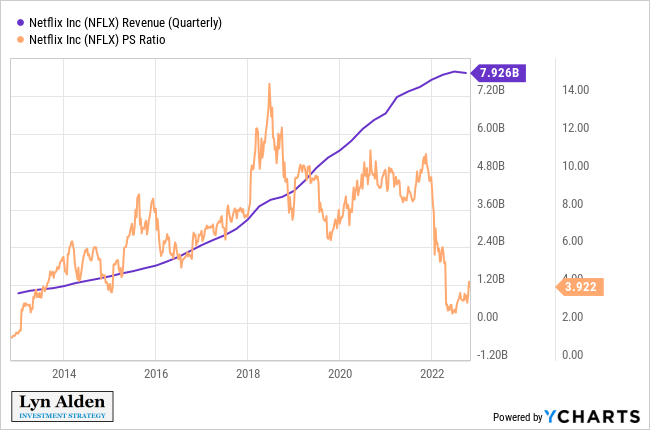
“Now that it has crashed, I’m no longer bearish on it, but I have no firm bullish view either. The valuation has reduced substantially, but growth has stalled, and so it risks becoming a value trap. Investors should do a lot of careful analysis before going long or short NFLX; there’s a higher than normal variance for this one.”
What Truly Drives Markets
While according to its price:sales ratio, NFLX was not as “overvalued” as it appeared to be from a fundamentals standpoint in early 2018, from a sentiment standpoint we were looking for a significant top in the fall of 2021. Yes, valuations were indeed exceeding even what some would term lofty levels. But we also had extensions in what we use to measure sentiment, the structure of price.
Sentiment simply stated is fear and greed. It’s the most basic of biological signals that drives crowd behavior. It’s this mass sentiment that moves markets. For a very recent review of why this is the case, I would encourage you to see this article written by Avi Gilburt a few weeks back:
Sentiment Speaks: Why Would The Market Rally After the CPI Report?
A 12-Month Lookback And The Evolution Of Analysis
Before we look forward, let’s briefly take stock of where we’ve been. It was in the Fall of 2021 that we began to project a likely significant top for NFLX. Here is our lead analyst, Zac Mannes, with his view at that moment in time:
MotiveWave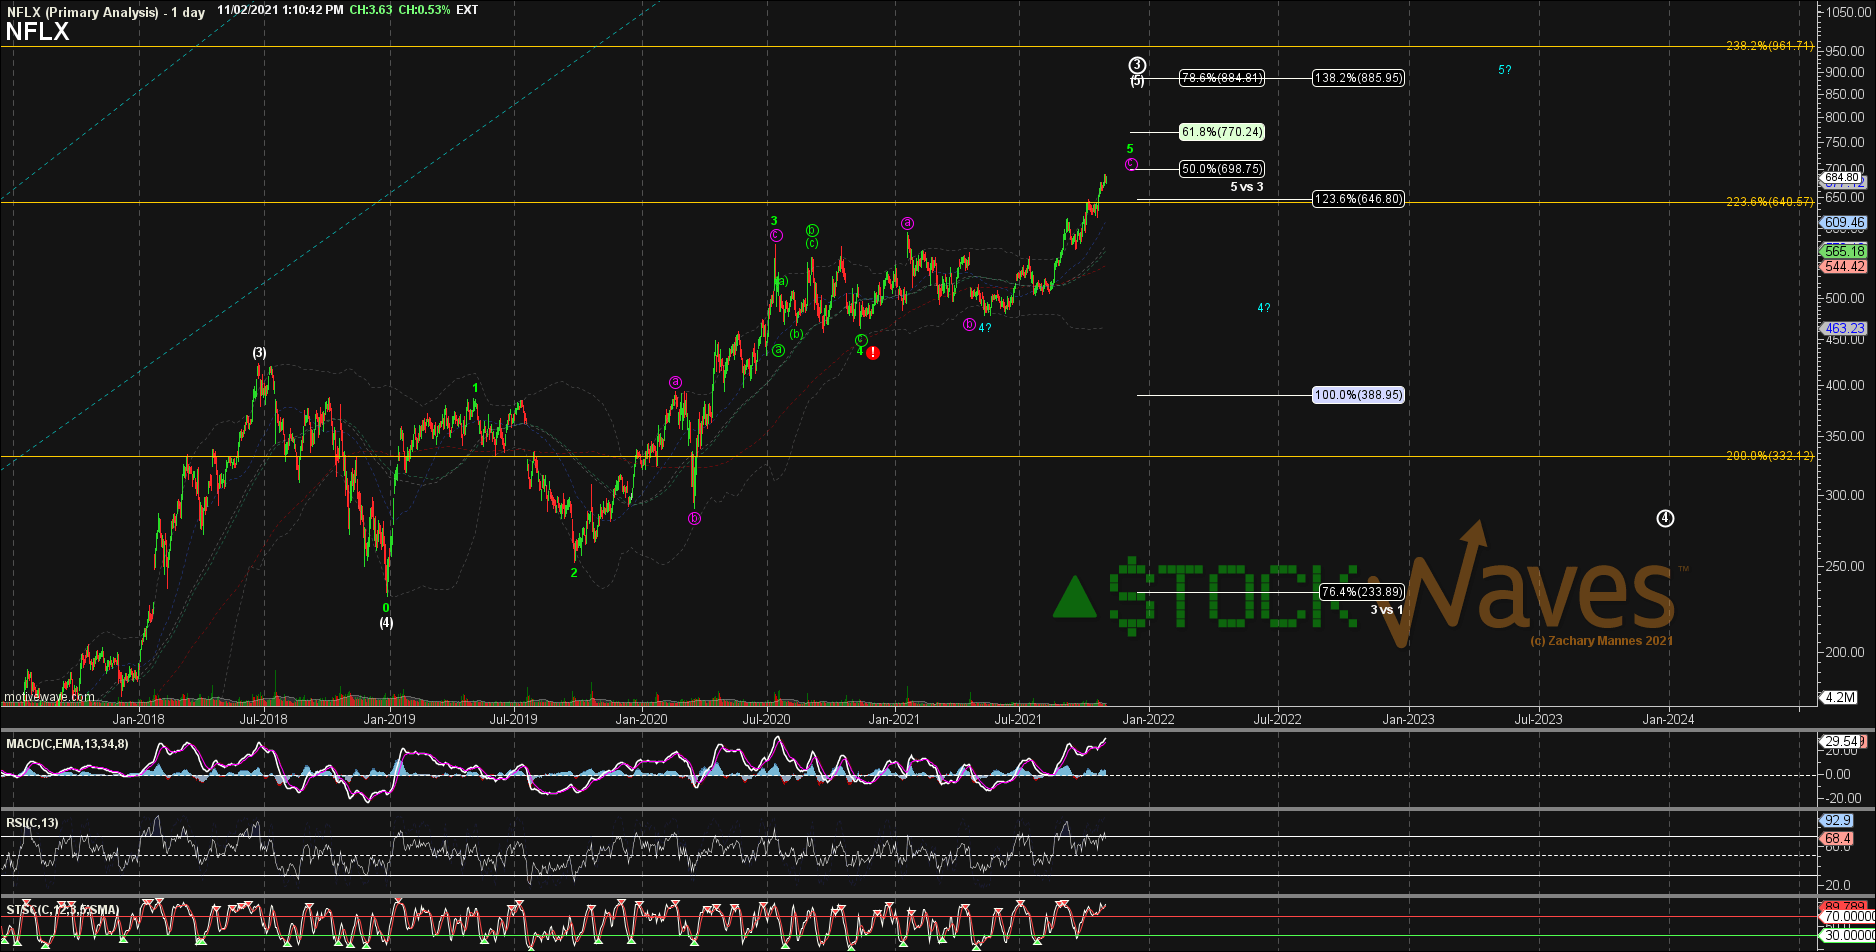
Note that there was a price target range of basically $700 – $885. We now know that NFLX found its last swing high at the lower end of that range at $700. At that moment though, the structure of price was telling us to be cautious. This was not a favorable risk:reward for any long entries. In fact, as you can see on this chart, Zac was initially projecting a move down to as low as the $275 area.
Let’s fast forward to the summer of this year and note how the evolution of analysis then began to point to an imminent low approaching.
MotiveWave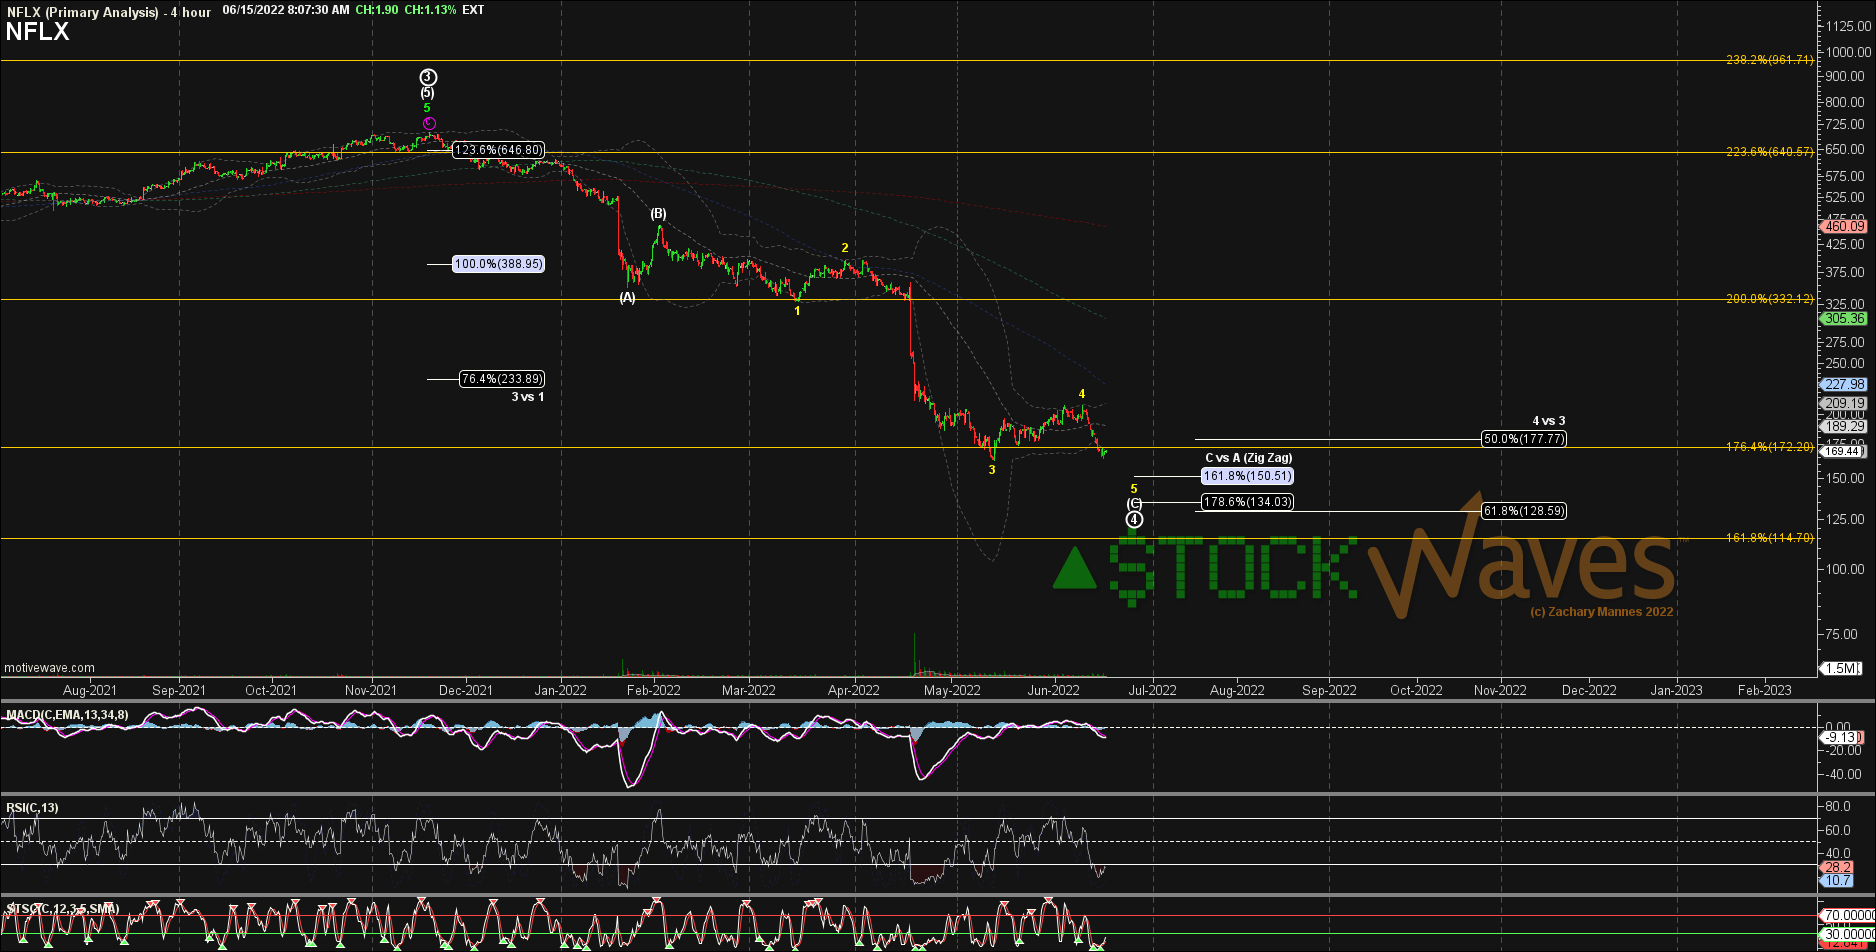
Speaking briefly to this evolution, you can see how the A-B-C corrective pattern was filling out as anticipated and the fifth wave of the C wave of the larger fourth wave was also near completion.
It was about three weeks ago that Zac and Garrett Patten also began to point out the likelihood that NFLX was nearing a temporary swing high in price.
MotiveWave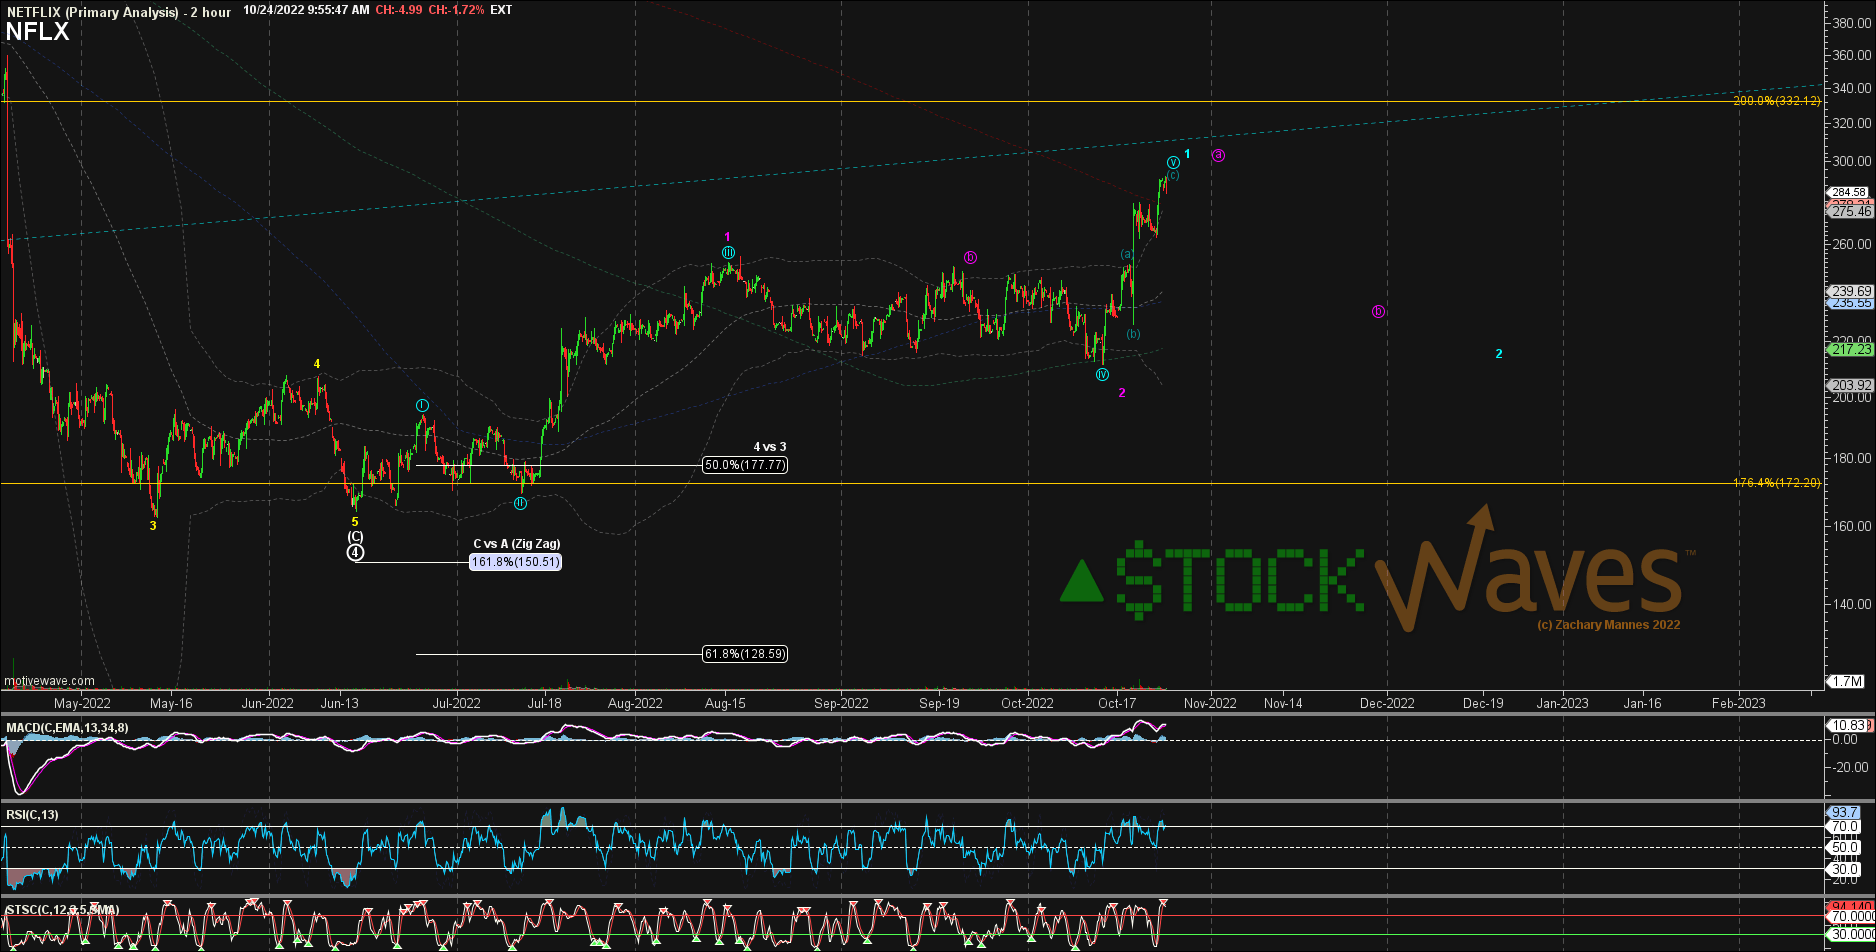
Now, A Look Forward
There are multiple paths possible. We endeavor to present to our members what we see as the most probable path, perhaps with an alternative path as well. This is not to proffer so many paths that one ends up being correct. We view the market from a probabilistic viewpoint. Markets are fluid, dynamic and non-linear in nature. However, they do give specific levels via the structure of price that will tell us what is most likely. As well, inside of this dynamic structure, we constantly update our guidance based on what the market gives us.
Whether this current rally up off the $163 low to $305 is just an A wave higher or a wave 1 of a larger rally yet to come, our view would be similar for the pullback now underway. Should this be a wave 2 pullback then the standard retracement levels would be between 38% to 62% of wave 1, shown by the blue box target zone.
TradingView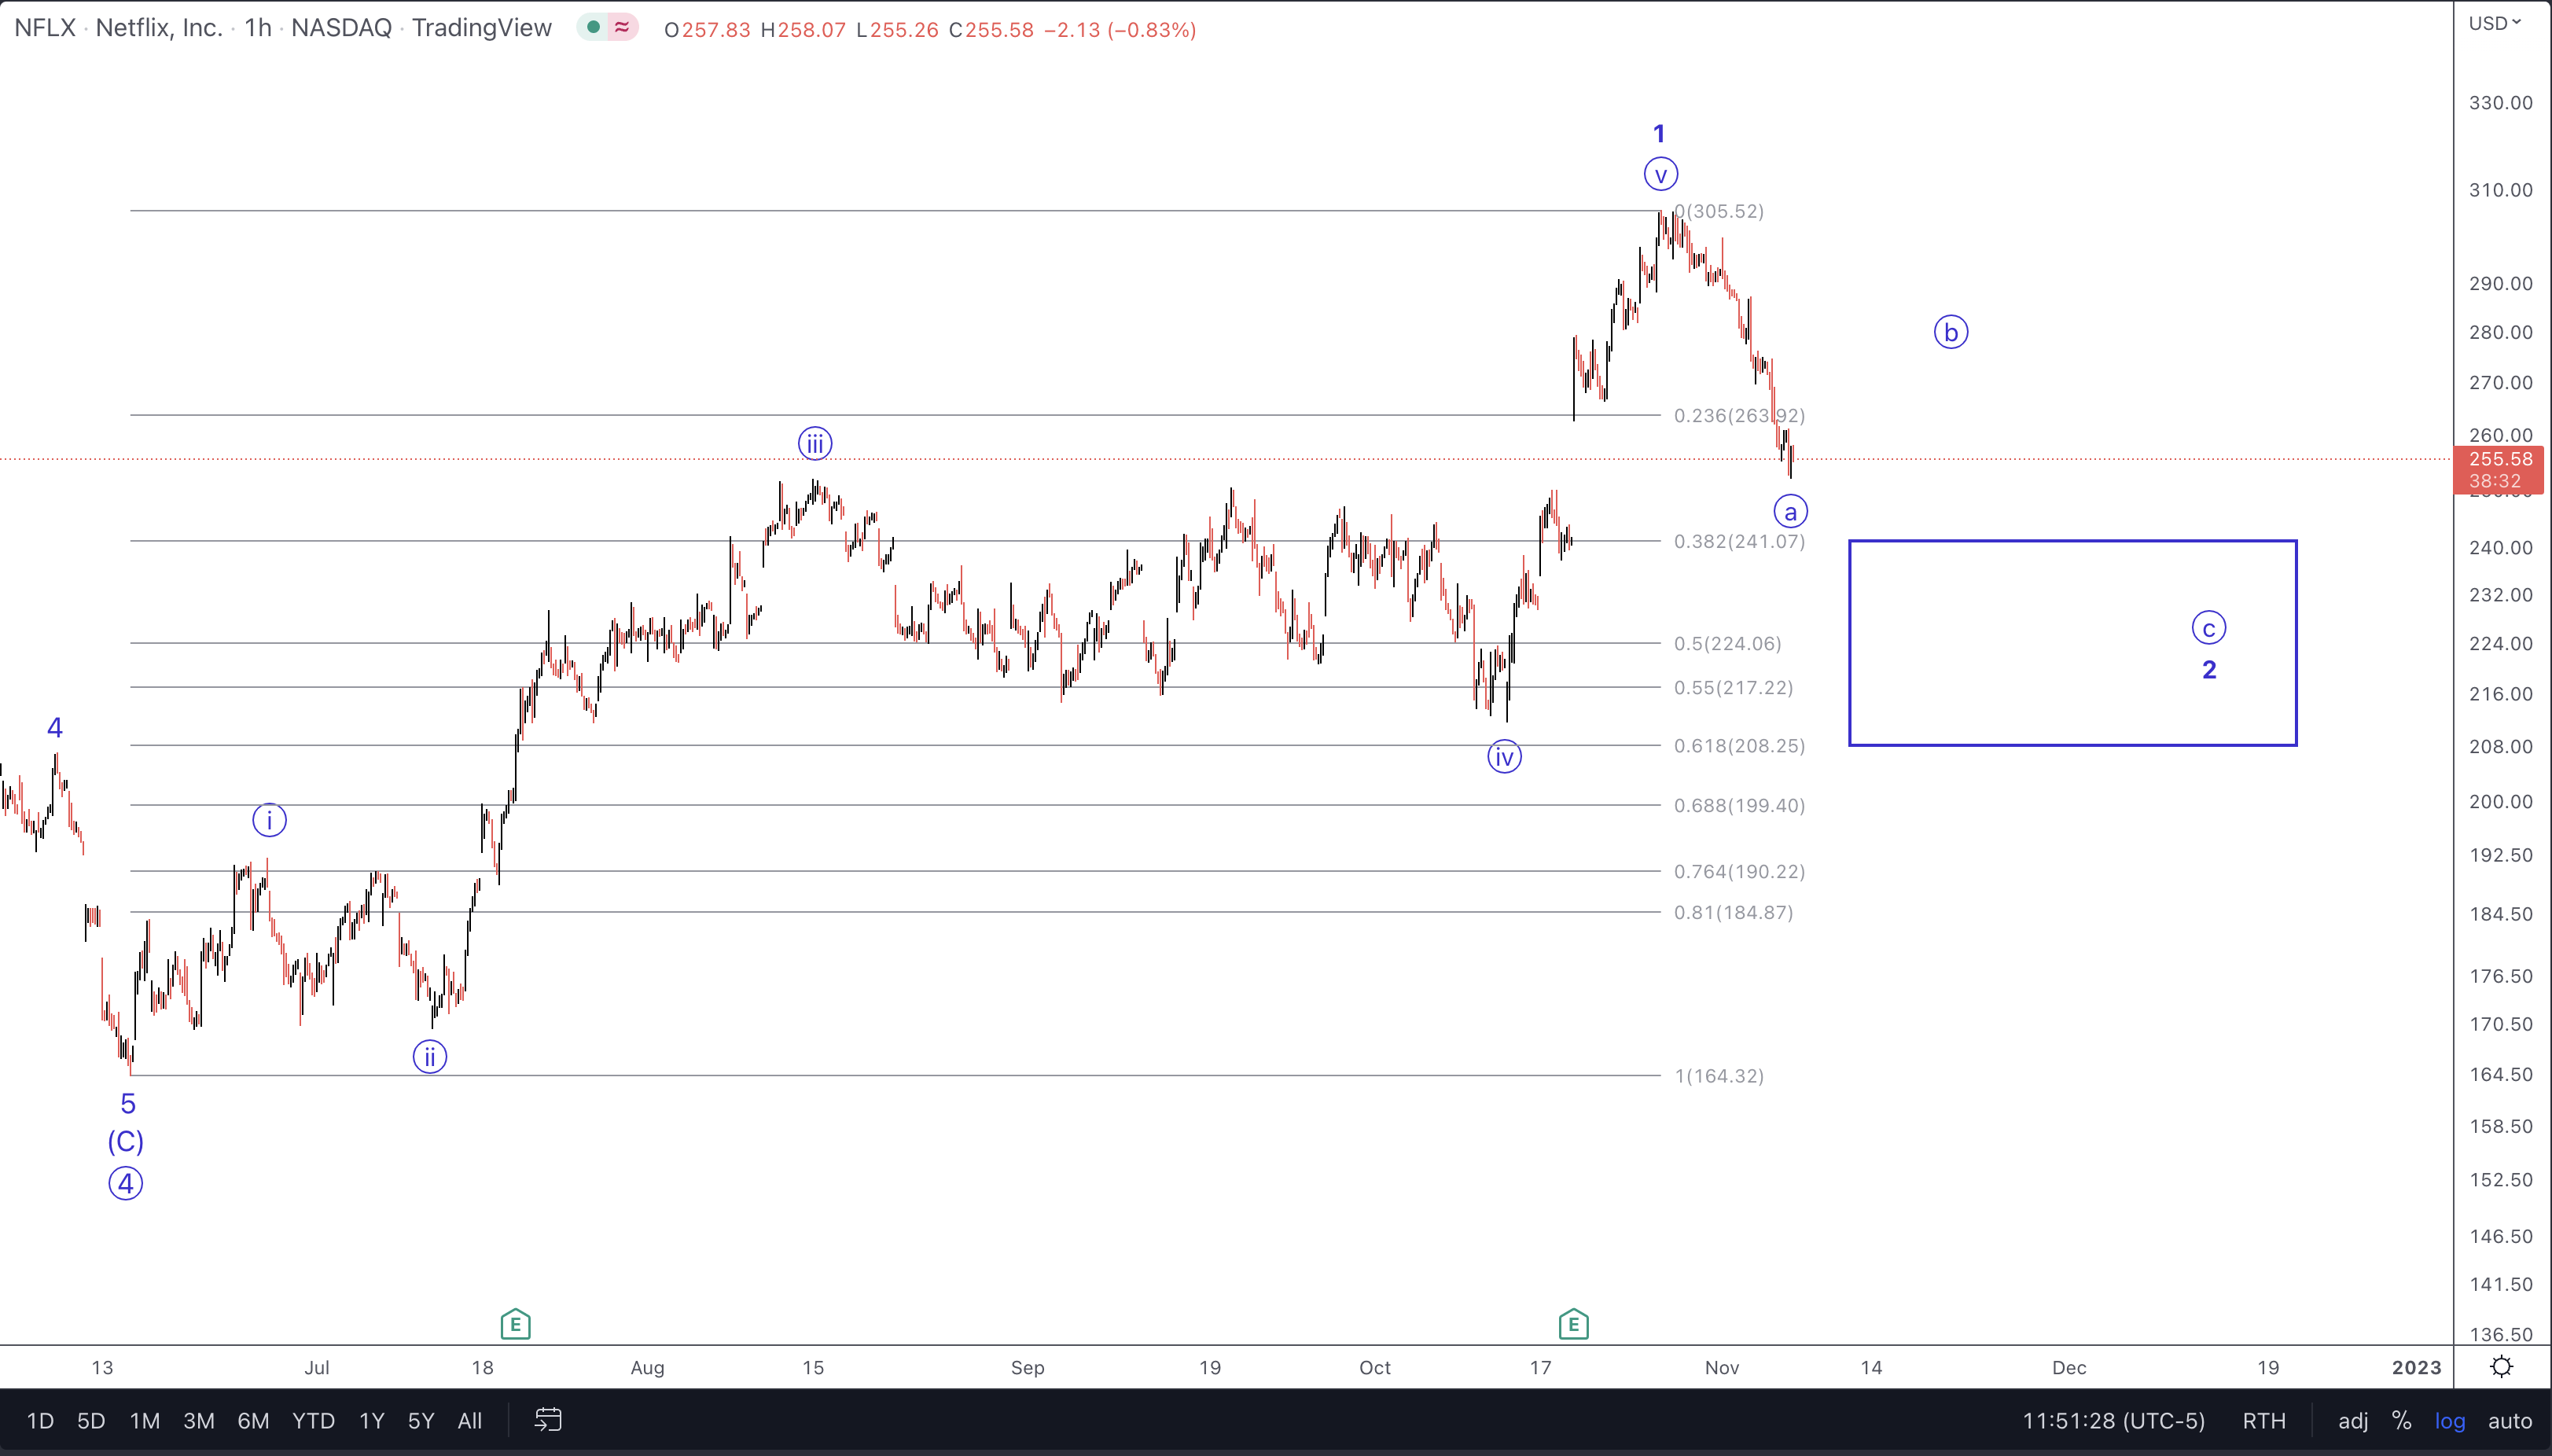
Risks And Conclusion
NFLX may see a direct move lower to complete the wave 2/B into the $200 area instead of a lesser degree wave circle ‘b’ shown on the above chart. However, since we have seen 5 waves up from the low struck back in June of this year, we view this as a temporary trend change and will be looking for higher prices once this correction completes.
In a longer-term view, should NFLX find a low in our target area and turn up, we will then be carefully monitoring the structure of that move up. Ideally, in a bullish scenario, price would create another lesser degree wave i-ii up and provide a high probability swing long entry point. We will update this chart accordingly.
Why Does Analysis Evolve?
Markets are not logical. They are emotional, and at many times irrational. Although in certain moments they seem to correlate to news events, in others there’s no reasonable explanation to be found for their movements. Analysis must evolve along the way so as to capture the middle of the move.
We likely will not exactly capture the perfect top or the perfect bottom of a move. But the context of where we are at any given time will helps us know when major turning points are highly probable, like what we saw in NFLX last year.
Then, when the corrective move is nearing completion, Elliott Wave analysis coupled with Fibonacci Pinball can assist us in favorable risk vs. reward setups. It’s the synergy between our fundamental analysis and Elliott Wave theory correctly applied that makes StockWaves a unique methodology.
There’s no other analysis methodology that we know of today that shows proper context of where a major company or index finds itself at any one moment in time.
I would like to take this opportunity to remind you that we provide our perspective by ranking probabilistic market movements based upon the structure of the market price action. And if we maintain a certain primary perspective as to how the market will move next, and the market breaks that pattern, it clearly tells us that we were wrong in our initial assessment. But here’s the most important part of the analysis: We also provide you with an alternative perspective at the same time we provide you with our primary expectation, and let you know when to adopt that alternative perspective before it happens.
There are many ways to analyze and track stocks and the market they form. Some are more consistent than others. For us, this method has proved the most reliable and keeps us on the right side of the trade much more often than not. Nothing is perfect in this world, but for those looking to open their eyes to a new universe of trading and investing, why not consider studying this further? It may just be one of the most illuminating projects you undertake.
Be the first to comment