

Juan Jose Napuri
It’s been a turbulent year for investors in the Gold Miners Index (GDX), and while the senior producers tend to hold up better than their peers, few have been left unscathed in this violent bear market. In Newmont’s (NYSE:NEM) case, the stock has found itself 52% off its all-time highs reached just six months ago, which can be attributed to a sharp decline in metals prices combined with inflationary pressures that have led to higher operating costs. Unfortunately, these inflationary pressures have proven sticky, and while Q4 will be better, costs will likely remain above $1,200/oz in 2023.
The good news is that, unlike some producers that are on life support or have already shuttered operations (Madsen, Tucano, Revenue-Virginius), Newmont is still very profitable even at current gold prices. Plus, while free cash flow went negative in Q3, this is partially due to one-time items and its heavy capex schedule. So, while there is the risk of a dividend cut if gold prices remain under pressure and 2023 may not be much better, this is a business with a very bright future given its strong pipeline and the current operating portfolio’s ability to weather cyclical and secular bear markets in the gold price. While I’m not long NEM yet, I would view any pullbacks below $39.75 as buying opportunities.
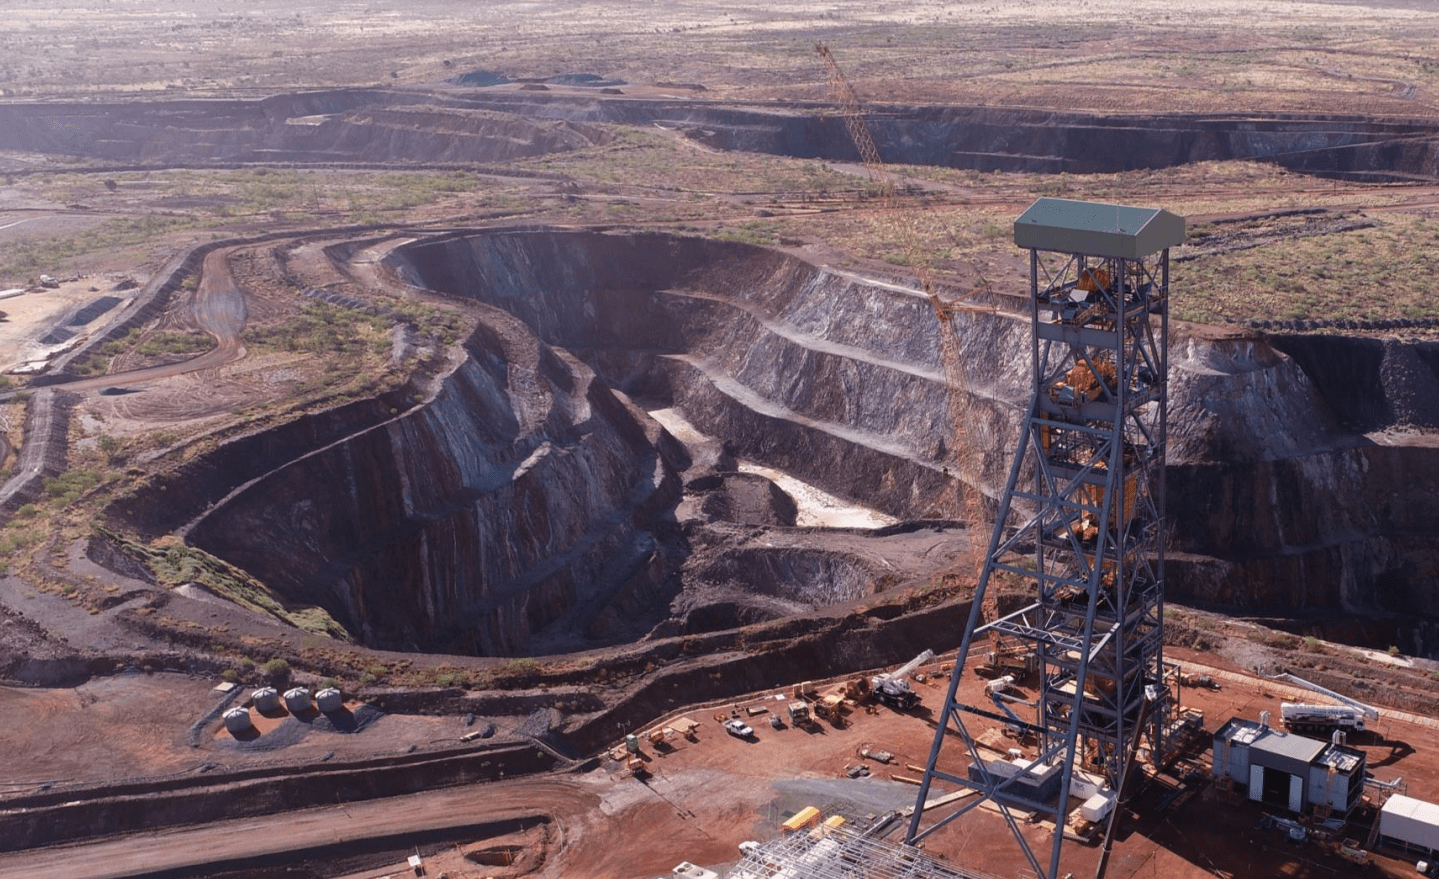
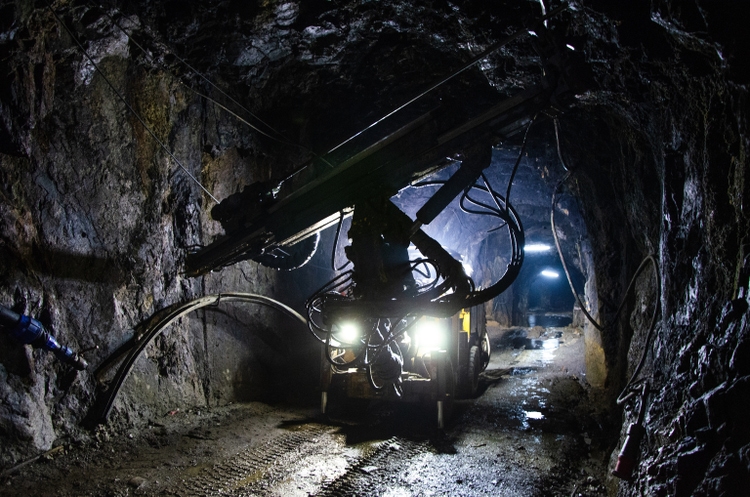
Newmont Operations (Company Presentation)
Q3 Production and Sales
Newmont released its Q3 results this week, reporting quarterly gold production of ~1.49 million ounces, a slight increase from the year-ago period. This was helped by a better quarter from its 100% owned North American, African, and Australian operations on a year-over-year basis, offset by lower production in South America and its Nevada joint venture (Nevada Gold Mines LLC). The stand-out performer in the quarter was Ahafo, with gold production of ~155,000 ounces. This represented a 25% increase year-over-year, helped by higher grades, and Akyem also had an excellent quarter, seeing a 15% increase year-over-year also due to higher grades.
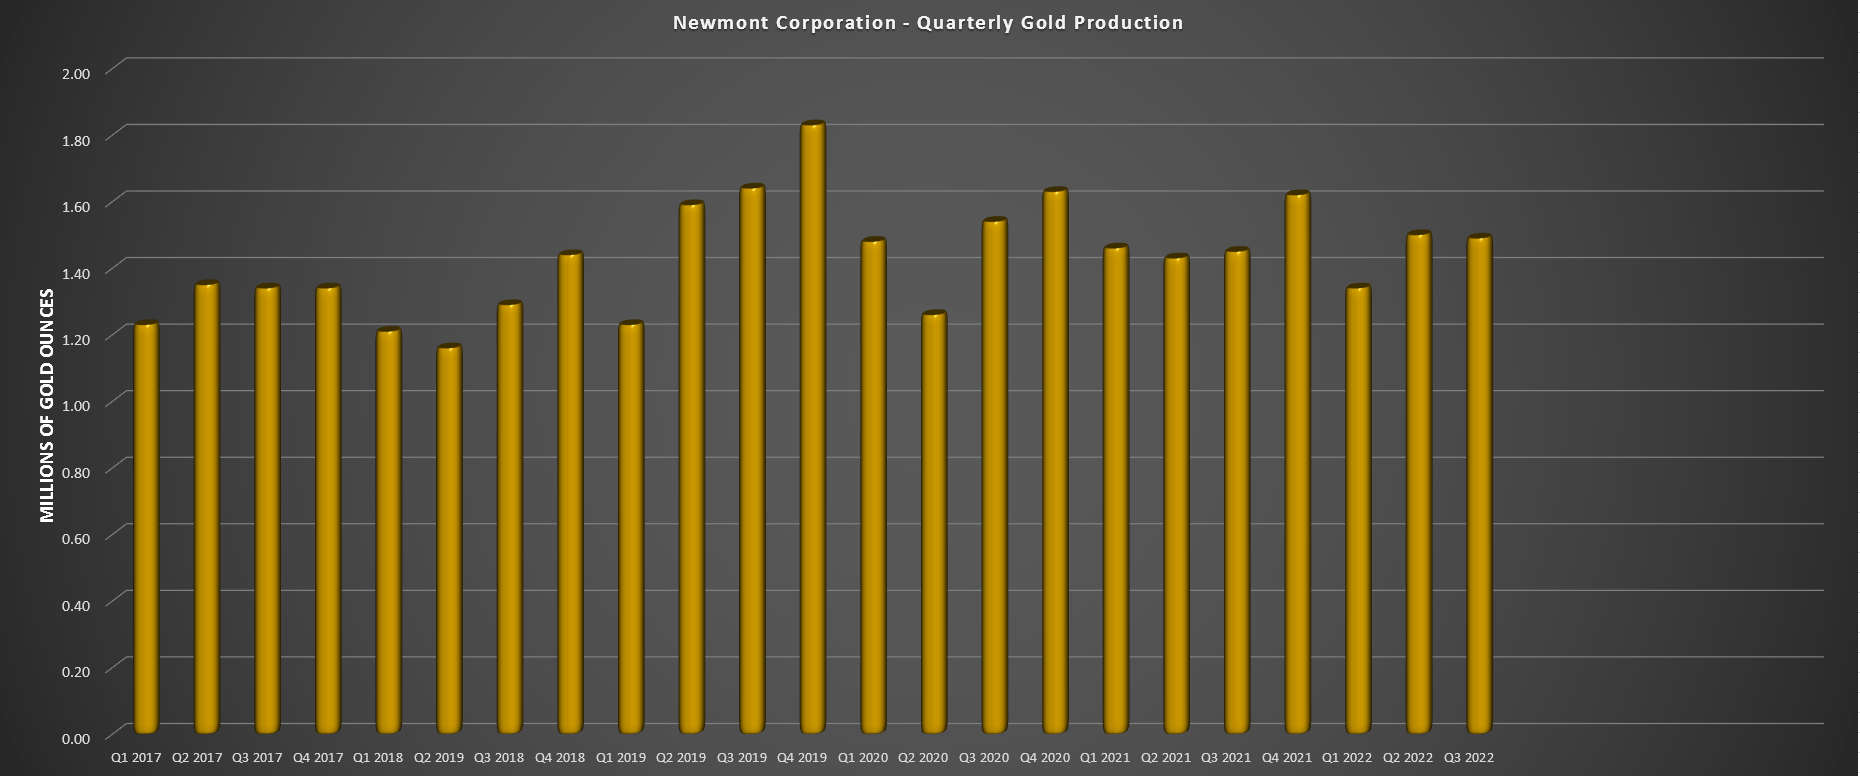
Newmont – Quarterly Gold Production (Company Filings, Author’s Chart)
At Newmont’s massive Boddington Mine, production increased by 7% due to higher grades. However, this was partially offset by lower throughput (crushed/conveyor maintenance), heavy rainfall, and network outages that impacted the autonomous haul fleet. At Tanami, production was up 9% due to higher mill throughput offset by a build-up of in-circuit inventory compared to a drawdown in the prior year. Newmont noted that the lining of the shaft had commenced, which will take approximately two years, and underground development work is largely completed. The 1,500-meter shaft will boost production, extend the mine life into the 2040s and provide meaningful cost improvements.
Finally, in Canada, gold production came in at ~175,000 ounces combined, a 6% improvement from ~165,000 ounces in the year-ago period. The mid-single-digit increase was driven by improved productivity and higher grades. Notably, staffing levels have improved despite the tight labor market in prolific mining jurisdictions. All of the assets have a strong Q4 ahead, with PQ Deeps being mined at Musselwhite, increased mining flexibility at Eleonore, and much higher grades at Hoyle Pond in Q4 (Porcupine) plus higher mill availability with work on the primary crusher moved into 2023 vs. Q4 previously. Lastly, Penasquito had a very solid quarter in Mexico, producing ~182,000 ounces, beating out difficult comps in Q3 2021 (~173,000 ounces) with higher grades from the Penasco Pit.
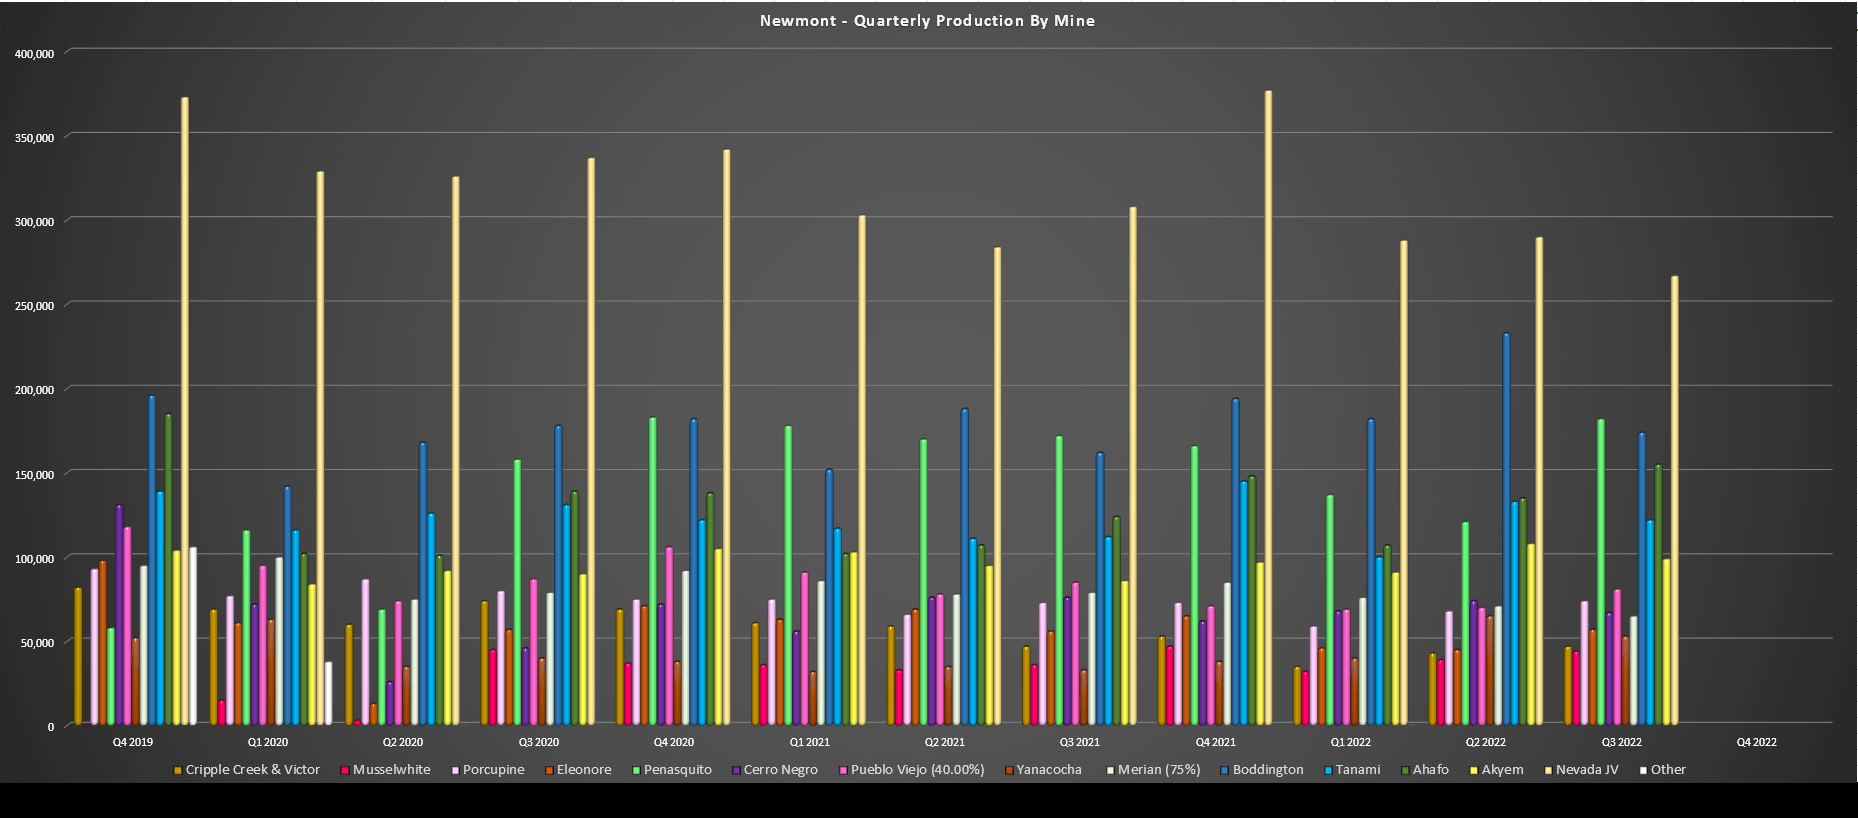
Newmont – Quarterly Production by Mine (Company Filings, Author’s Chart)
Unfortunately, the solid performance at most of its 100% owned assets was offset by lower production at Merian (heavy rain and mill shut), Cerro Negro (lower grades), and its Nevada joint venture with Barrick (GOLD), which contributed just ~267,000 ounces in Q3, down from ~308,000 ounces in the year-ago period. The good news is that this large contributor will have a much better Q4 with higher grades and tonnes mined at Carlin and Cortez, plus better autoclave performance at Turquoise Ridge. Notably, the future of this asset is very bright and should trend higher with higher production from Turquoise Ridge (third shaft) and the addition of the high-grade Goldrush orebody (7.0 million ounces at 7.3 grams per tonne gold) once it begins production in late 2023/early 2024.
Overall, this was a solid quarter for Newmont, given the headwinds, and investors can look forward to a strong finish to the year with higher production in Australia and North America, excluding Penasquito, where lower grades will be mined from the Chile Colorado Pit. So, Newmont remains on track to meet its guidance of 6.0 million ounces of attributable gold production and 1.3 million gold-equivalent ounces from copper, silver, lead, and zinc. Looking ahead to 2023, we should see a slight increase in production with a higher contribution from Nevada (shared operations) and its Canadian operations, plus its equity interest in Pueblo Viejo, where Barrick is working on completing a major expansion.
Financial Results
Unfortunately, while the production results were satisfactory, the financial results left a lot to be desired. Beginning with revenue, we saw a 9% decline to ~$2.63 billion, partially impacted by the delayed shipment of gold-bearing lead concentrate that will be sold in Q4 (impacted by earthquakes and heavy rain in Mexico) but mostly affected by lower metals prices. In fact, Newmont’s average realized gold price plunged nearly $150/oz in the quarter, declining from $1,836/oz to $1,691/oz. The combination of slightly lower sales volumes (delayed Penasquito shipment) and much lower metals prices dramatically impacted revenue and cash flow during the period.
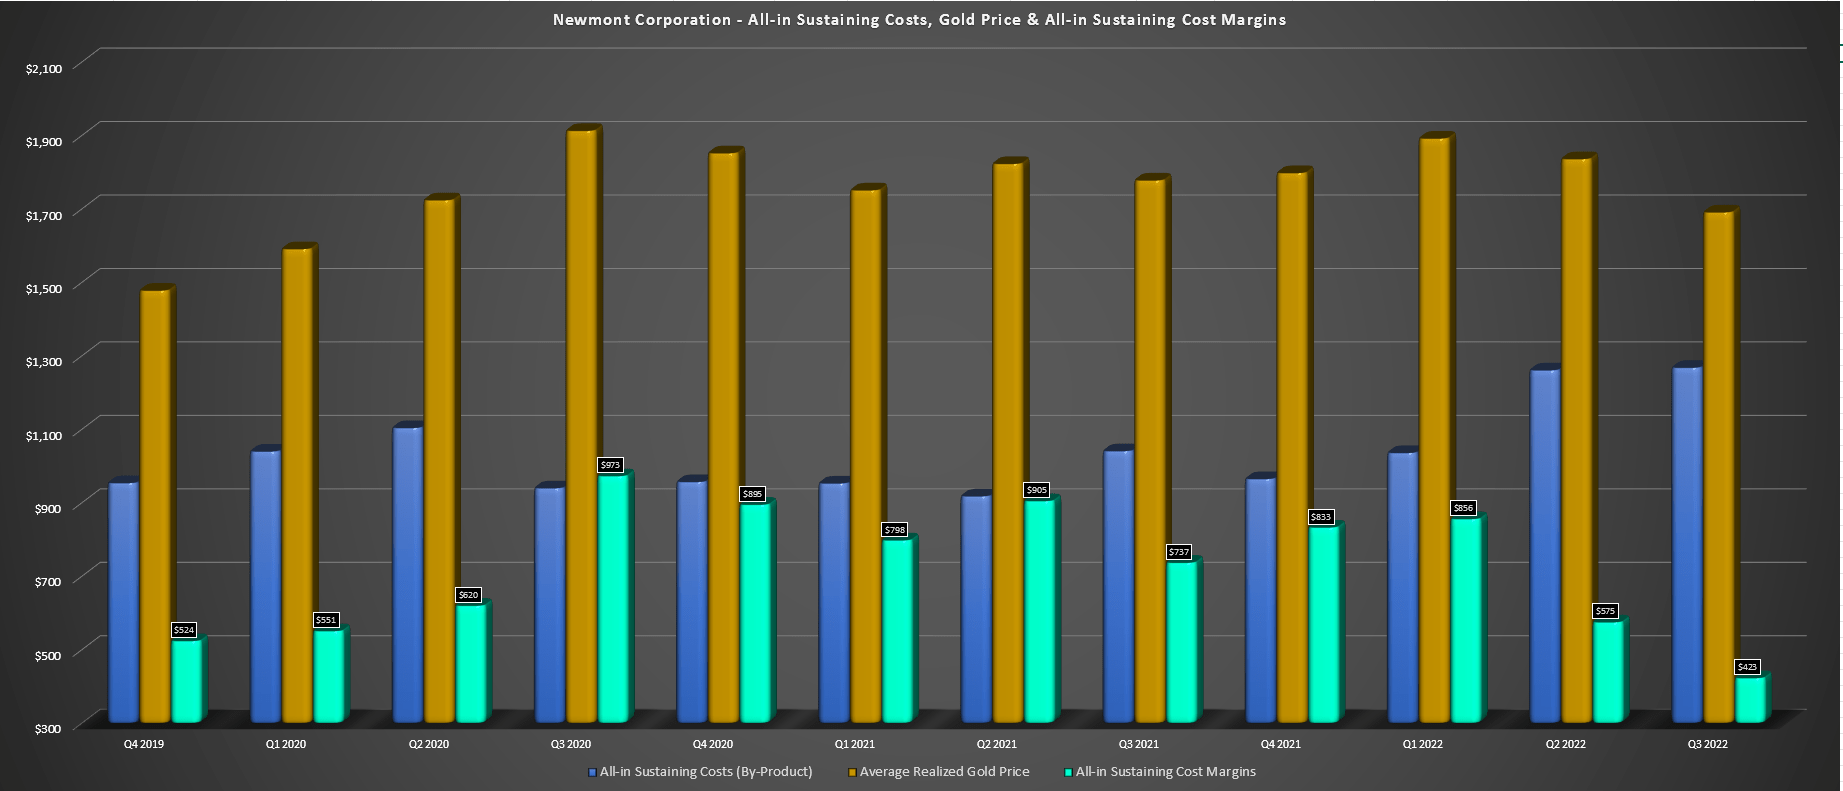
Newmont – All-in Sustaining Costs, Gold Price & AISC Margins (Company Filings, Author’s Chart)
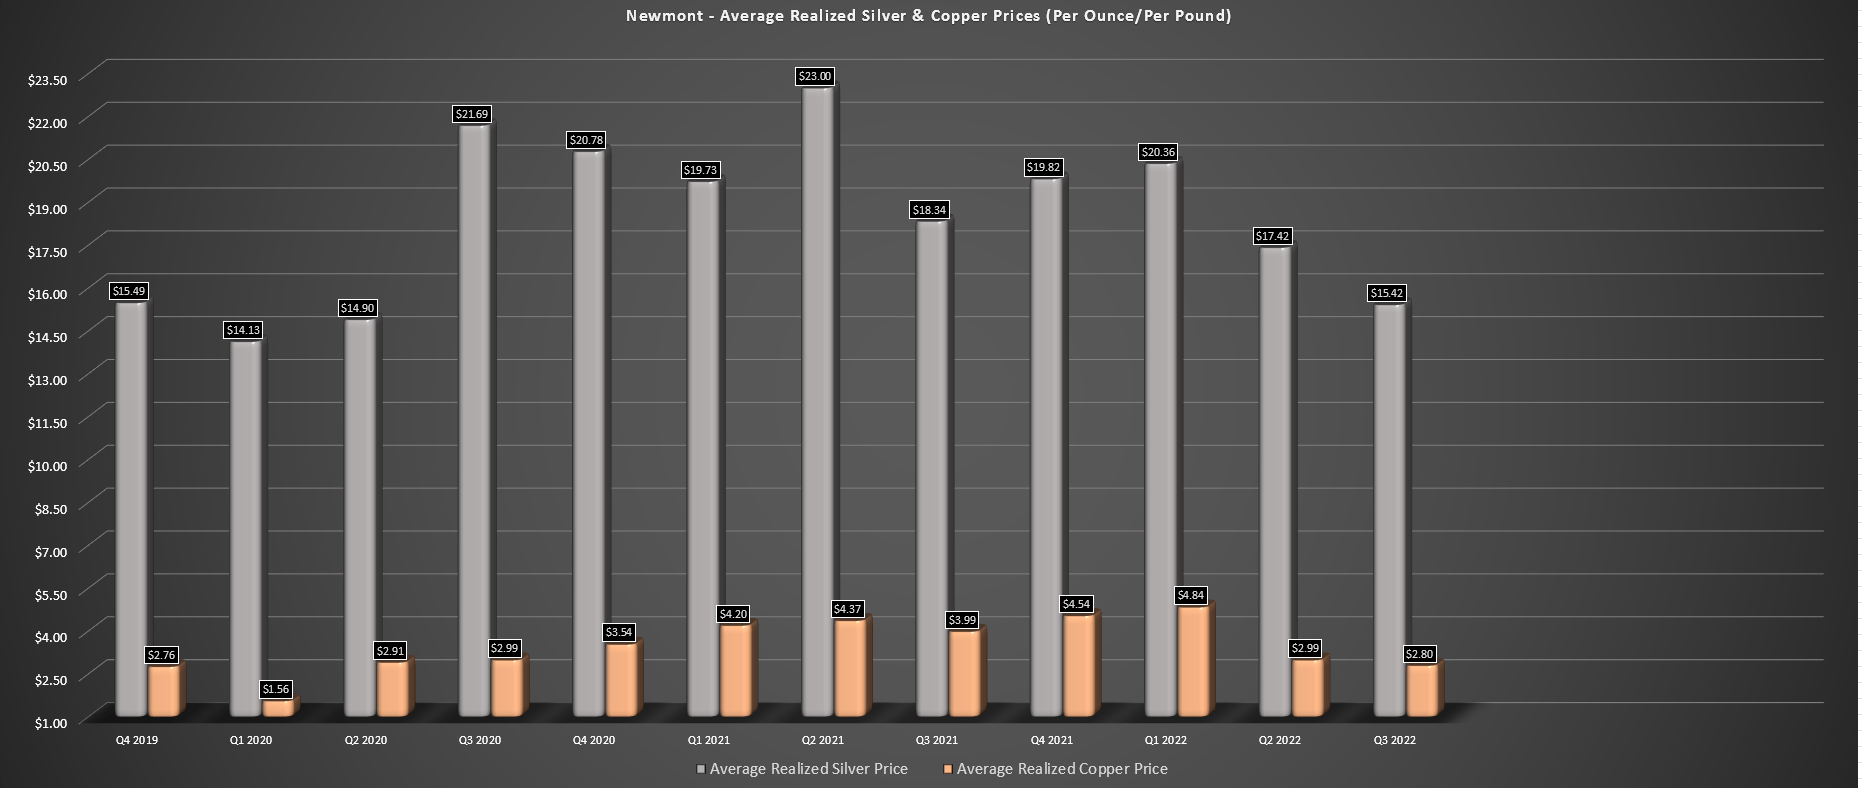
Newmont – Average Realized Metals Prices (Per Ounce/Pound) (Company Filings, Author’s Chart)
From a margin standpoint, Newmont’s margins also were pressured, with all-in-sustaining costs [AISC] for gold coming in at $1,271/oz vs. $1,120/oz in the year-ago period, with costs on a by-product basis also up due to declining metals prices (silver, copper, lead). This resulted in AISC margins declining from $737/oz to $423/oz on a by-product basis, while AISC margins for gold fell to $420/oz vs. $658/oz in the year-ago period. The result was that adjusted quarterly earnings per share fell over 50% to $0.27 (Q3 2021: $0.60), and free cash flow dipped into negative territory, dropping to an outflow of $63 million in Q3 2022.
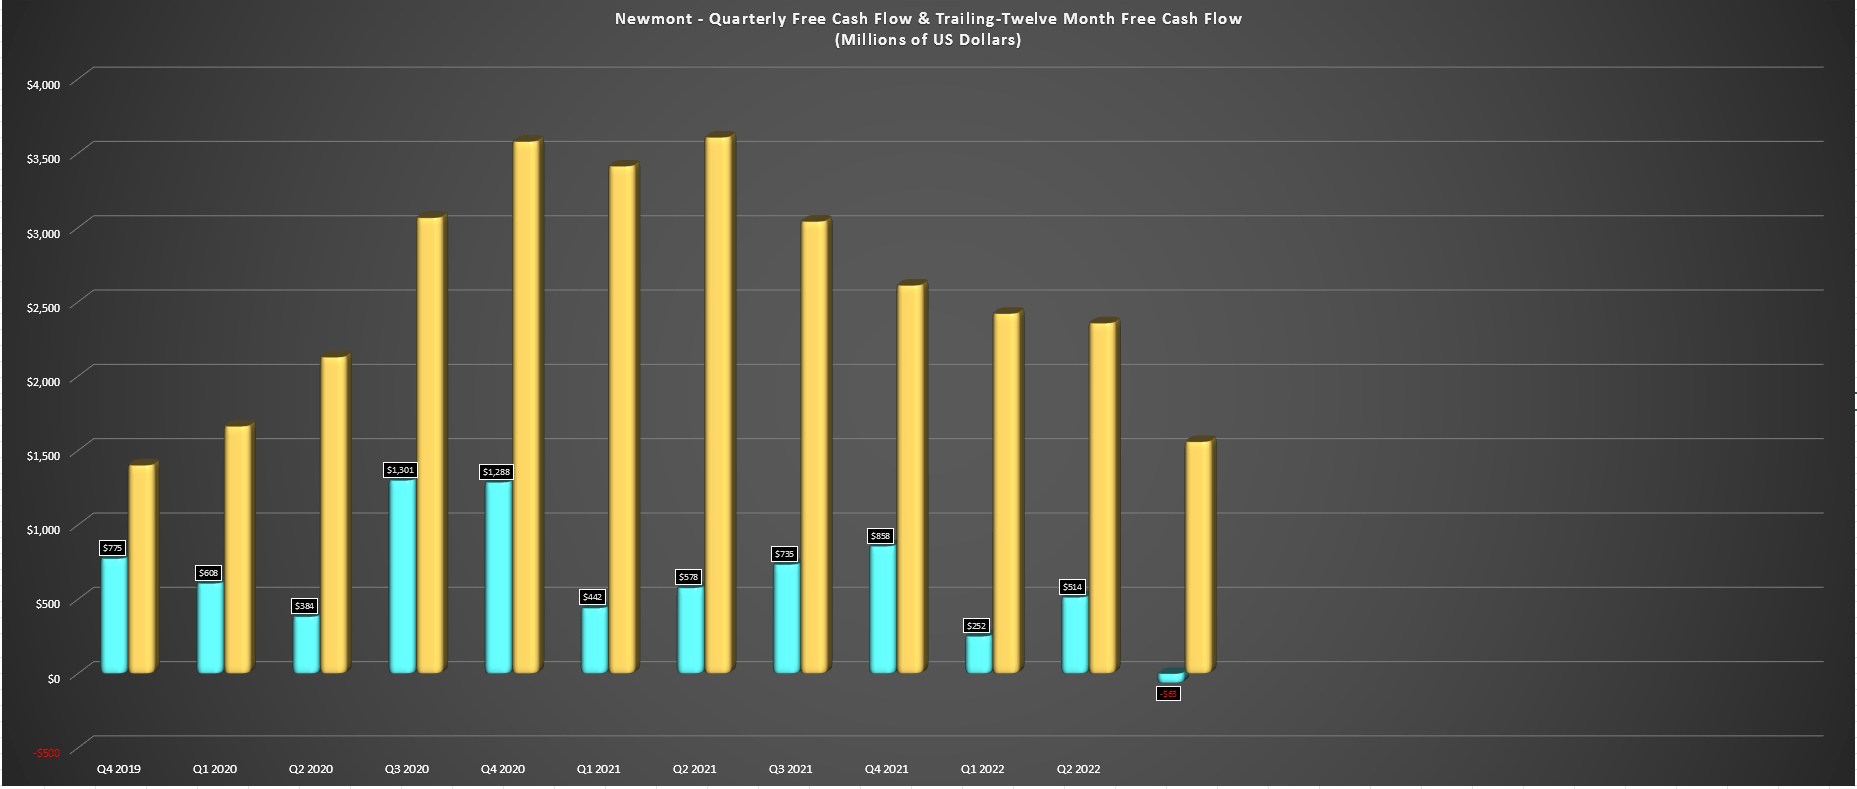
Newmont – Quarterly Free Cash Flow & Trailing Twelve-Month Free Cash Flow (Company Filings, Author’s Chart)
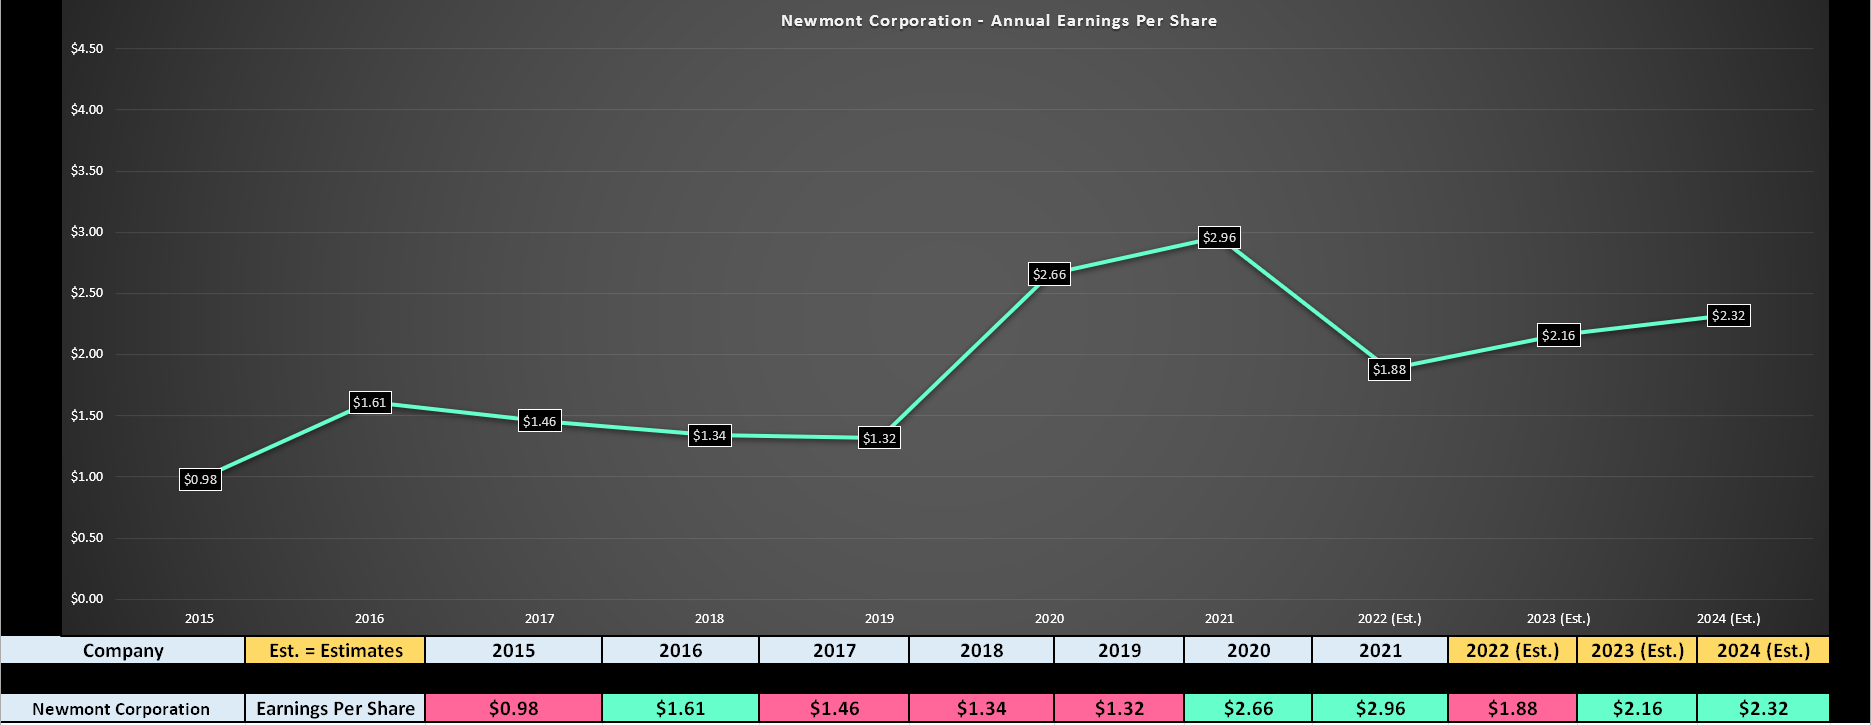
Newmont Earnings Trend & Forward Estimates (YCharts.com, FactSet, Author’s Chart & Estimates)
While this is certainly disappointing, it’s worth noting that capex was much higher in the period, which impacted free cash flow; the delayed shipment from Penasquito didn’t help ($80 million in revenue), and the company had a large profit-sharing payment in the period at Penasquito. So, on a constant capex basis to the previous year (capex was up 33% year-over-year due to higher spending on growth projects), free cash flow would have been positive.
One can choose to be pessimistic about these results. Still, it’s worth pointing out that Newmont and the rest of the industry appear to have seen peak costs in Q2/Q3 2022 and also dealt with a violent decline in the gold price and mark-to-market provisionally priced sales. Hence, this was another kitchen-sink quarter, and there’s no reason to extrapolate these quarterly results over future years. That said, annual EPS is set to decline materially year-over-year ($1.88 vs. $2.96) but will improve slightly in FY2023 and FY2024, assuming the gold price can stabilize and oscillate in the $1,650/oz to $1,800/oz range next year.
Dividend
Given the sharp decline in profitability due to lower metals prices and higher margins, my previous outlook that Newmont might only see a slight decrease in its dividend ($2.00 vs. $2.20 annualized) is looking like it could be incorrect. This is because while the dividend takes into account historical and projected gold prices over the long term (a year ahead or longer) to make assumptions on free cash flow that will be generated, the gold price isn’t getting up off the mat as quickly as I expected, as shown by the below chart. Hence, the backward-looking gold price is set to decline below $1,800/oz (six-month lookback), and the company remains in a heavy-capex period with pressure remaining on costs, even if it’s working to claw back lost margins and on initiatives to improve its cost profile.
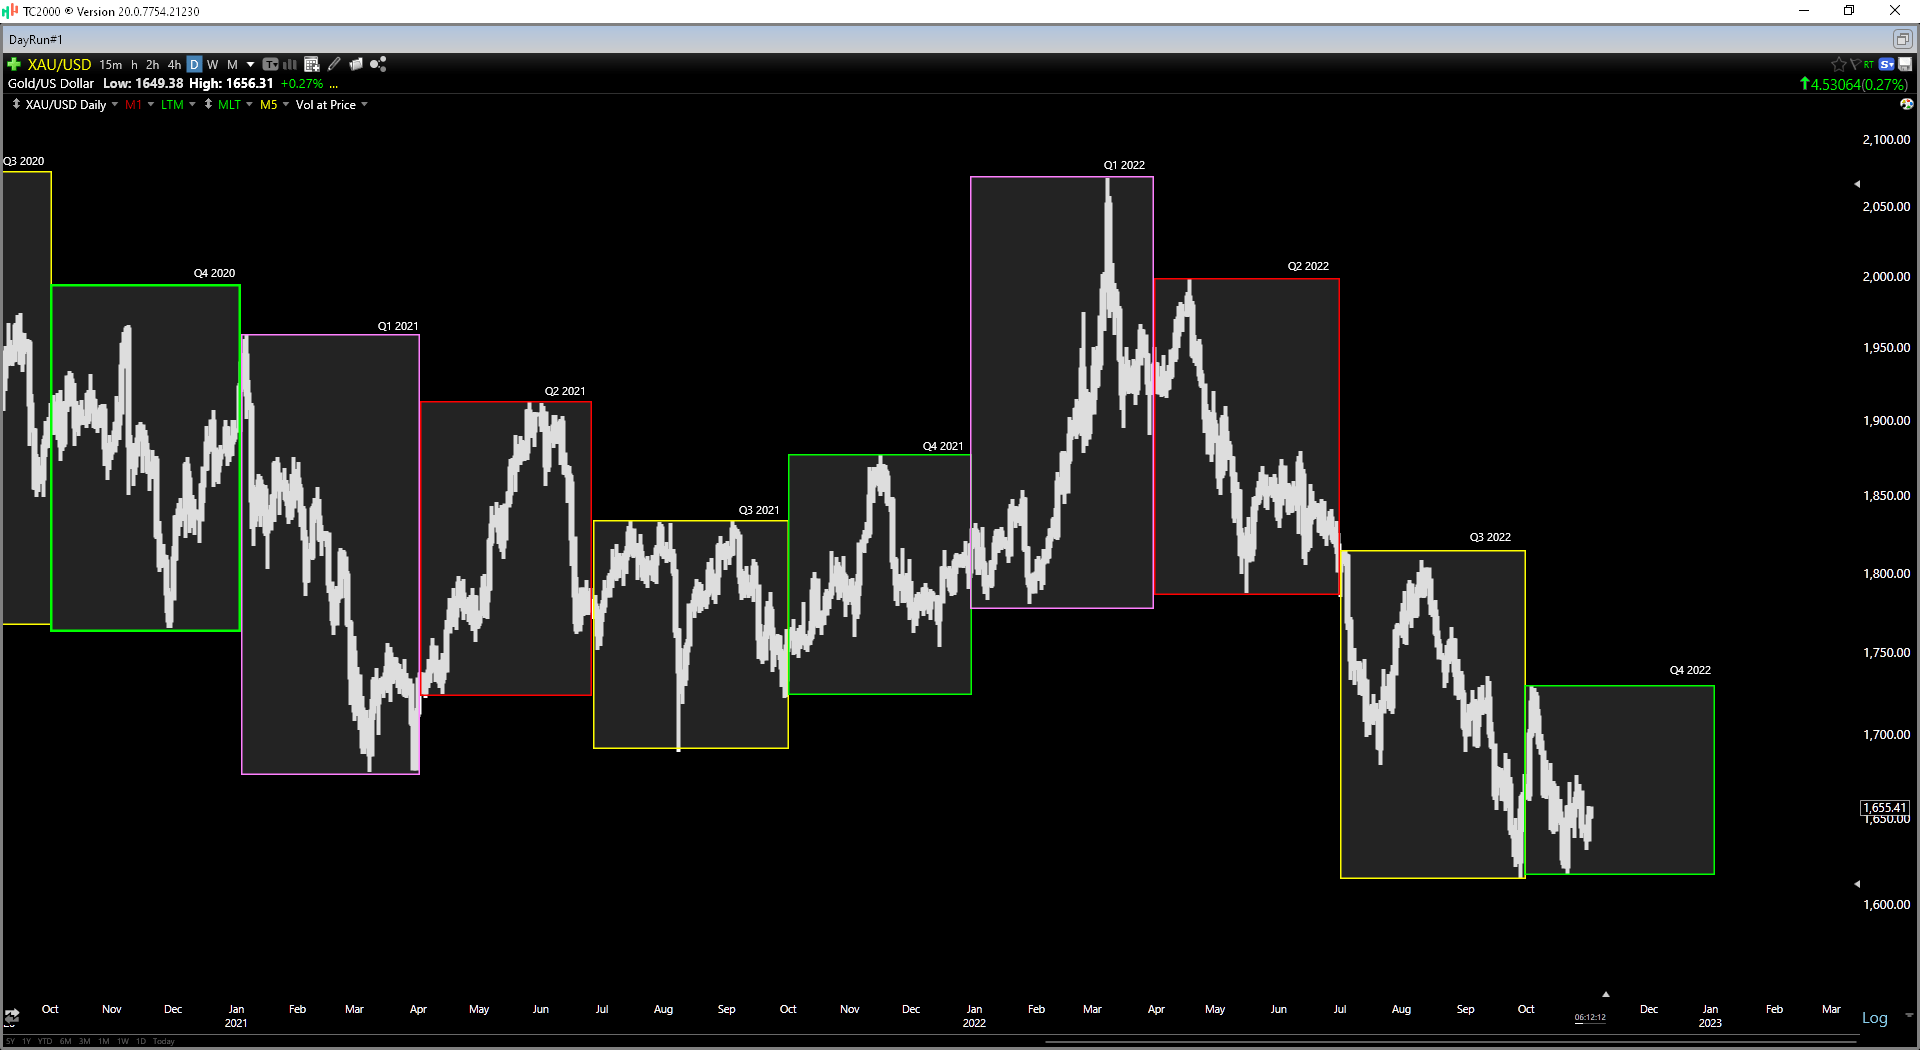
Gold Futures Price (TC2000.com)
It’s difficult to speculate on where the new annualized dividend will land without knowing Newmont’s future base gold price assumption (currently $1,200/oz gold but set to move higher), but it looks like a 10% to 25% dividend cut is possible at this point, suggesting an annualized dividend of $1.65 to $2.00. This would still represent a 4.1% dividend yield at the low end and among the highest industry-wide, and there’s an outside chance the dividend is held if gold prices start to recover immediately. However, it’s worth highlighting the risk and the fact that I appear wrong in my previous assumption of a “low to no dividend cut.” At quarter-end, Newmont had just $2.4 billion in net debt and $6.7 billion in liquidity.
All of that being said, we will find out more in the December 2022 update, and even if we do see a dividend cut, I see this as largely priced into the stock already at $41.00 per share.
Valuation and Technical Picture
Based on 794 million shares and a share price of $41.70, Newmont trades at a market cap of ~$33.1 billion. This leaves the stock trading at a slight premium to its estimated net asset value (1.01x P/NAV) and 19.3x FY2023 earnings estimates ($2.16). Historically, NEM stock has traded at ~23.8x earnings over the past 20 years and ~23.0x earnings over the past ten years, suggesting it’s trading below its historical multiple. That said, given the difficulties facing the sector (labor tightness, inflationary pressures on operating costs, and especially development projects) and the fact that NEM is in a capex-heavy period relative to peers, I believe a more conservative earnings multiple to be 22.3 (3% discount to 10-year average).
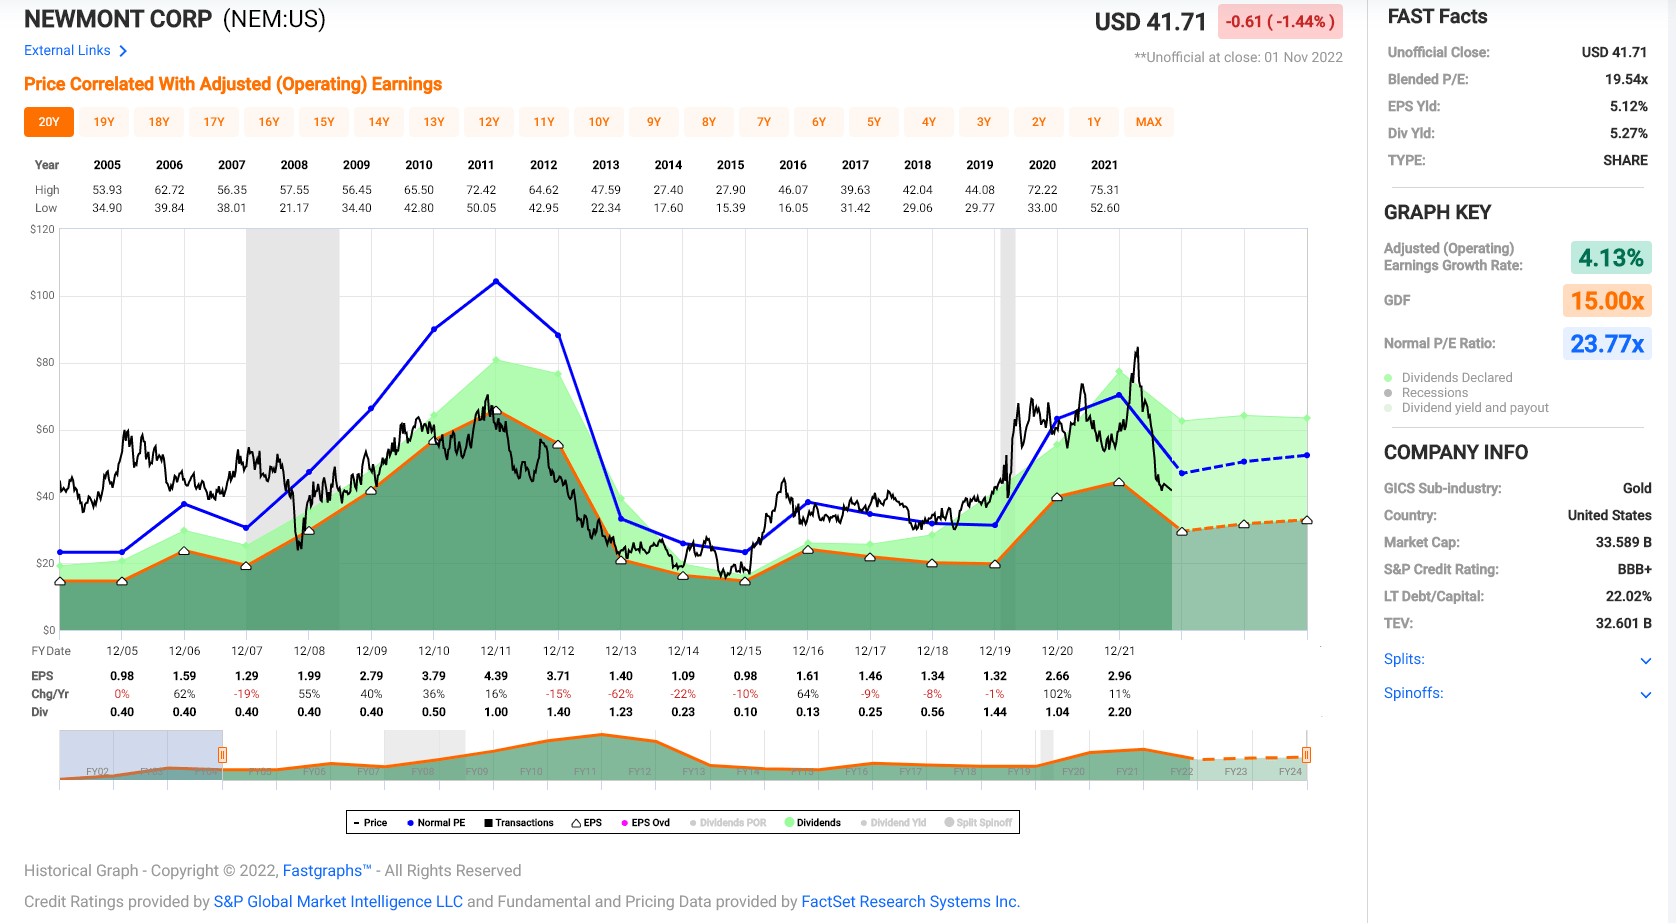
Newmont – Historical Earnings Multiple (FASTGraphs.com)
While this doesn’t point to much upside from current levels, the current earnings and cash flow profile do not capture the value of its vast project pipeline. From a P/NAV standpoint, I see a fair value for the stock of 1.50x vs. an estimated net asset value of $32.7 billion, translating to a fair value of $49.1 billion ($61.85 per share). So, after blending these two price targets with a 50/50 weighting, I see a fair value for Newmont of $55.00 per share. This price target suggests a 32% upside to fair value or closer to a 35% upside from a total return standpoint.
Importantly, this price target assumes gold prices remain under pressure and stay below $1,800/oz. While there are no guarantees, I would not be surprised to see a much better 18 months ahead for the gold price, given that it tends to bottom when it’s hated, and we’ve certainly reached that juncture. In fact, bullish sentiment for gold is sitting at its lowest level in years, evidenced by Daily Sentiment Index data. As we can see from the below chart, this has typically led to strong outperformance, with these periods of persistently extreme reading of pessimism setting up strong rallies. Past signals do not have to play out similarly, but I’m cautiously optimistic that we have much better days ahead for the gold price in 2023.
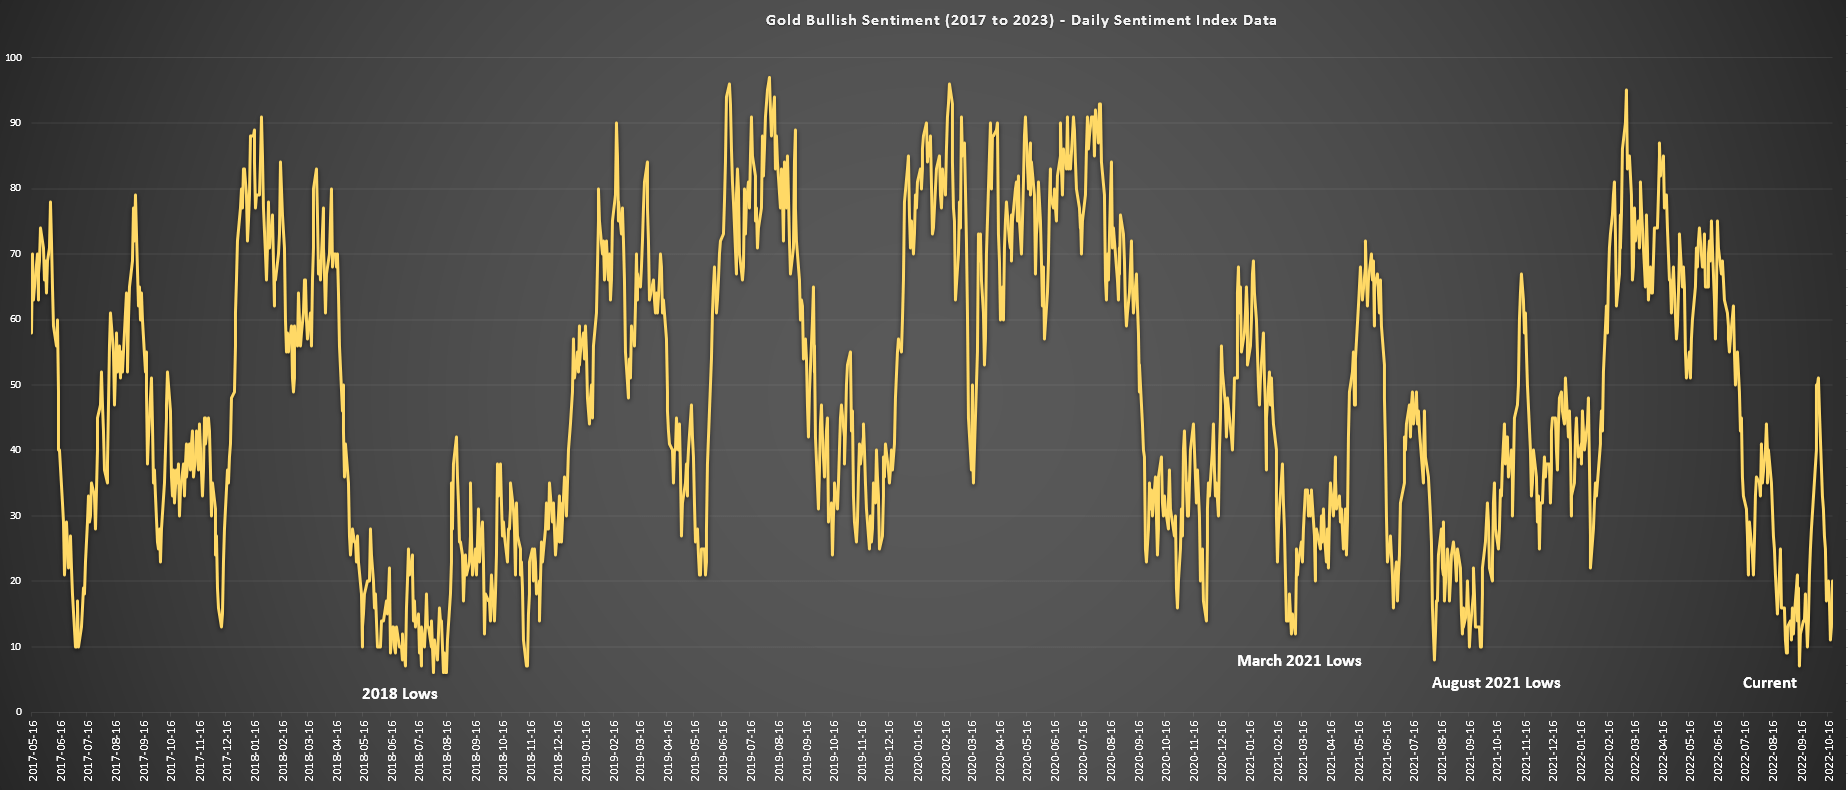
Gold – Bullish Sentiment (2017-2023) (Daily Sentiment Index Data, Author’s Chart)
Finally, if we look at the technical picture, I see a reason to be cautiously optimistic about Newmont here as well. As I pointed out in my previous article, Newmont has tended to hammer out important bottoms when the Newmont vs. S&P 500 (SPY) ratio has fallen below the green line (highlighted by yellow boxes). Not only has the stock hammered out bottoms, but the forward returns have been quite strong, with an average forward six-month draw-up of 45%. Like my discussion on the gold price, past performance doesn’t guarantee future returns, and every signal is different. Still, if Newmont were to perform similarly from the price of its current signal triggering ($44.00) last month, Newmont could touch $58.00 by April 2023.
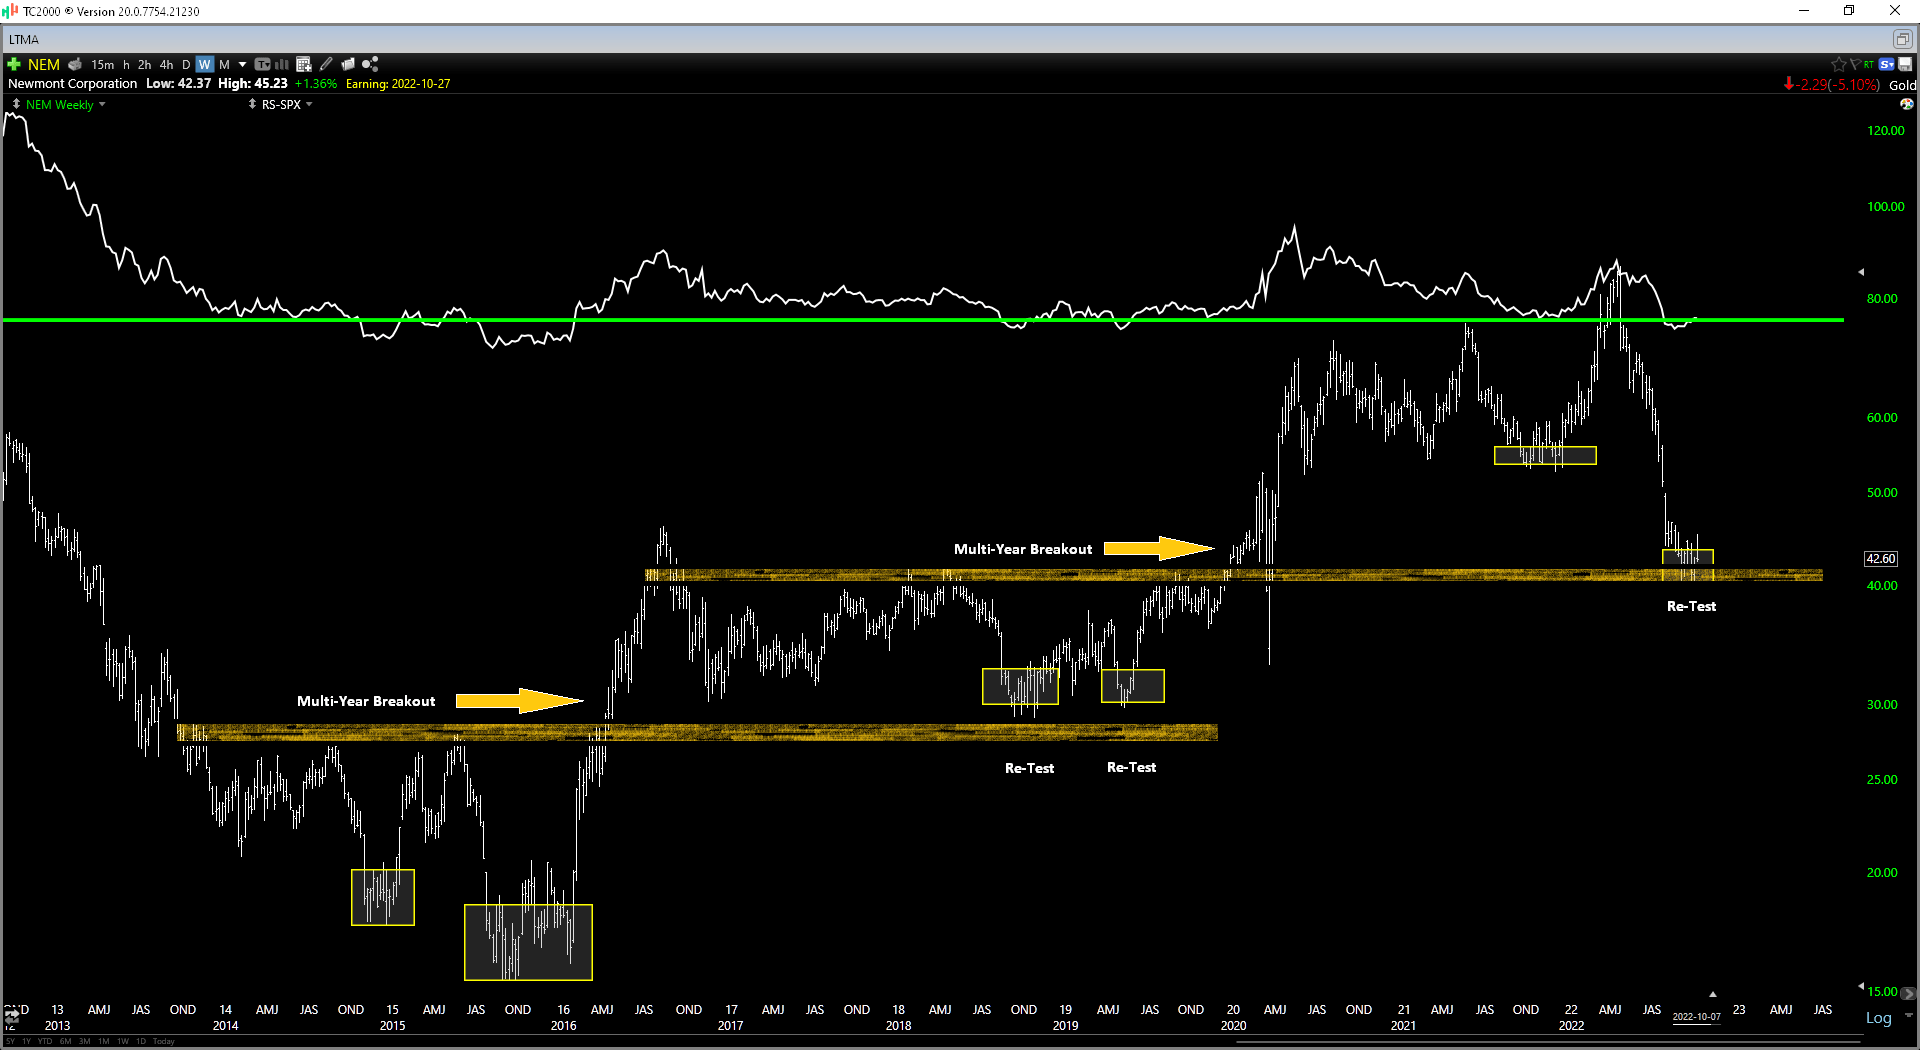
Newmont vs. S&P-500 Ratio (TC2000.com)
Finally, it’s worth noting that Newmont has pulled back to a major support level at $39.00 – $4. This is a similar setup to Newmont’s pullback in late 2018, also in a period of extremely negative sentiment for gold. At the time, the consensus was bearish at precisely the wrong time, with Newmont sitting at a critical juncture, back-testing a major support level (shown by the shaded gold area). The stock rallied 75% over the next 18 months, and this back-test proved to be a great contrarian buying opportunity. The current setup looks quite similar, with Newmont back-testing a similar support level and sentiment arguably worse with fears of a dividend cut and another year of relatively weak margins.
These worries can’t be ruled out, but from a technical and fundamental standpoint, I would argue that a lot of negativity looks priced in, just as it was in Q3 2018, which proved to be a great time to accumulate the stock on weakness. This would be equivalent to building a position in Newmont from $35.00 to $40.00 at today’s prices.
Summary
There’s no sugar-coating that Newmont has had a tough year with the rest of the industry, and while Barrick will benefit from lower costs next year as sustaining capex should dip materially at the same time as production increases, Newmont isn’t in the same boat. That said, this is still a very profitable business, even at $1,650/oz gold prices, and the company is actively working to claw back lost margins through several initiatives while staying true to its discipline, a refreshing change from what we saw in the last cycle. Given this discipline to stagger growth capex, not chase over-priced companies from an M&A standpoint, and the negativity surrounding stock which has helped to form bottoms in the past, I would view any pullbacks below $39.75 as buying opportunities.
Be the first to comment