

brightstars
By Levi at Stockwaves, produced with Avi Gilburt
The bottom is in for gold. That is obviously a definitive statement. For those that are familiar with our analysis methodology, you know that we view the markets from a probabilistic standpoint. So, what this means for us is that our primary scenario is that metals have seen an important low and have begun a new uptrend. However, we also have an alternative scenario that we monitor so as to tell us when our primary expectation must be adjusted or even abandoned. Let’s dive right into both the fundamental and technical analysis.
Lyn Alden recently provided these comments regarding the dollar and gold. “The dollar index has been in a downtrend recently, breaking its 2022 upward momentum on the weekly chart. The recent inflation print strongly contributed to this. If inflation begins falling, the Fed is more likely to slow down its interest rate hikes, and so the market begins expecting a slightly less hawkish Fed, and thus a weaker dollar.”
“A number of assets rallied on recent CPI weakness and dollar weakness. The Nasdaq had one of its best days this year, and gold rallied sharply. That’s a notable momentum shift for gold, and something to be aware of to see if it sustains that trend-change or not. My base case for the moment is that the gold bottom is in.”
“The way I would describe this is that we are likely reaching peak Fed hawkishness in rate-of-change terms, even though high absolute hawkishness (higher interest rates and ongoing balance sheet reduction) is still going to occur. In other words, the Fed might have one more 75 basis point hike and then shift to smaller hikes, or it might step down to a 50 basis point increase in the next meeting.”
The Dollar
There are times when the dollar and metals are indeed inversely correlated. And, there are other times that we can point to where they actually trade side by side, both up and down. So while we cannot state with certainty that there is an unconditional lock-step counter correlation between the dollar and metals, we could direct attention to that fact that they do trade inversely more often than not. That in and of itself is not something on which we would base a metals position. It would though be a data point worth watching.
With that in mind, one scenario that we are currently tracking in the dollar is the possibility that it has indeed found a major high. Note the long-term chart shown below.
TradingView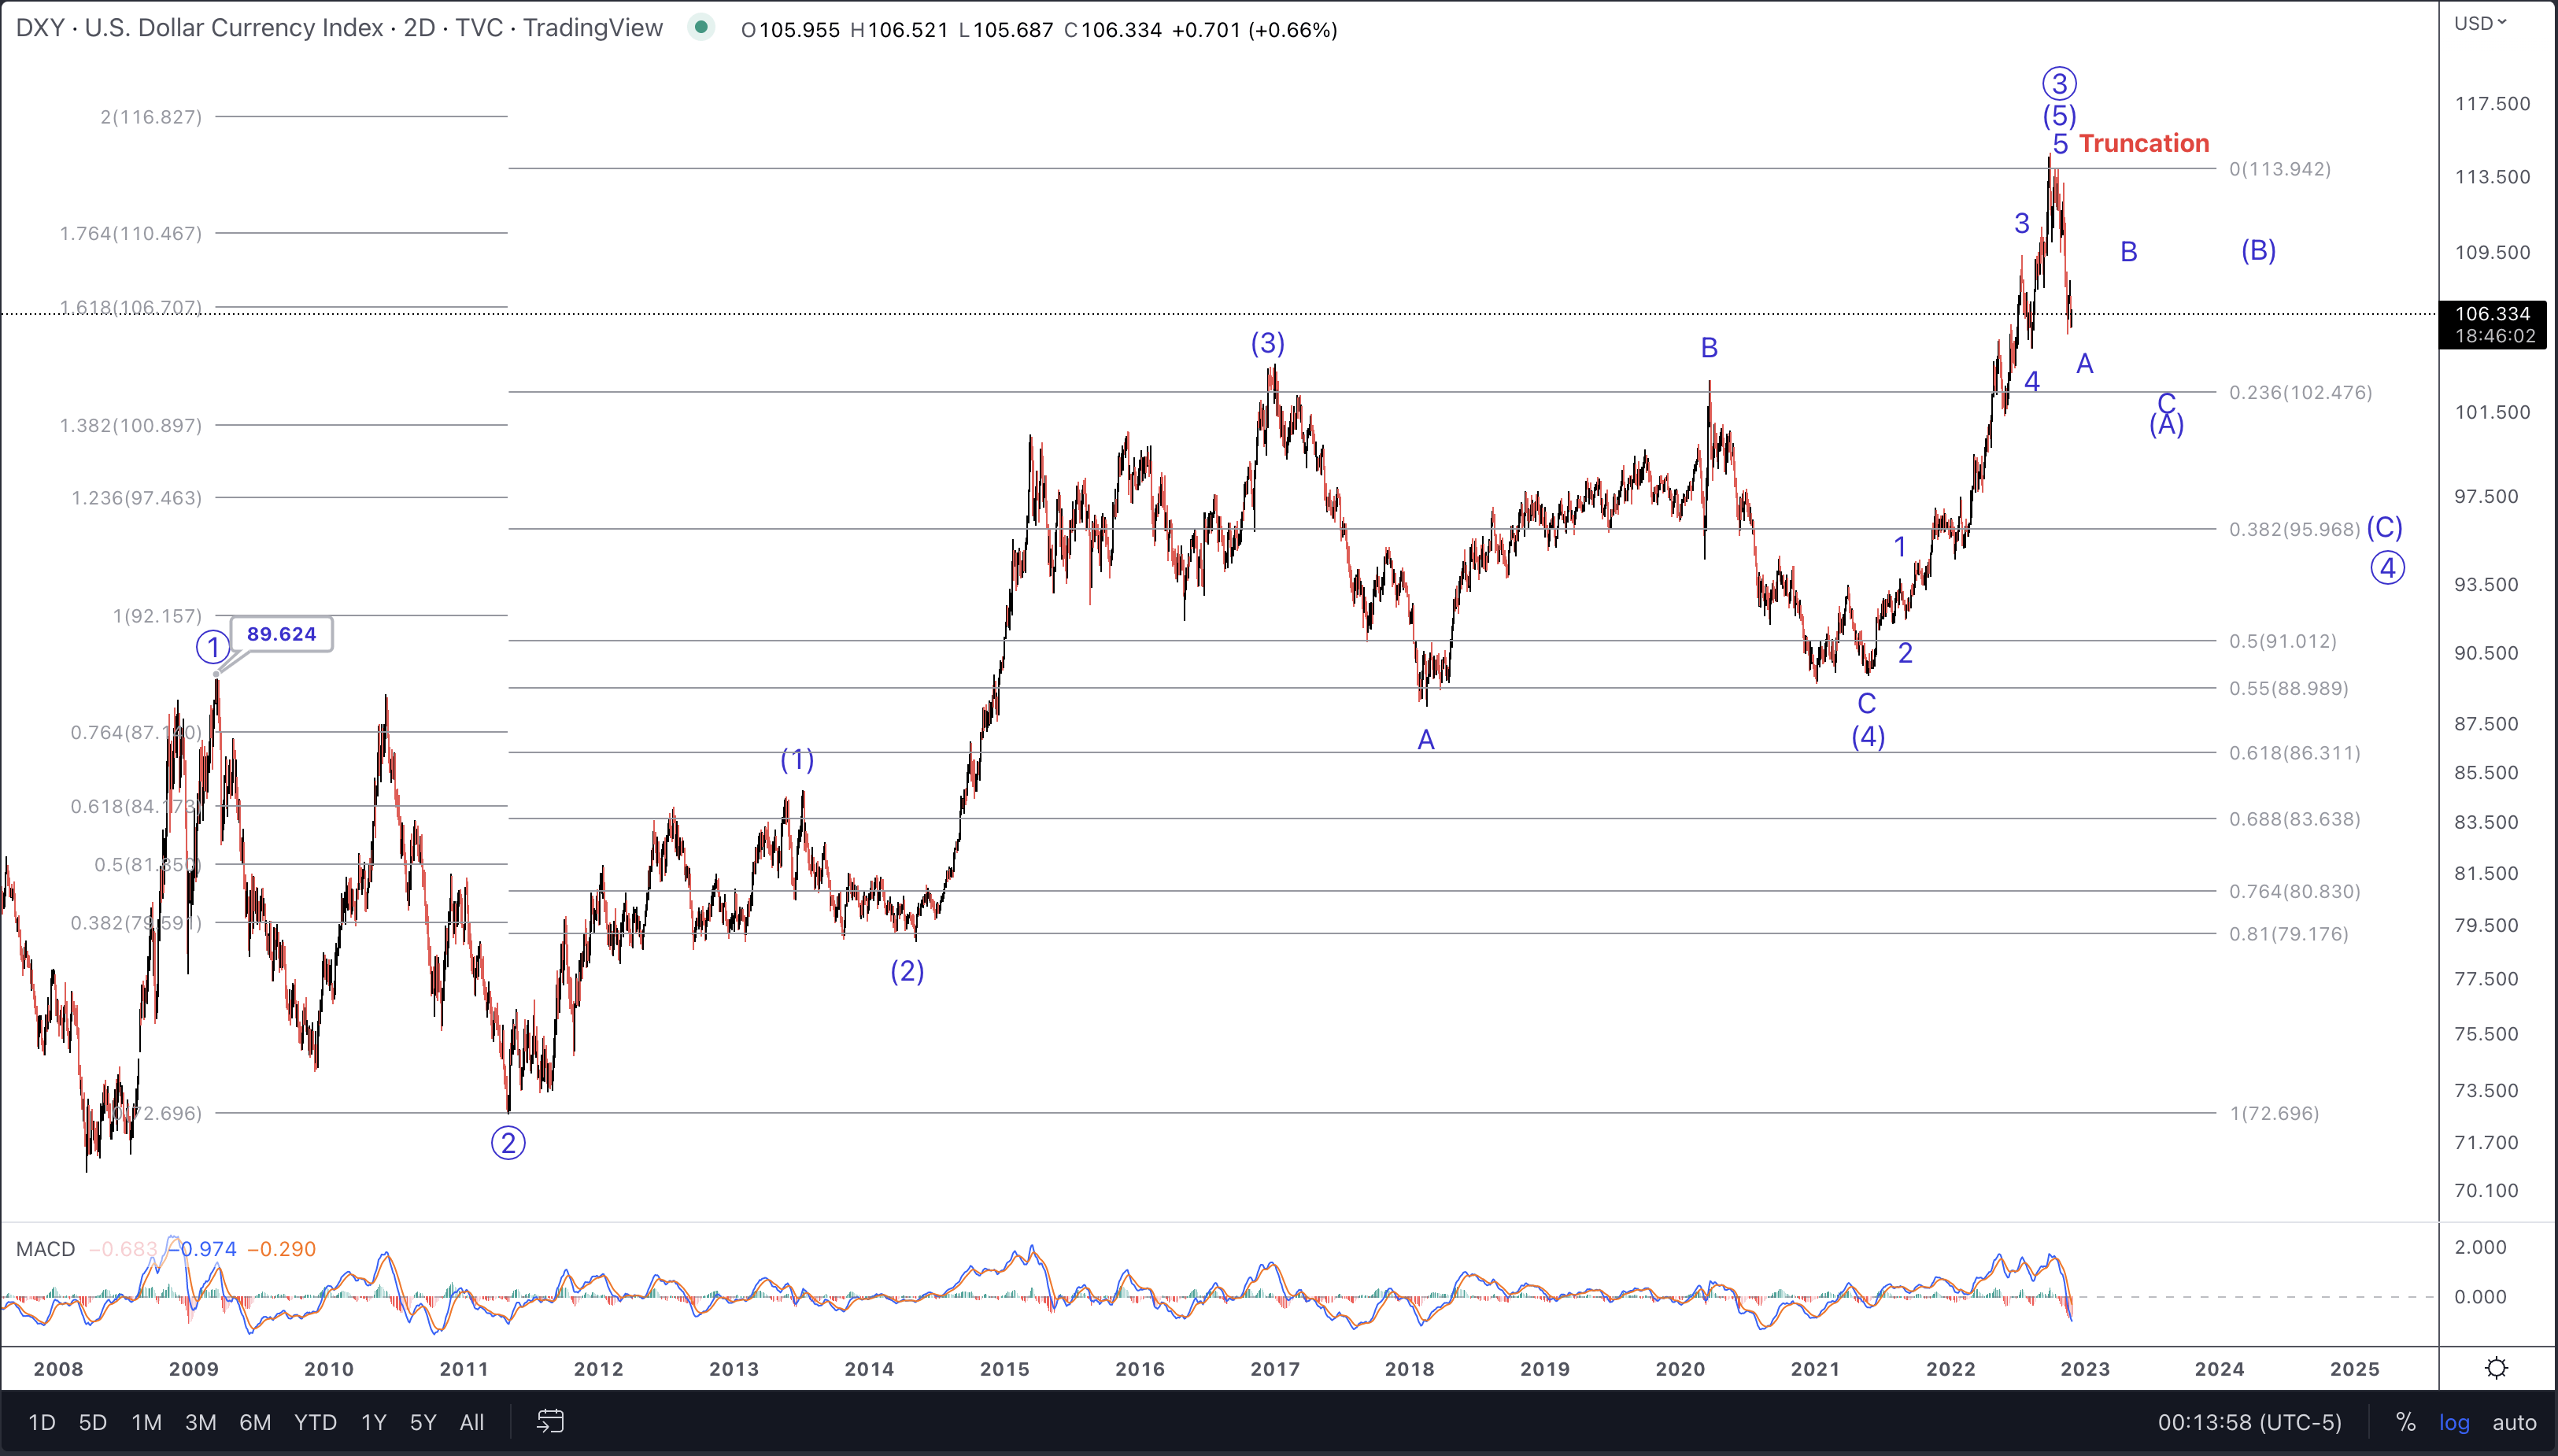
Gold and GLD
Obviously this is the ultimate driver of Newmont’s (NYSE:NEM) business. With NEM, we look at this as best-in-class. If the low for gold is indeed already in place, where might this head to next? And, what would the reciprocal effects be for the head of the class, NEM?
TradingView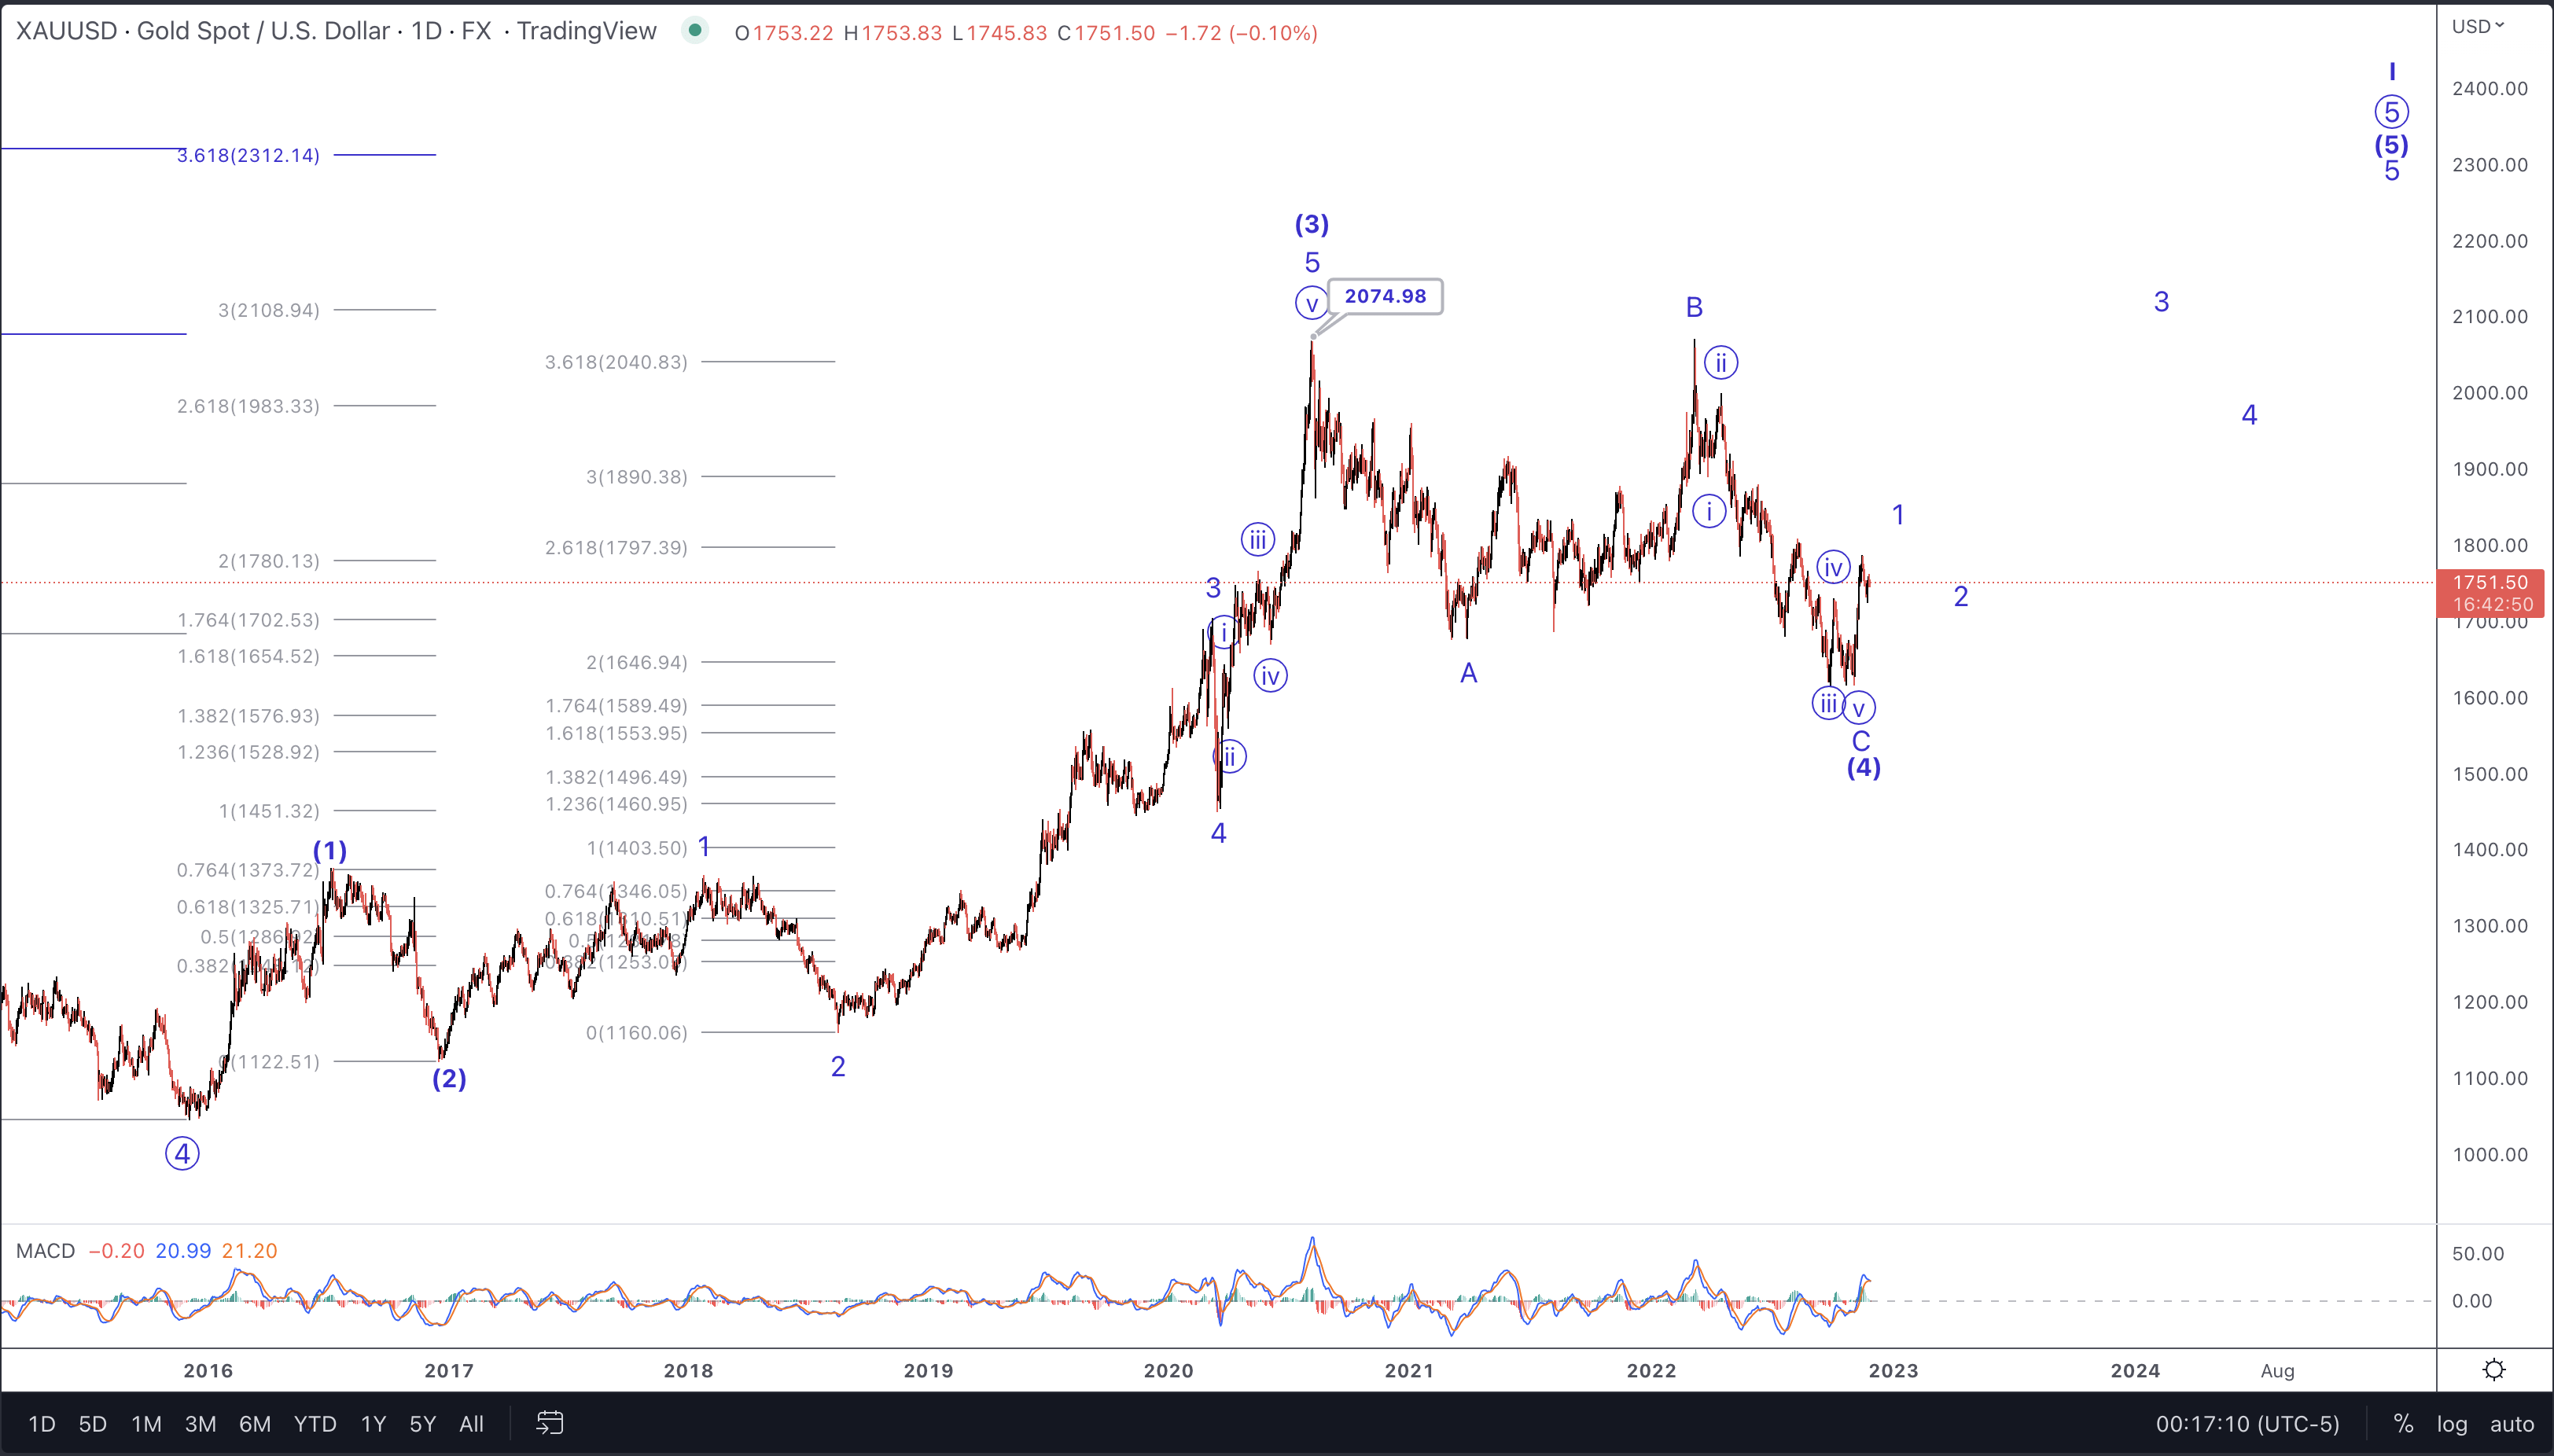
Currently, we are tracking 3 waves up for gold, and silver for that matter. In the scenario shown in this gold chart, that means that one more micro high is needed to produce an initial 5 waves up from the low struck on November 3rd. Once that first 5 waves up is in place, then we will look for a 3 wave corrective pullback. That will then allow us to set our market pivot which will first serve as resistance and then, in a bullish breakout, support thereafter [some may choose to play this move via GLD or another ETF that tracks gold].
NEM
Back in late 2015 in our trading room, Avi Gilburt made it no secret that he was turning quite bullish on the metals complex. In fact, NEM turned out to be a favorite pick at that time. He, and many of our members, rode those long positions from that time until the spring of 2022. What happened in the analysis that pointed to the upside nearing completion for NEM?
Note this attached chart and the structure of price as it filled out from that low near $15 in 2015 all the way until the high of $86.
TradeStation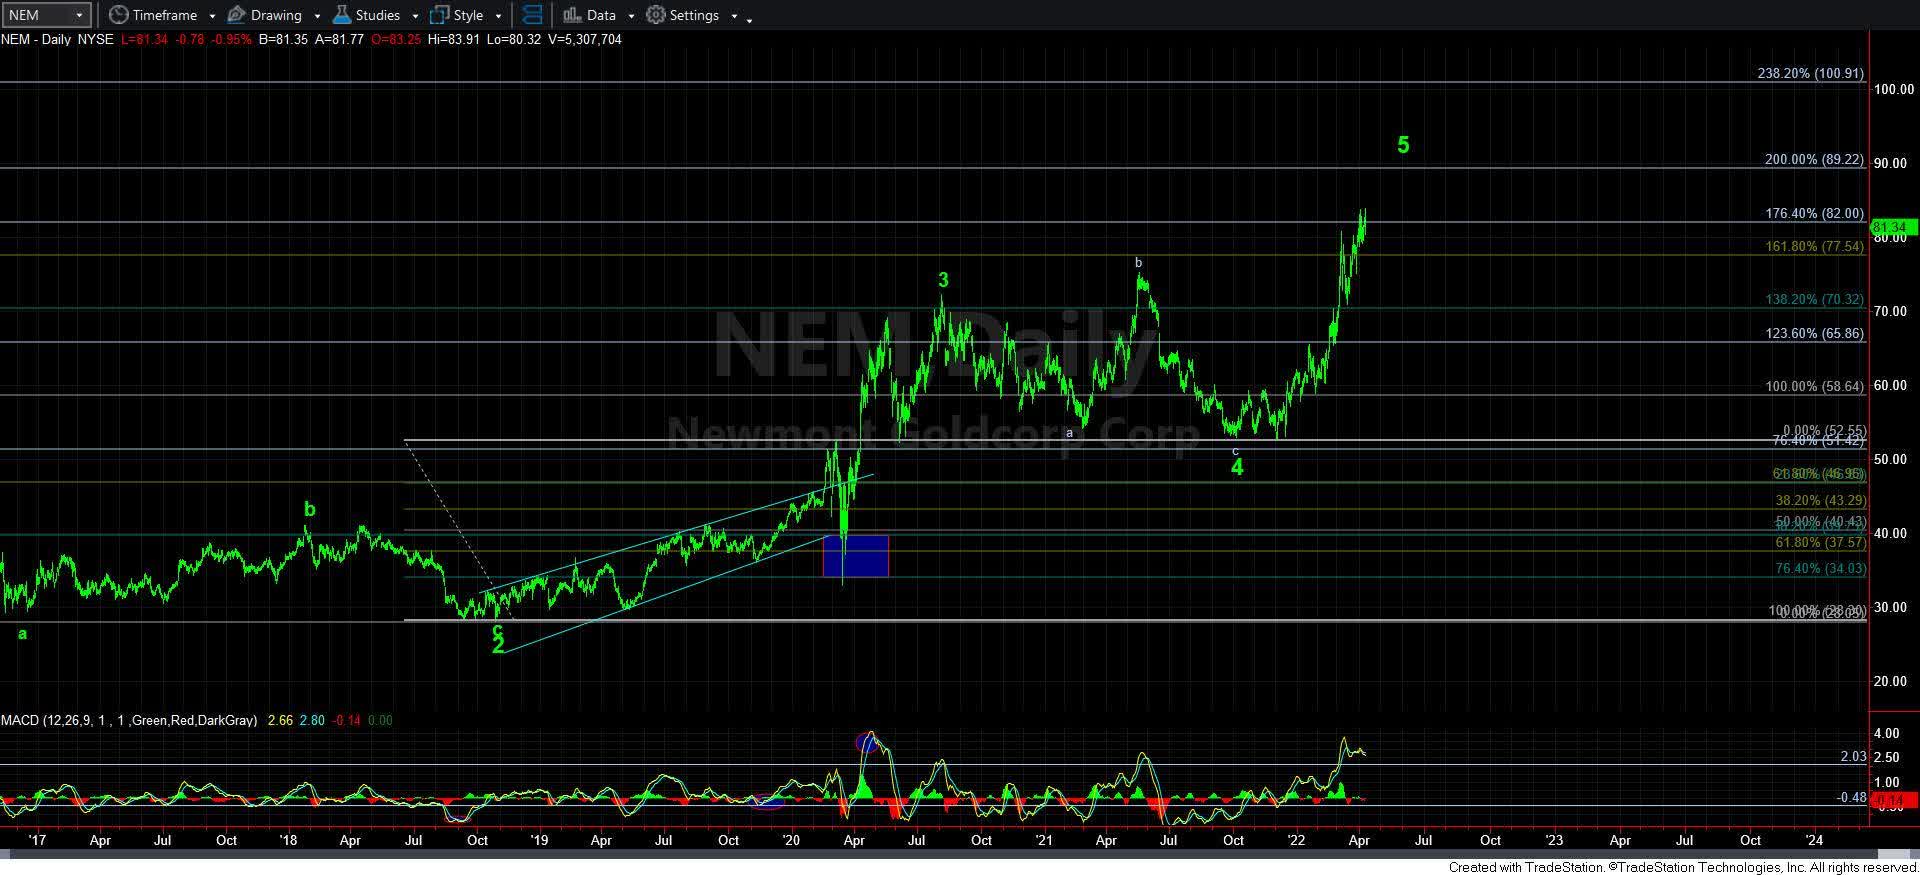
Please allow me to share what Avi wrote to our membership on April 11, 2022:
“I know this may come as a shock, and I am doing it based upon a number of factors. But, I think I am going to start harvesting some of my profits from NEM for the first time since I bought it in 2015. It is now more than 4X the price that I bought it at. And, it is filling in a structure that CAN present a top. In fact, this was my target years ago to begin to take profits, so I am just sticking with my plan.”
Now, let’s fast-forward to the possible scenario we are tracking that has gold as having bottomed. Gold may indeed strike a new high in price above its prior high at $2,075 XAUUSD. However, our view in NEM is that the next rally may retrace much of this decline from the $86 high to the recent low at $37, but it may not strike a new high in price. This would instead track as a ‘B’ wave bounce.
TradingView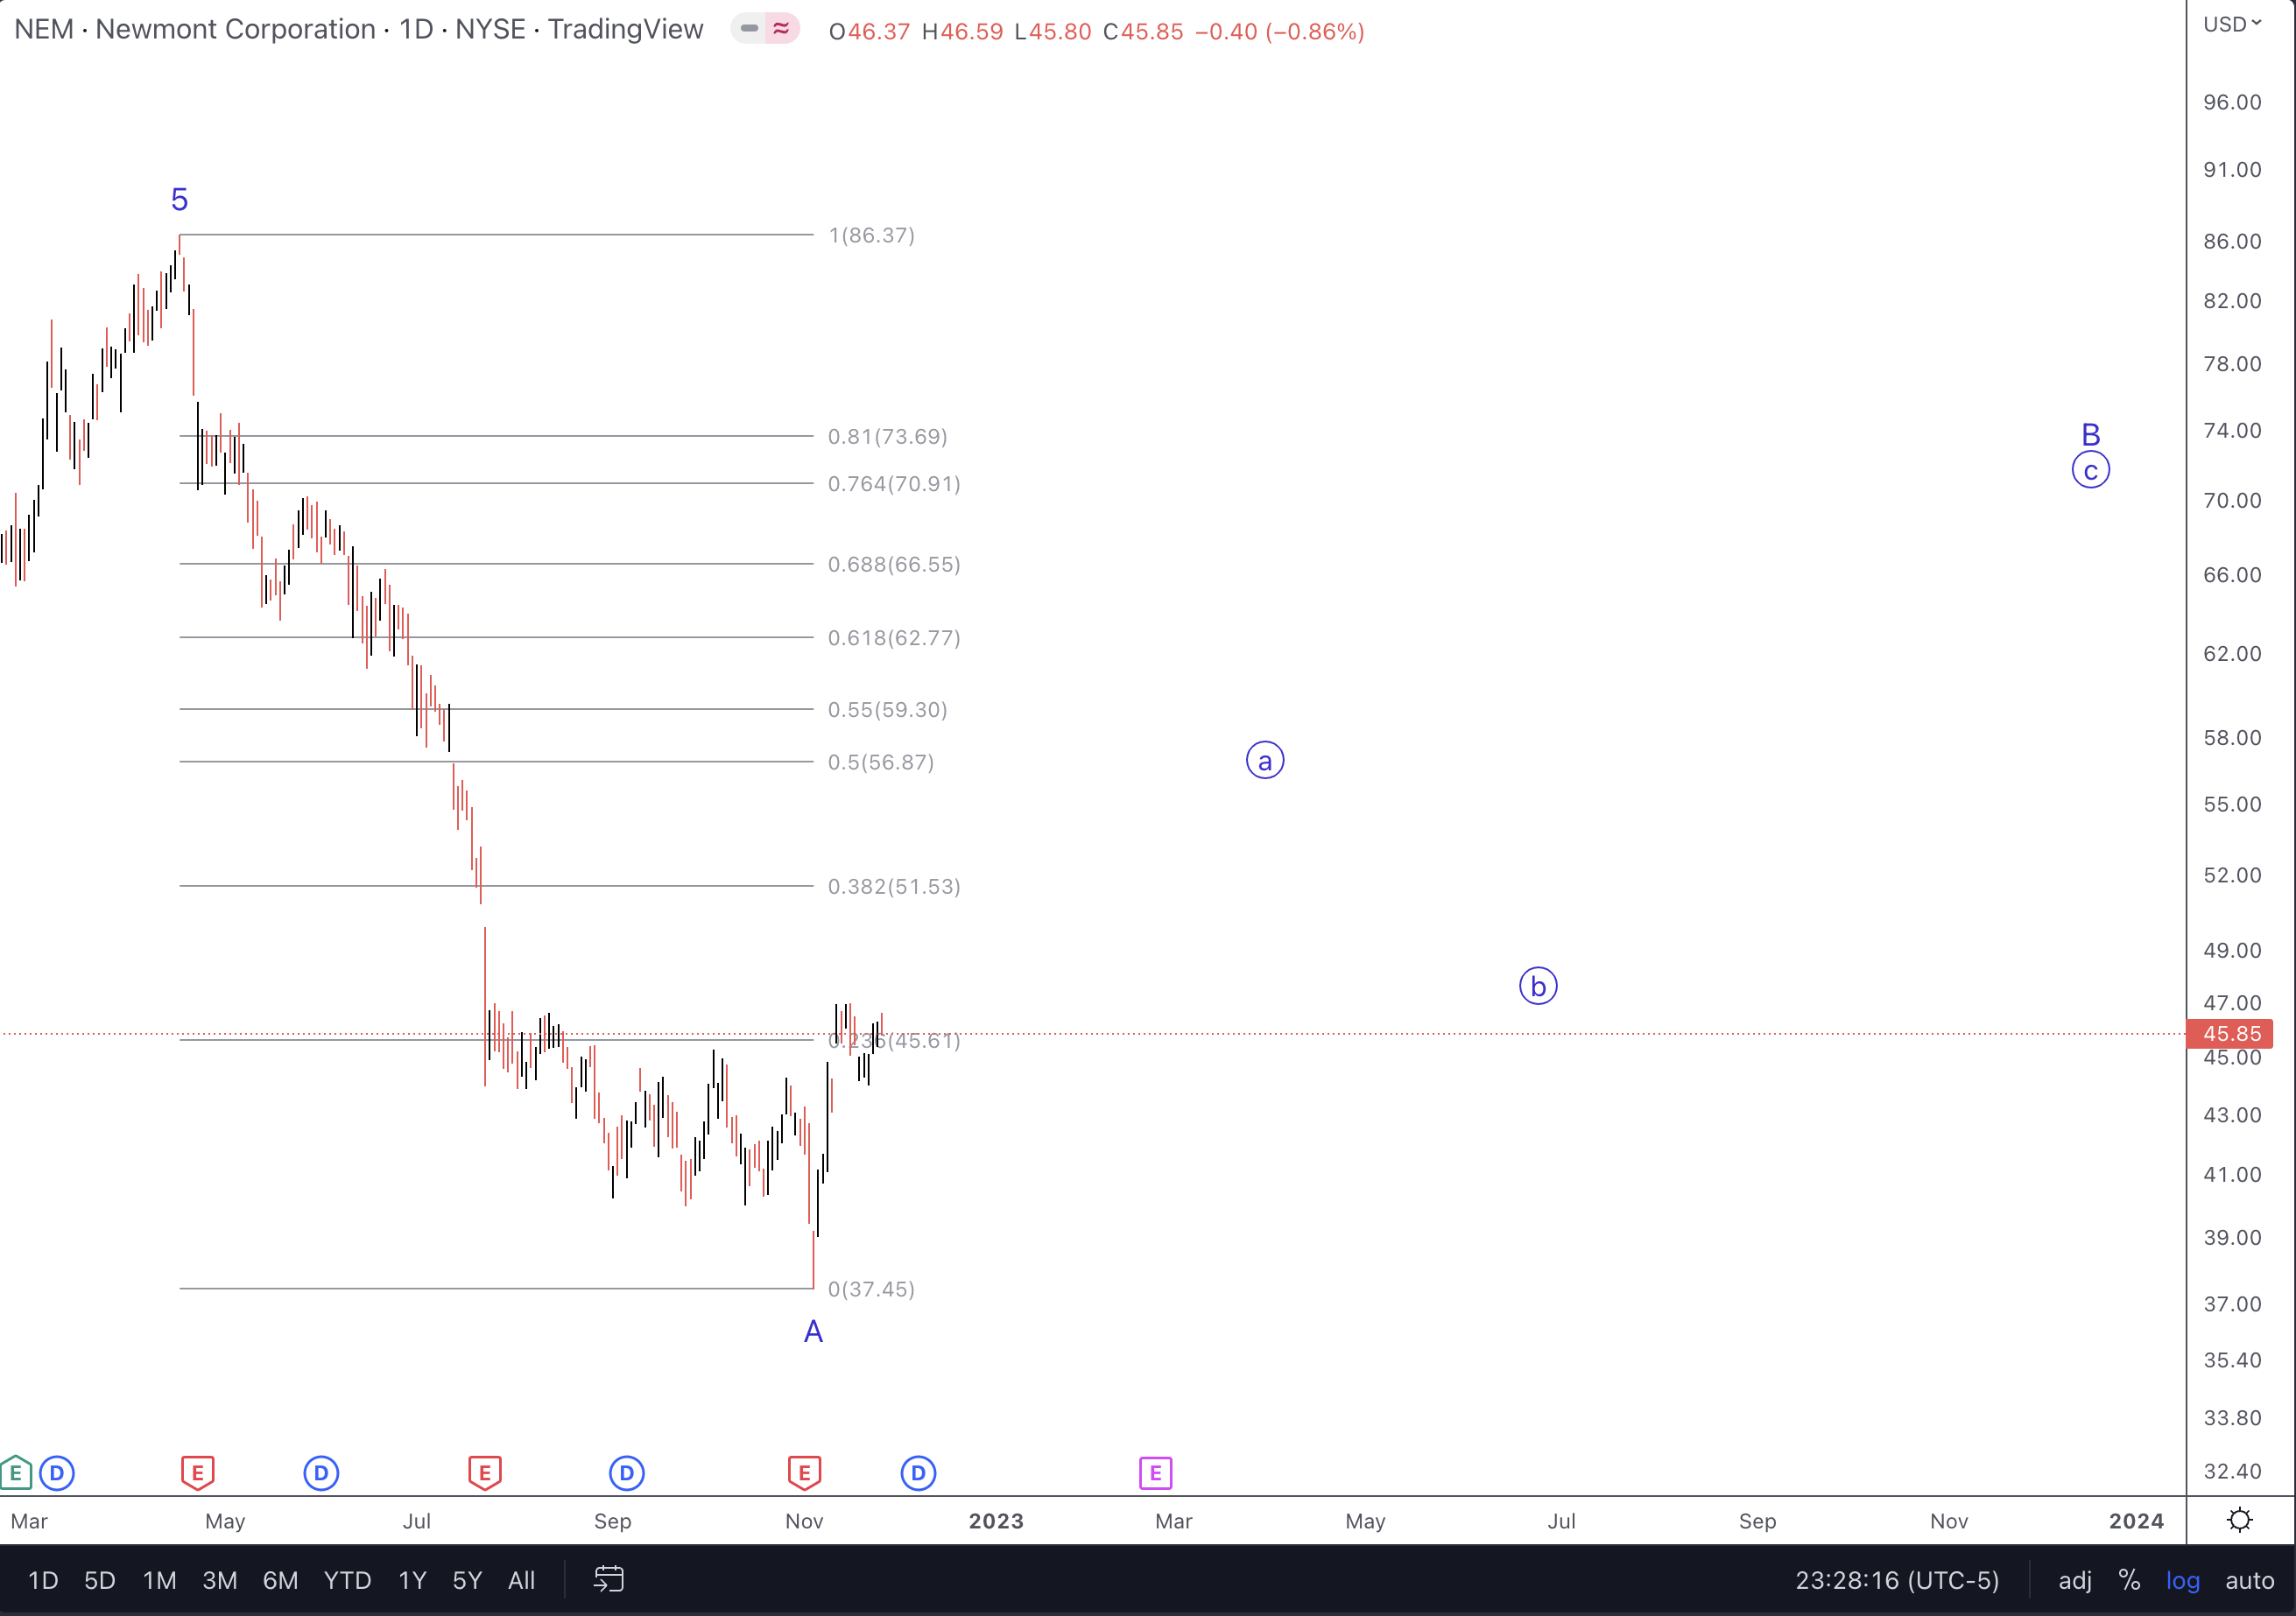
A more exact projection in price is not yet possible, but we are looking for a move back to the .618 – .764 retracement levels that you can see on this chart.
What’s more, NEM currently yields 4.8% and has one of the strongest balance sheets in the industry.
Other Notables
MotiveWave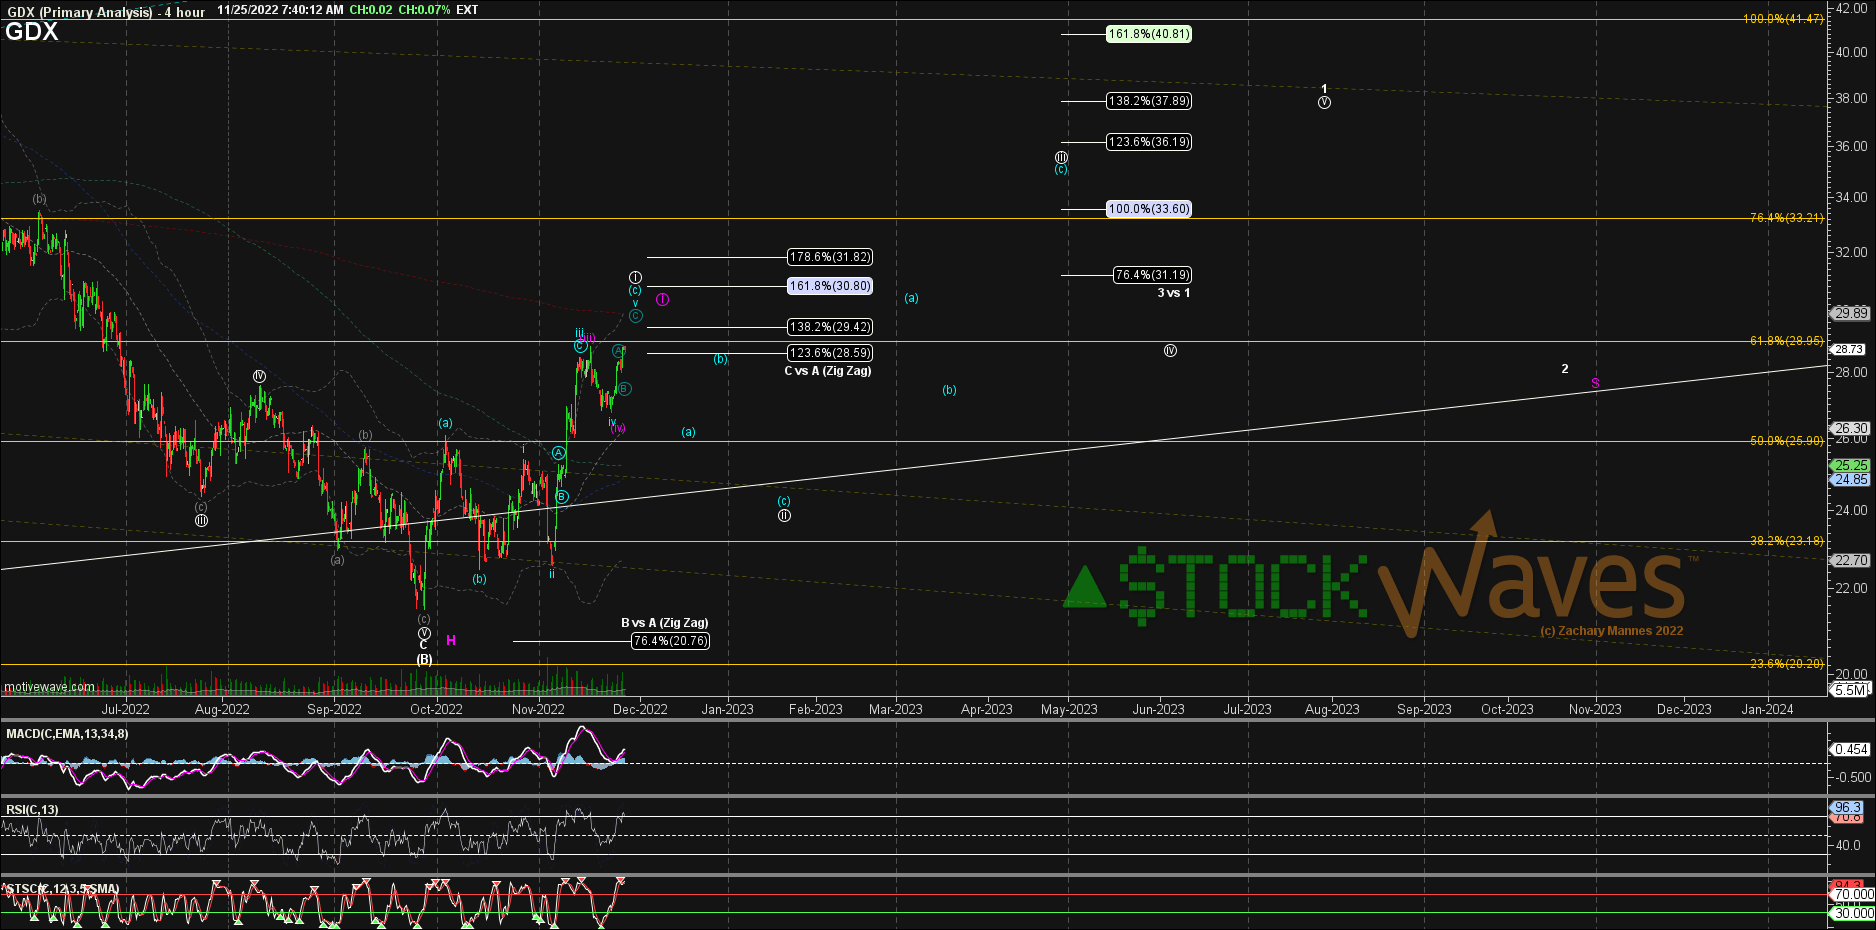
Many choose to trade these types of moves via GDX. This is one of the probable paths we see it following over the next several months.
MotiveWave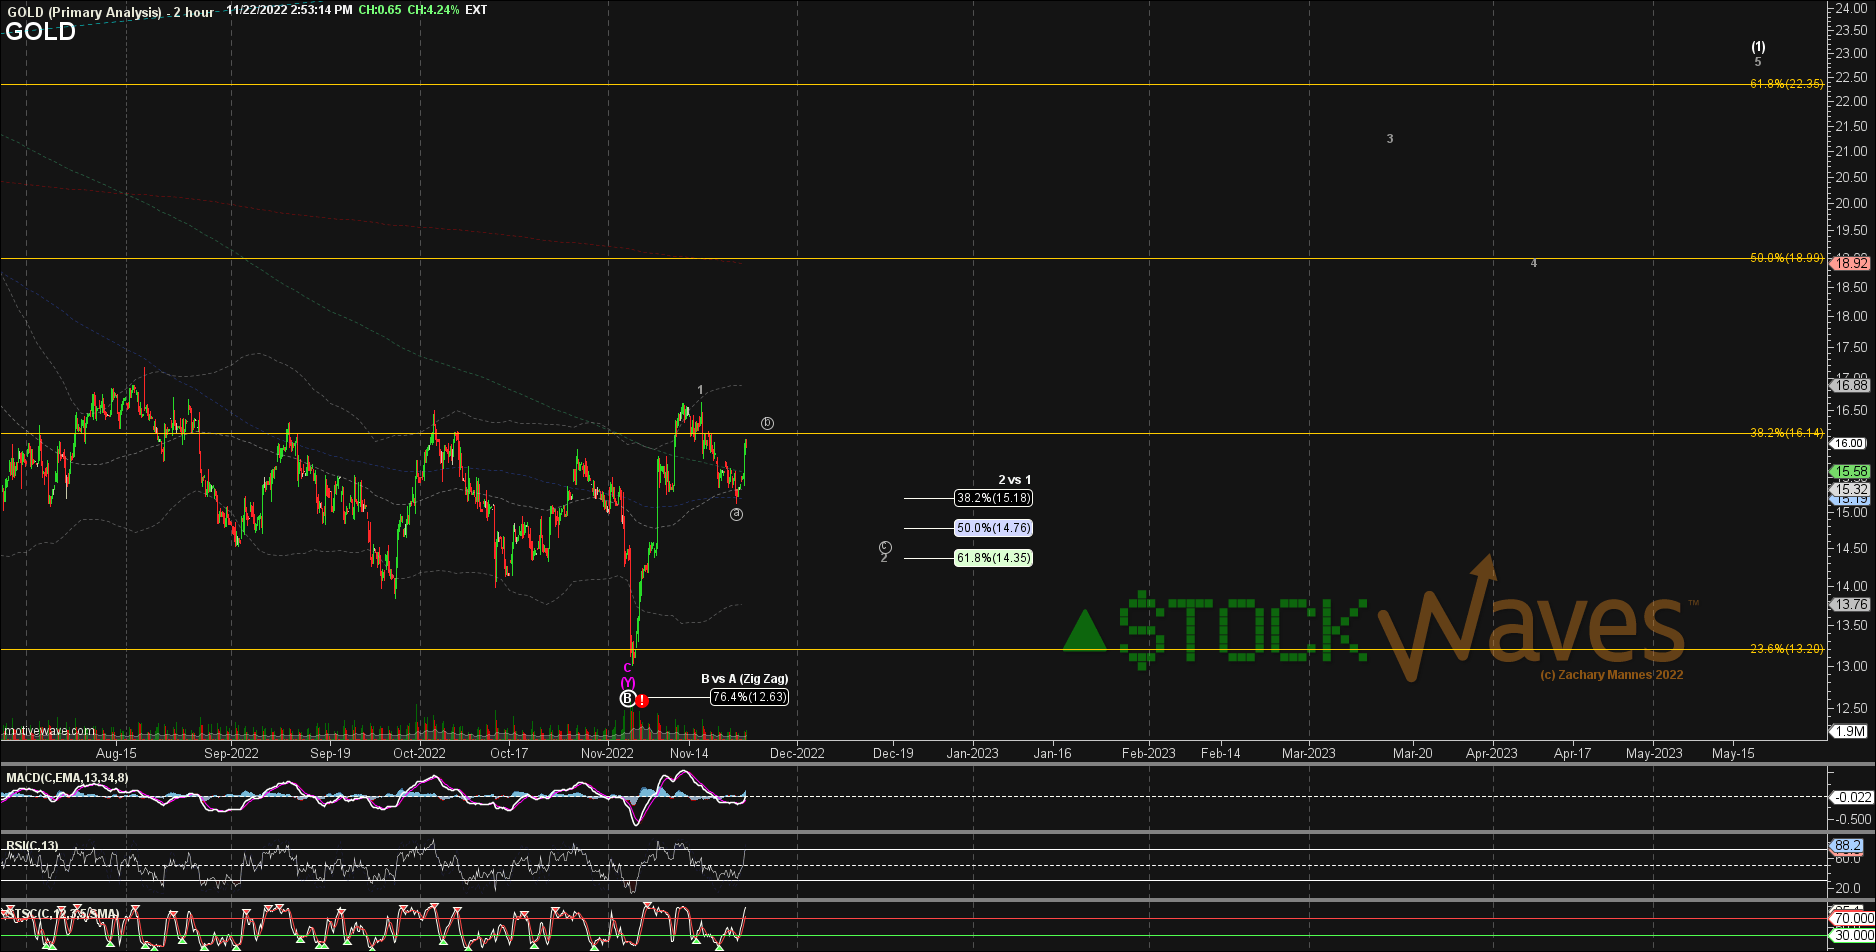
Another chart with a swing long viewpoint is Barrick (GOLD).
Conclusions and Risks
With the assumption that the low is in for gold and miners, we do not just blindly assume that our primary scenario will play out as drawn up. Should gold not form a full 5 waves up here as anticipated, then it remains vulnerable to another swing lower to perhaps the $1575 level.
We constantly update all of these charts plus dozens more for our members on a daily and even an intraday basis. Please keep in mind as well that the market is fluid, dynamic and non-linear in nature. We immediately adapt to what we are told via the structure of price.
As you can see from the attached charts and commentary, our main view is that metals have much higher to work via price over the next several months. In fact, there are some charts that we like even better than the ones attached in this article. Yes, that is a tease – my apologies. But, it is beyond the scope of the boundaries here to include everything that we are currently looking at. There will be much more to come in future pieces directed toward metals and miners.
I would like to take this opportunity to remind you that we provide our perspective by ranking probabilistic market movements based upon the structure of the market price action. And if we maintain a certain primary perspective as to how the market will move next, and the market breaks that pattern, it clearly tells us that we were wrong in our initial assessment. But here’s the most important part of the analysis: We also provide you with an alternative perspective at the same time we provide you with our primary expectation, and let you know when to adopt that alternative perspective before it happens.
There are many ways to analyze and track stocks and the market they form. Some are more consistent than others. For us, this method has proved the most reliable and keeps us on the right side of the trade much more often than not. Nothing is perfect in this world, but for those looking to open their eyes to a new universe of trading and investing, why not consider studying this further? It may just be one of the most illuminating projects you undertake.
Be the first to comment