

undefined undefined/iStock via Getty Images
Thesis
Newmont Corporation (NYSE:NEM) stock came under more pressure in August after the leading gold mining company posted a Q2 release that disappointed the market.
However, we observed that NEM could have staged a long-term bottom in August (not validated yet) as pessimism over gold miners reached a high level. Management is also confident in sustaining its dividend, supported by a robust balance sheet and free cash flow (FCF) margins despite the surge in production costs. Therefore, we are confident that management’s guidance is credible, which should help underpin the recovery of buying sentiments on NEM.
We posit that NEM’s near-term headwinds have been factored substantially into its current valuation. Even though production growth could be “flattish” through FY24, the company is confident of improving its costs profile over time, helping lift its operating leverage and free cash flow profile.
Accordingly, we rate NEM as a Buy and urge investors to use the weakness to add more positions.
Newmont’s Production Costs Growth Spooked The Market
NEM fell more than 50% from its April highs to its recent August lows. Therefore, it has been a spectacular collapse for the leading gold miner as the market focused on its near-term challenges.
Newmont AISC change % (Company filings)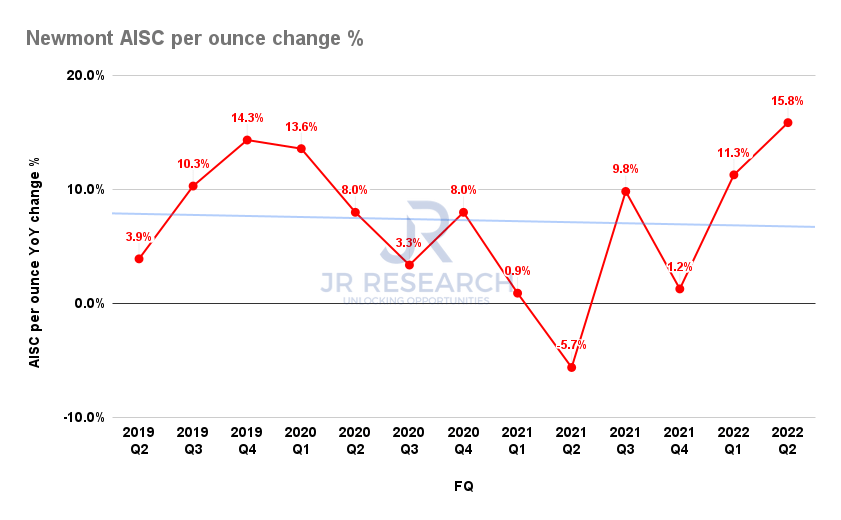
Notably, the company has been beset with multitudinous increasing production costs challenges that saw its all-in sustaining cost (AISC) surge tremendously in FQ2.
As seen above, Newmont’s AISC rose by 15.8% YoY in Q2, up from Q1’s 11.3%. Therefore, another quarter of above-trend AISC growth spooked the market, leading to its post-earnings sell-off.
However, we urge investors not to be unduly concerned, as the company’s FY22 guidance of its AISC suggests that its AISC could have peaked or peaked soon. Newmont reported an AISC of $1,199 per ounce in FQ2. However, management also guided for a full-year AISC of $1,150 per ounce. Also, CEO Tom Palmer accentuated the company expects its costs headwinds to abate moving forward, as he articulated:
Everything [on inflationary pressures] we’re seeing is that at a commodity level, they have peaked and are flattening out. So as we look forward, we’re seeing that $20 an ounce that builds into that increase to our sustaining cost, but that’s pretty flat. There are some levels of stability, but still some levels of volatility. (Newmont FQ2’22 earnings call)
Newmont average realized price for gold change % (Company filings) Gold futures price chart (monthly) (TradingView)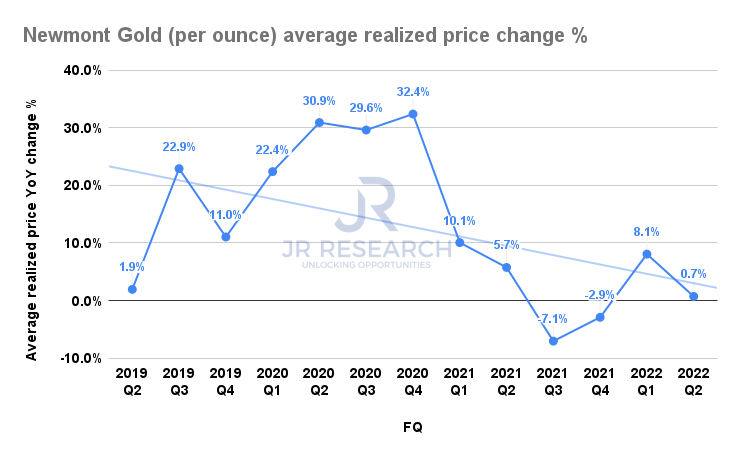
We are also cautiously optimistic that Newmont’s average realized price growth has likely bottomed out in Q3’21. Of course, the continued volatility in gold prices has heaped further pressure on the company’s ability to cope with a surging AISC. However, we believe it has already been reflected in NEM’s valuation, given the significant battering from April.
Furthermore, we observed that the downside on gold prices is likely to be limited, as we see robust long-term support at around the $1,700 levels. Therefore, we postulate that management’s current dividend policy, which is configured at gold prices remaining stable at the $1,800 levels, is credible.
NEM’s Valuations Have Been De-risked Significantly
NEM EV/NTM EBITDA valuation trend (koyfin)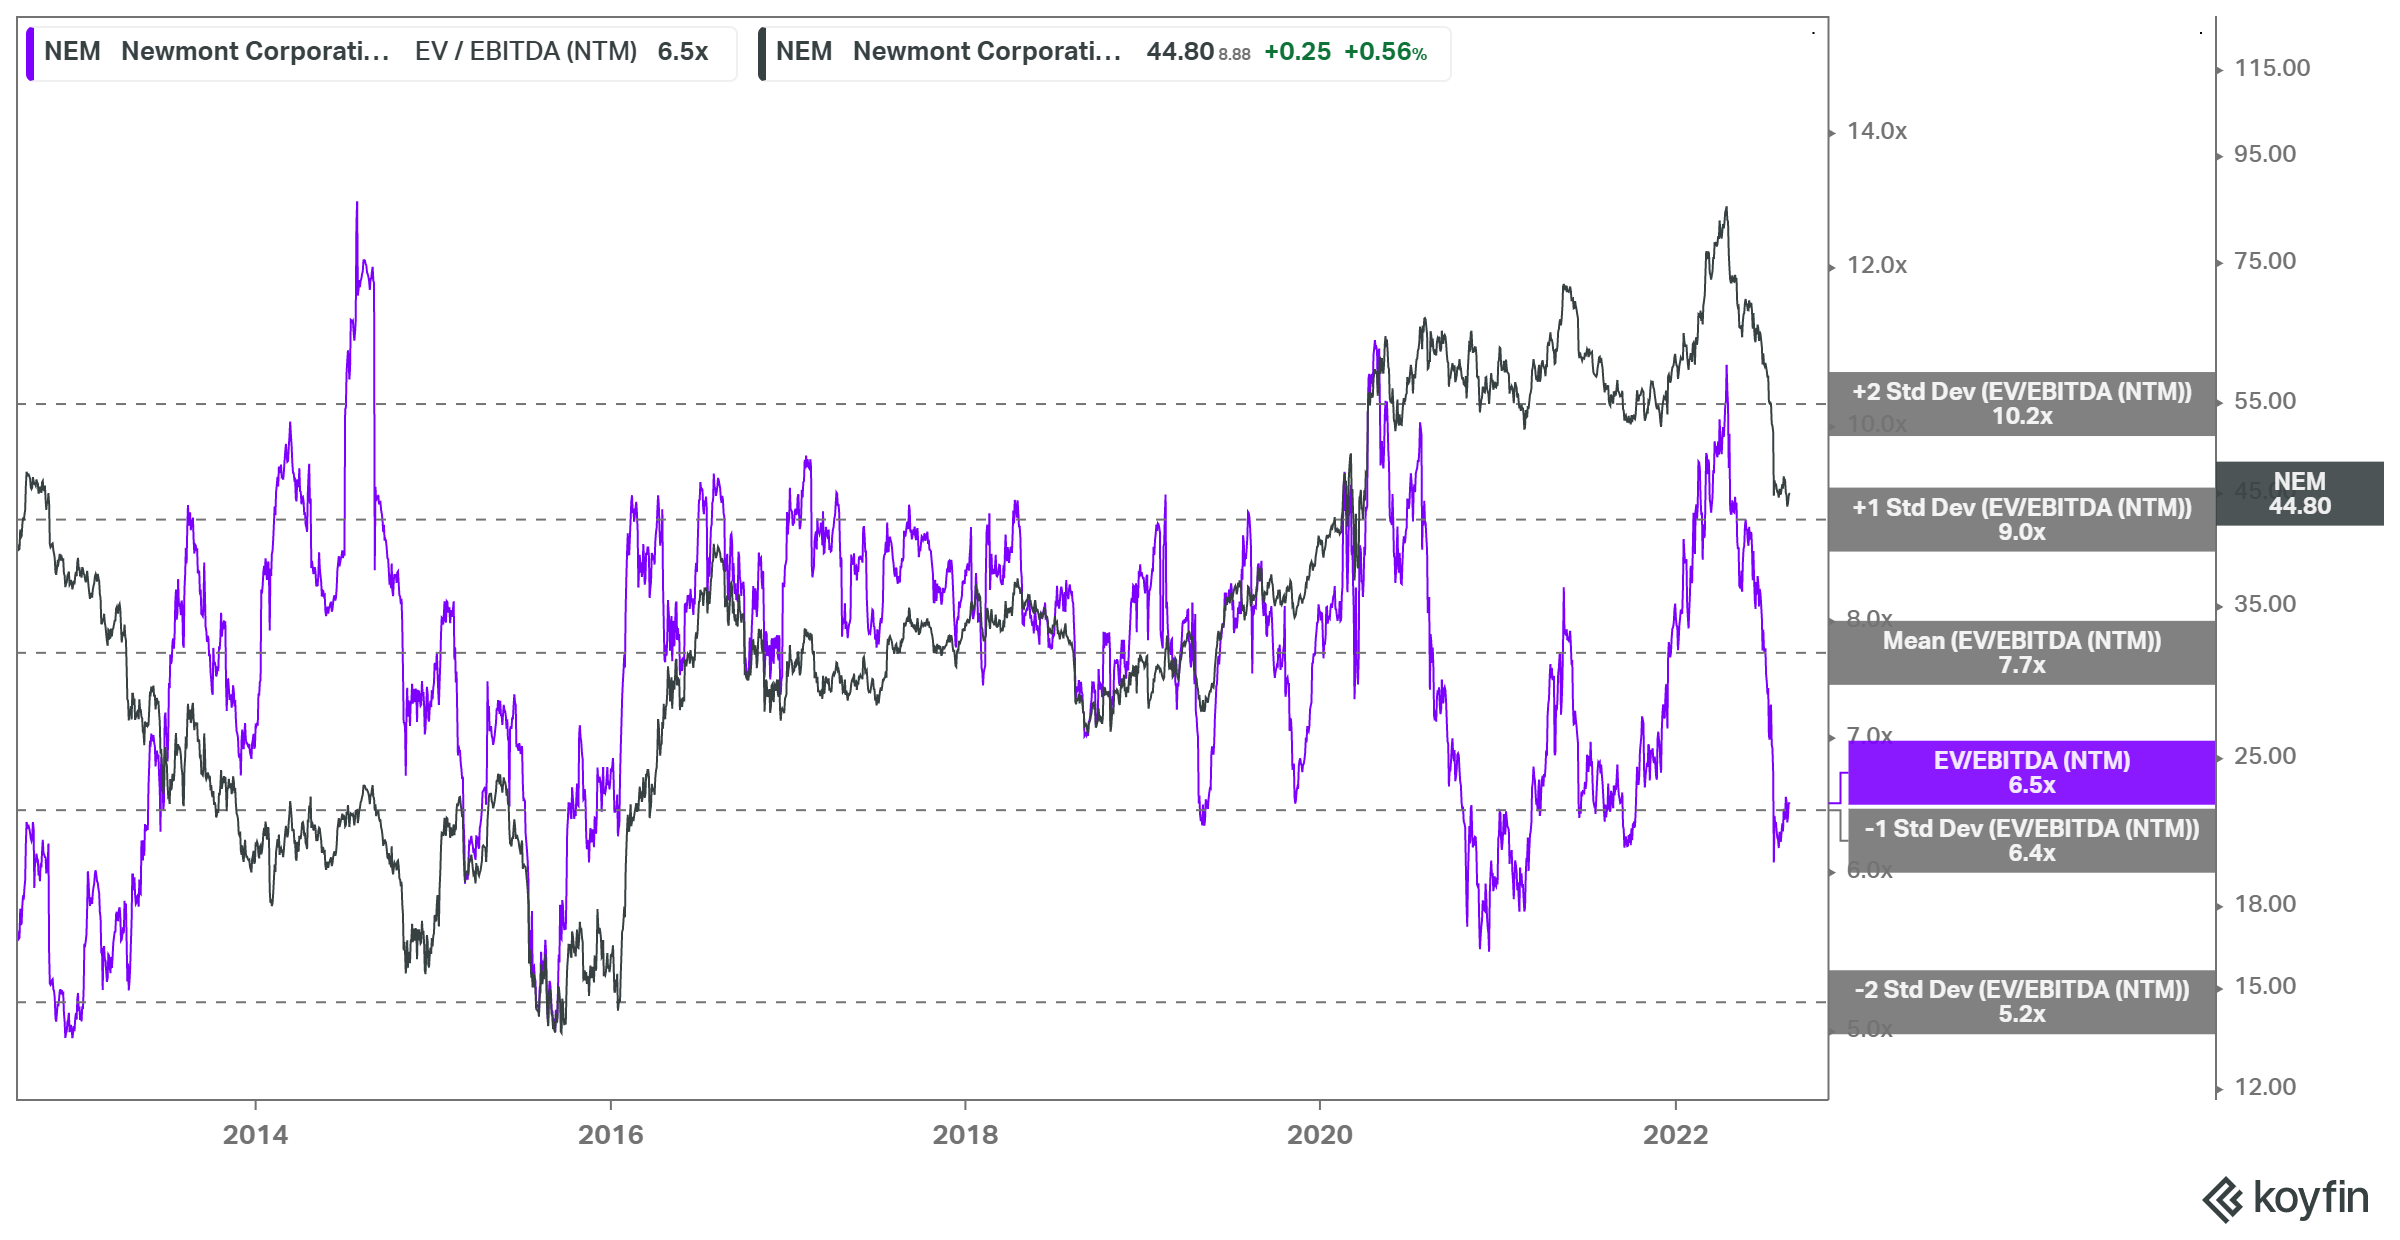
As seen above, NEM’s EV/NTM EBITDA multiple has collapsed markedly from its April 2022 highs (obviously unsustainable). NEM’s current NTM EBITDA multiple is close to the one standard deviation zone below its 10Y mean, which has been supported robustly over the past few years. Therefore, we are confident that its valuation has been de-risked significantly.
NEM TTM FCF multiples valuation trend (koyfin)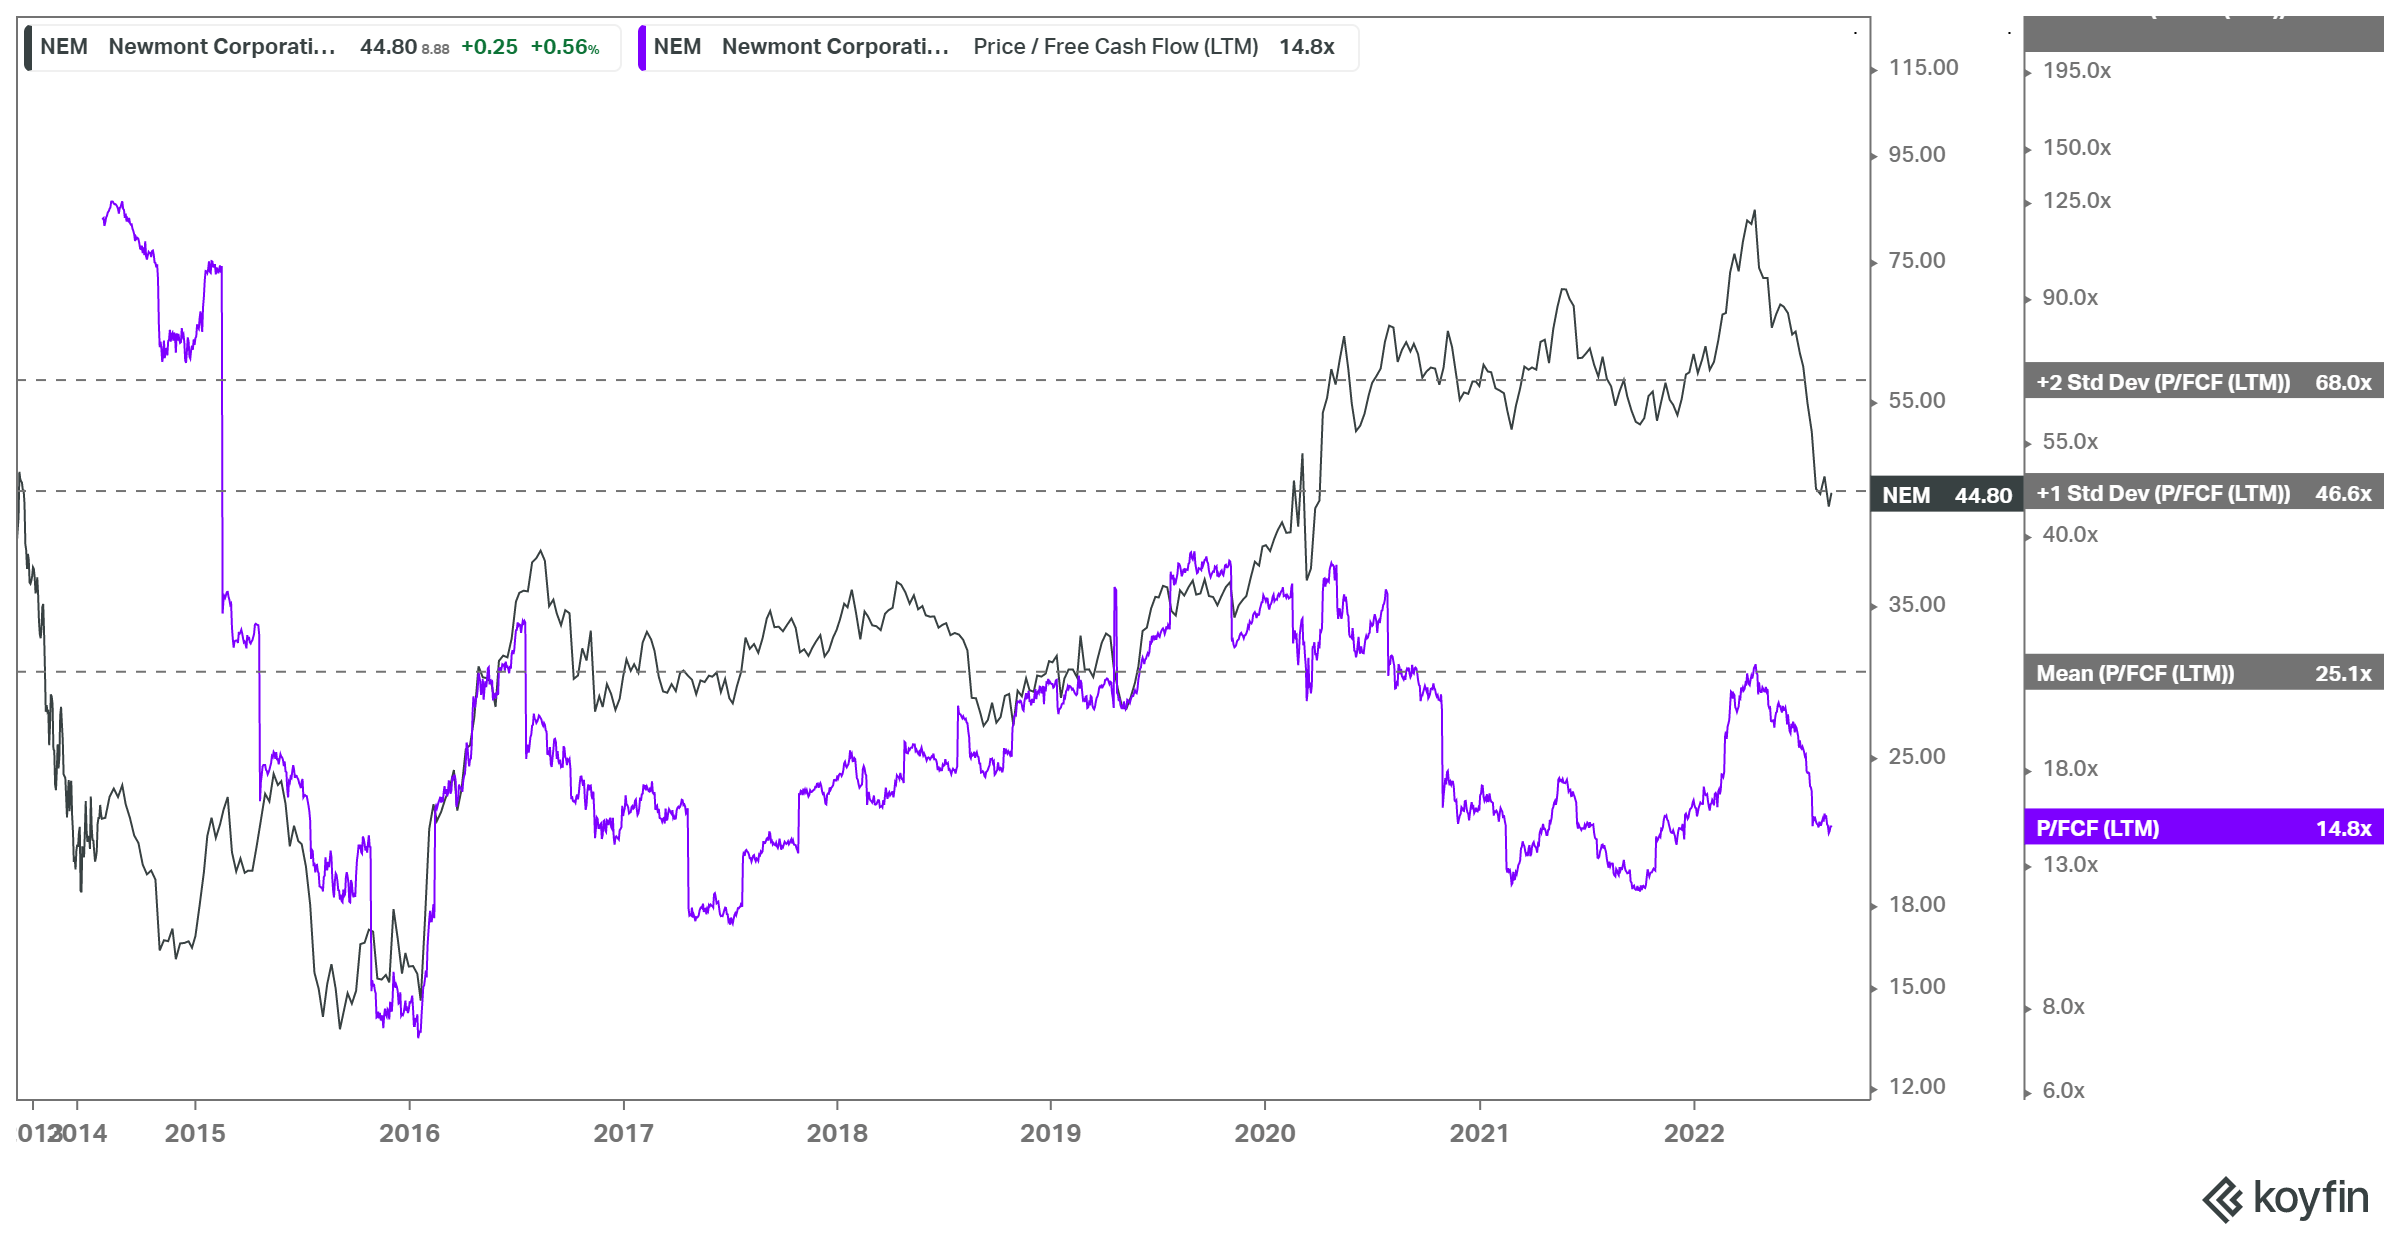
Also, we gleaned that NEM’s TTM FCF multiples have fallen markedly from its 10Y mean, corroborating our observation of its EBITDA multiples. Notwithstanding, the market remains tentative about re-rating NEM above the 10Y mean of its FCF multiple, suggesting the market’s concern over the volatility of its underlying operating performance. Therefore, investors are urged to demand a significant discount from the long-term mean for a less aggressive entry point.
Is NEM Stock A Buy, Sell, Or Hold?
NEM price chart (monthly) (TradingView)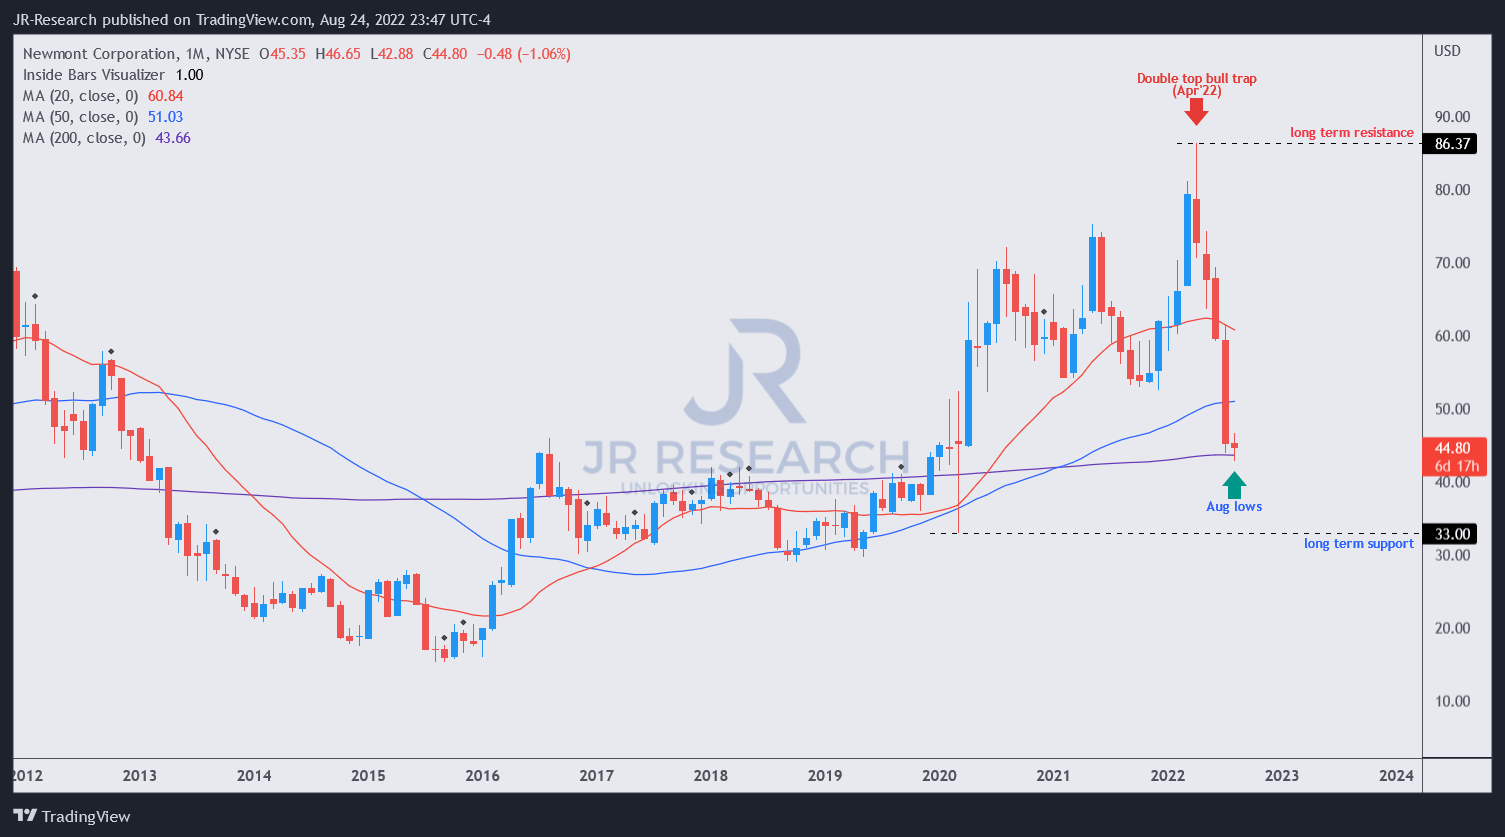
Investors should note that NEM’s post-earning sell-off in July could have helped create a capitulation bottom for the stock.
We observed that the selling pressure in August had been absorbed robustly, lending credence to our thesis of a long-term bottom. While it has not been validated (since August is still not over yet), we posit that further downside from the current levels seems limited. As a result, we postulate a long-term bottom process in NEM, in line with our analysis of a bottom in gold prices.
Therefore, we believe the reward-to-risk profile on NEM seems attractive, coupled with reasonable valuations.
As such, we rate NEM as a Buy.
Be the first to comment