

gchapel
It’s been a tough year thus far for the Gold Miners Index (GDX), and after a disappointing first-half performance, Newmont (NYSE:NEM) is one of the worst performers. This is evidenced by its 31% year-to-date decline, an 800 basis point underperformance vs. the GDX due to weaker margin performance than expected. However, I believe there are reasons to be optimistic, with gold being hated and the stock trading at its smallest premium to net asset value in years. So, if weakness persists, I would view pullbacks below $40.45 as low-risk buying opportunities.
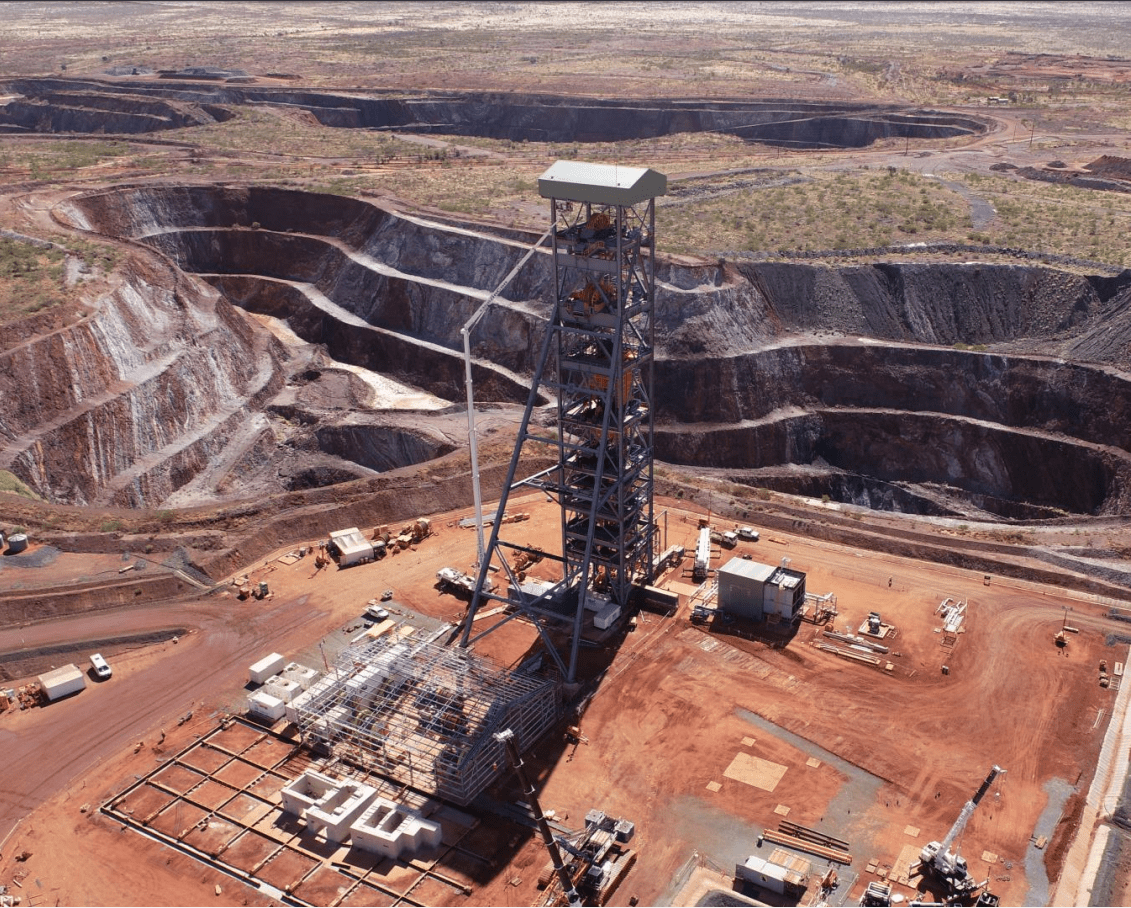
Tanami Expansion (Company Presentation)
Q2 Results & Recent Developments
Newmont released its Q2 results in late July, reporting quarterly production of ~1.45 million ounces of gold, a marginal increase from the year-ago period. Meanwhile, quarterly gold-equivalent ounce [GEO] production was up 10% year-over-year to ~333,000, pushing H1 production to 683,000 GEOs. Unfortunately, this slight increase in total sales (~1.79 million ounces vs. ~1.69 million ounces) was overshadowed by weaker metals prices, negatively impacted by unfavorable mark-to-market adjustments on provisionally priced sales.
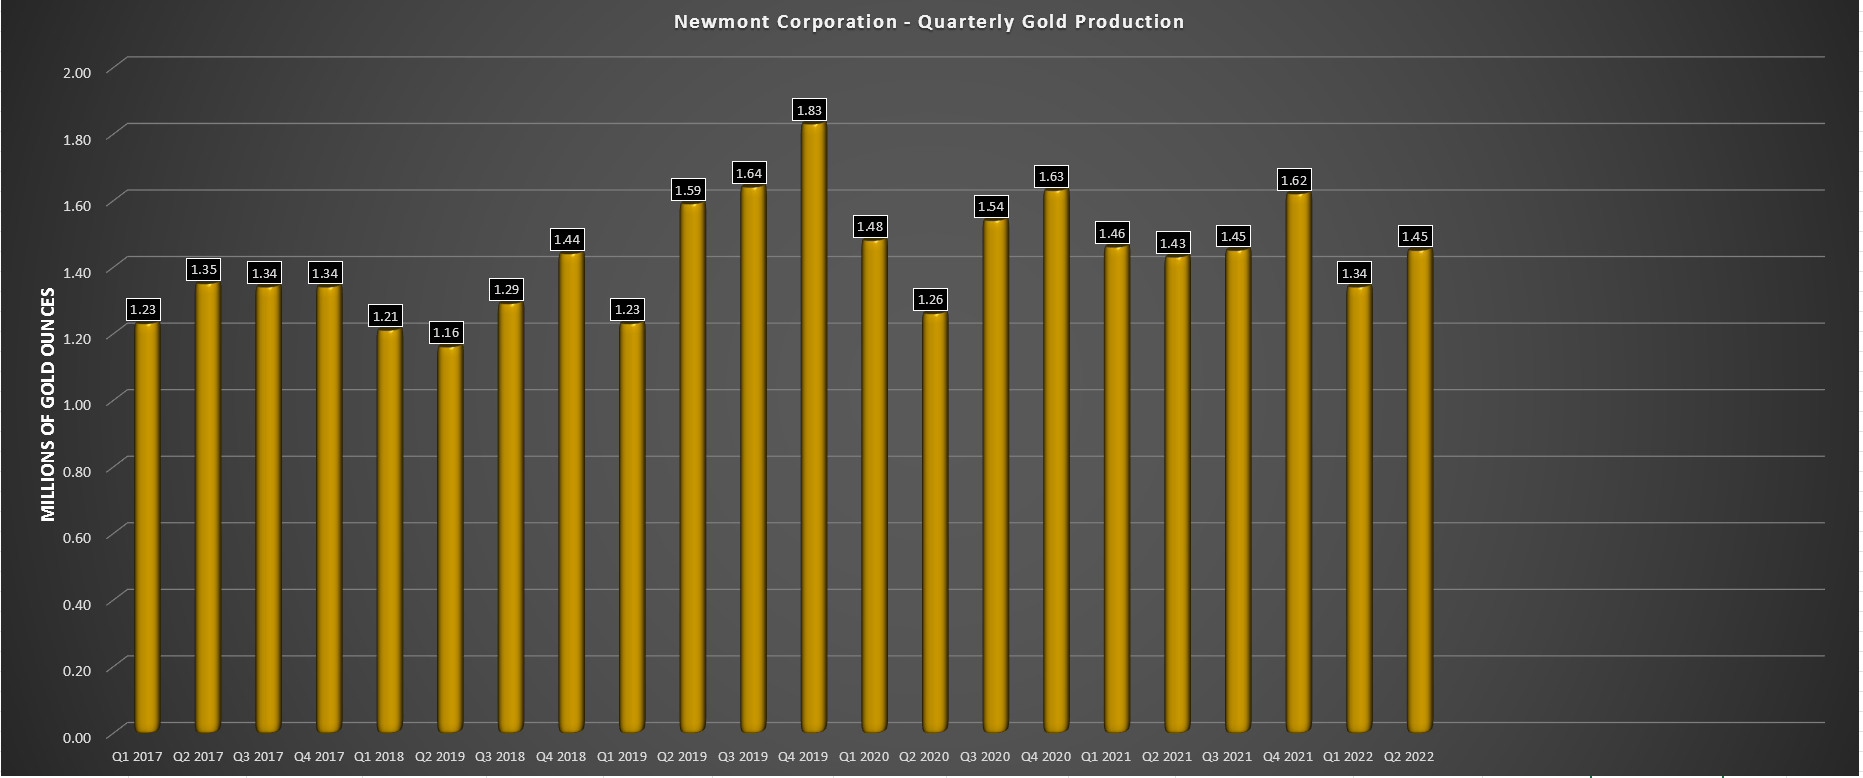
Newmont – Quarterly Gold Production (Company Filings, Author’s Chart)
While the weaker-than-expected revenue was a minor negative, the areas being watched closely due to the inflationary environment delivered the main disappointments. These were the fact that all-in-sustaining cost margins took a significant hit, declining from $905/oz to $575/oz in the period. This was partially related to a $65/oz increase in Q2 alone in its North American business from profit-sharing at Penasquito, the negative impact of mark-to-market adjustments, but mostly due to higher energy, materials, and consumables costs (diesel, steel, cyanide, natural gas), and labor inflation for contracted services. On a full-year basis, Newmont now expects up to 5% higher costs than previously expected, exacerbated by labor tightness in Australia.
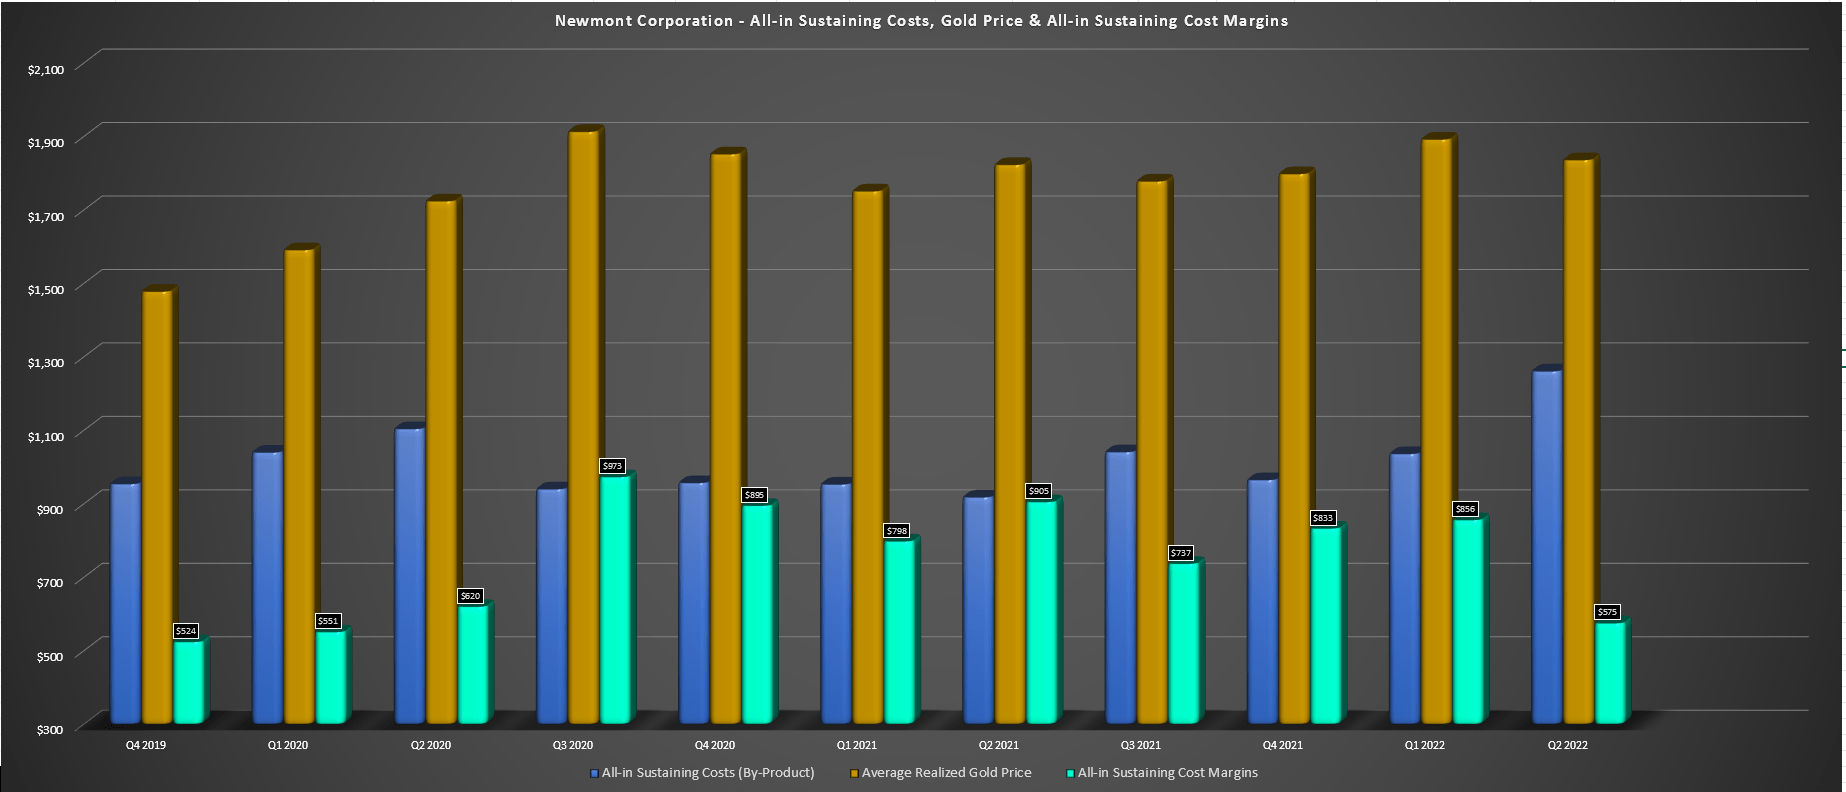
Newmont – All-in Sustaining Cost Margins (Company Filings, Author’s Chart)
Finally, the unexpected additional hit that set the company’s shares sliding post-earnings was that it had also seen inflation and delays in its development projects. At Ahafo North, capex estimates have been revised 15% higher with an updated 2025 commercial production outlook, a slightly negative development for this high-margin project (~300,000 ounces at sub $750/oz all-in sustaining costs). At Tanami, where the company is sinking a ~1,500-meter shaft that will boost production, deliver meaningful cost improvements, and extend the mine life into the 2040s, capex was revised to 25% higher, with commercial production planned for early 2025.
Given these surprise negative developments, it’s not surprising that Newmont has been an underperformer vs. its peers, especially after it came into the year as a significant outperformer, sitting at new 52-week highs above $80.00 per share. These negative developments also raised some uncertainty about the dividend. Still, Newmont was clear in its Q2 Conference Call that it had $4.3 billion in cash, a very low net debt to adjusted EBITDA ratio (0.30x), and $7.3 billion liquidity, giving it the flexibility to support the dividend in this window of higher investment. Specifically, Newmont’s CEO Tom Palmer stated:
- “We recognize that as a long-term business that we’ll reinvest from time to time, you’ll have periods of great reinvestment and lower reinvestment year-over-year or over a period of time. So we take that long-term view into consideration as we look at the spend profile of development capital.”
- “Our dividend is set up to be stable and robust over time”.
In a recent Denver Presentation, CEO Tom Palmer noted that the company would be releasing a new dividend framework that would look similar to its current one but have some changes. For those unfamiliar, the current one has a 6-month lookback on the gold price with dividends calibrated at $1,200/oz, $1,500/oz, $1,800/oz, and $2,100/oz with annualized dividends of $1.00, $1.60 to $1.90, $2.20 – $2.80, and $2.80 – $3.70, respectively. While the gold price is below the $1,800/oz level currently, I am cautiously optimistic that we won’t see a dividend cut, which I’ll expand on below:
Dividend Safety
The below chart shows the current annualized dividend payouts discussed above. With free cash flow expected to come in at ~$1.70 billion next year, supporting the dividend ($1.74 billion based on 790 million shares) wouldn’t be an issue, especially with the strong balance sheet that could provide a buffer. However, assuming gold prices remain below $1,700/oz, free cash flow could sink to less than $1.40 billion in 2024 during a period of slightly higher investment. This would make it more difficult to support the dividend with free cash flow, but there are some points worth considering:
- Newmont conservatively used the 40% payout ratio at $1,800/oz ($2.20 vs. $2.80), saving the company from what would have been a required dividend cut if it had aimed high previously.
- Newmont recently sold its minority stake in MARA for $125 million upfront and $50 million in deferred payments, further strengthening the balance sheet.
- Newmont has pushed out Yanacocha Sulfides, a positive development given that it shifts this capex-heavy project to 2025 or later with capex limited to two water treatment plants ($350 million over the next two years) vs. a previous outlook of $2.5+ billion over the next four years.
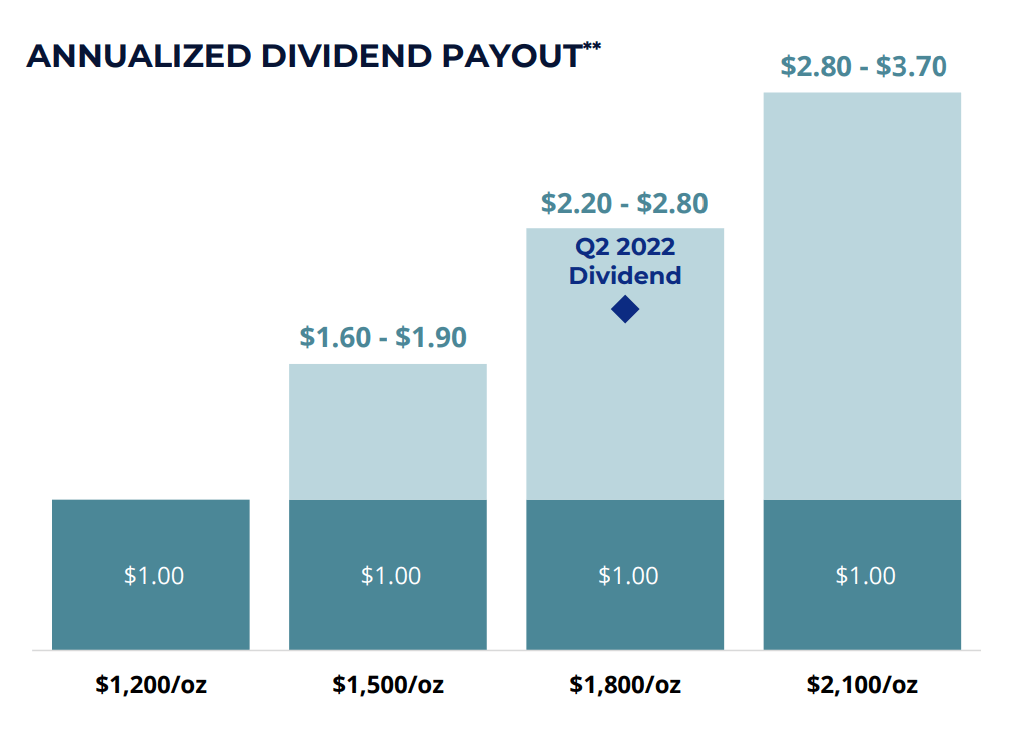
Newmont – Annualized Dividend Payout (Company Presentation)
So, while the gold price is set to head below the $1,800/oz level on a 6-month look-back basis if it doesn’t recover (currently $1,815/oz), it’s still much closer to the $1,800/oz level than the $1,500/oz level. Additionally, Newmont has a strong balance sheet to support a buffer, its growth capex spend has been cooled off with plans to push out Yanacocha to avoid execution risk (building three major projects at once in an inflationary environment), and it has a slightly stronger balance sheet with the sale of its stake in MARA.
Based on these points, the annualized $2.20 dividend should be safe as long as the $1,625/oz level holds, which I partially attribute to the company adamantly pointing out that it has flexibility in this framework. That said, the dividend framework is set to change due to the new normal of higher operating costs, higher capital costs, and higher costs from a tailings standpoint due to industry-wide changes. Overall, I don’t expect these changes to be that unfavorable, and even with these changes, I expect the dividend to remain very competitive.
A possibility is that the dividend could change to $1.30, $2.20, and $2.80 at gold prices of $1,500/oz, $1,800/oz, and $2,100/oz, respectively, vs. $1.60 – $1.90, $2.20 – $2.80, and $2.80 – $3.70 currently. We could also see a tightening of the current range, with the top side of the range, relaxed considerably. Investors should get more information related to this by year-end, but given the 50% decline in the share price, I believe this is mostly priced into the stock. Additionally, I think the more negative development would be a dividend cut, especially one of more than 10% (annualized dividend of $1.95 or less). I believe we can rule this out for the time being, as long as gold doesn’t weaken further.
Updated Margin Outlook & Earnings Trend
Based on the fact that the high-margin Ahafo North production has been pushed out and the higher operating cost environment, I have revised my previous estimates for Newmont’s all-in-sustaining costs and all-in-sustaining cost margins. My updated expectation is that AISC margins will likely be flat year-over-year from FY2022 to FY2023 after declining sharply in FY2022 ($738/oz to ~$575/oz), which assumes a $1,770/oz gold price in FY2022, FY2023, FY2024 and FY2025. The good news is that we do appear to be seeing some green shoots from an inflationary standpoint, with oil prices pulling back sharply and prices declining for some other materials.
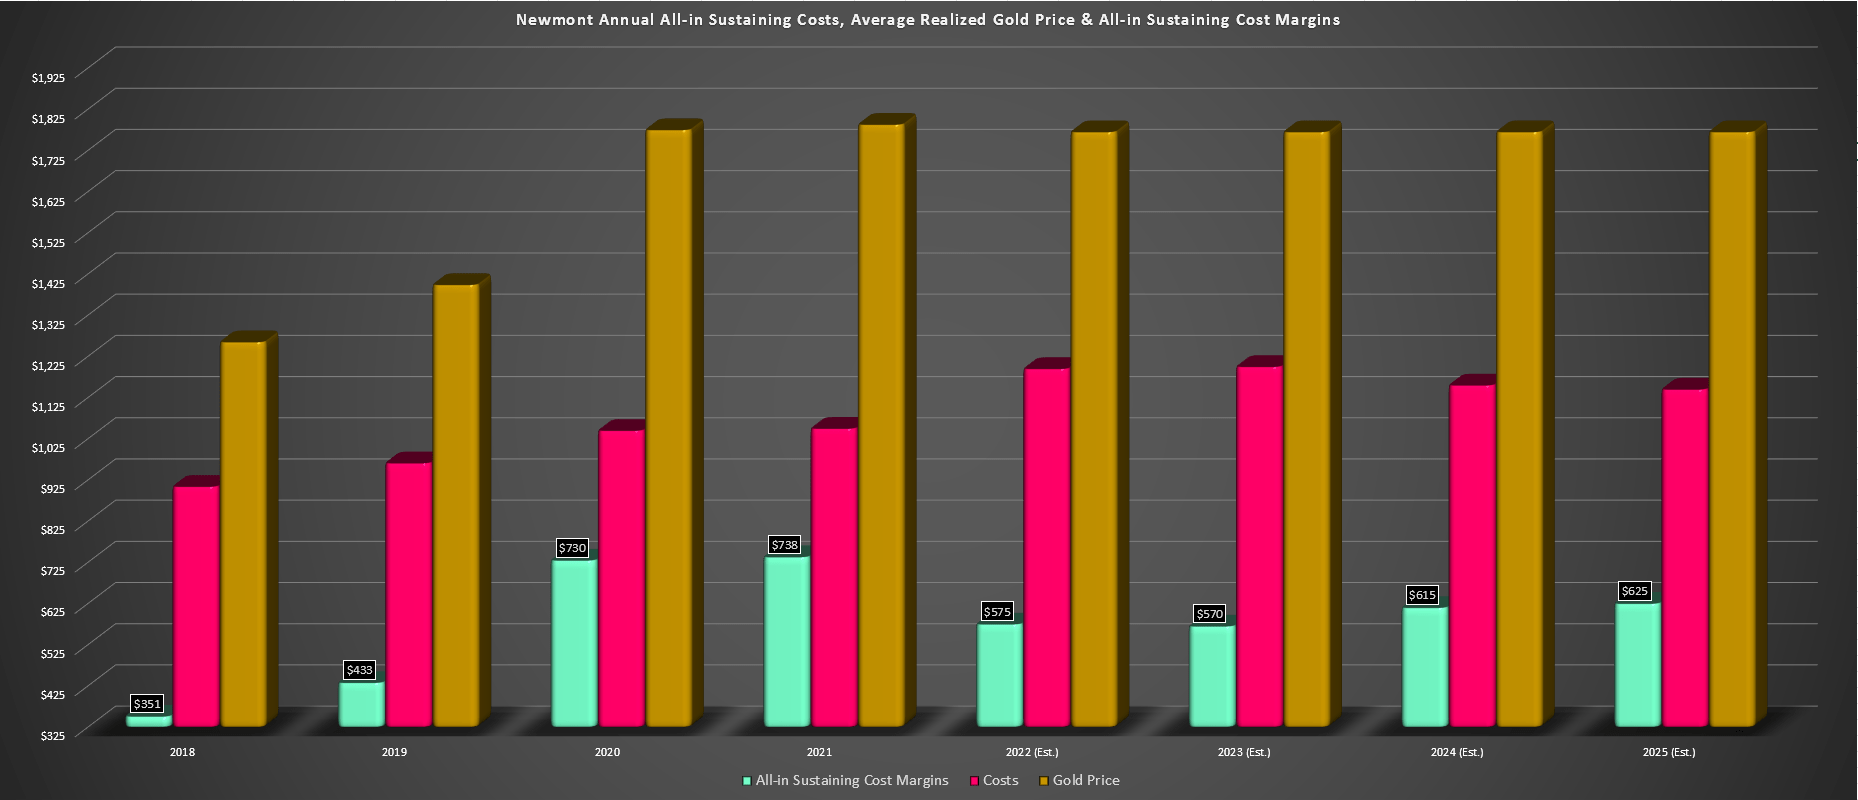
Newmont – All-in Sustaining Costs, Realized Gold Price, Margins & Forward Estimates (Company Filings, Author’s Chart & Estimates)
That said, the major input cost for miners is labor, and I don’t expect labor prices to decline for employees. The area where we could see some improvement is within contracted services if the labor market becomes less tight, which is possible if some mines are throttled back at lower gold prices. Based on Q2 2022 potentially marking peak costs and an outlook of a flat gold price ($1,770/oz in 2022, 2023, 2024, and 2025), I would expect 2022 to mark the low for Newmont’s margins. Of course, this is contingent on a $1,770/oz gold price next year. I don’t see this as a stretch given the favorable environment for gold (sentiment extremely low where gold typically shines on a forward 1-year basis, negative real rates).
Meanwhile, from an earnings standpoint, Newmont’s earnings trend is certainly much less pretty but remains in a strong uptrend. Based on updated estimates, Newmont’s annual EPS is expected to decline to $2.28 in FY2022 and further in FY2023, down from $2.66 and $2.96 in FY2020 and FY2021, respectively. However, these figures are still well above pre-COVID-19 levels, which isn’t the case for some producers that continued to post net losses per share. That said, these earnings estimates could change dramatically to the upside if we see an improvement in metals prices.
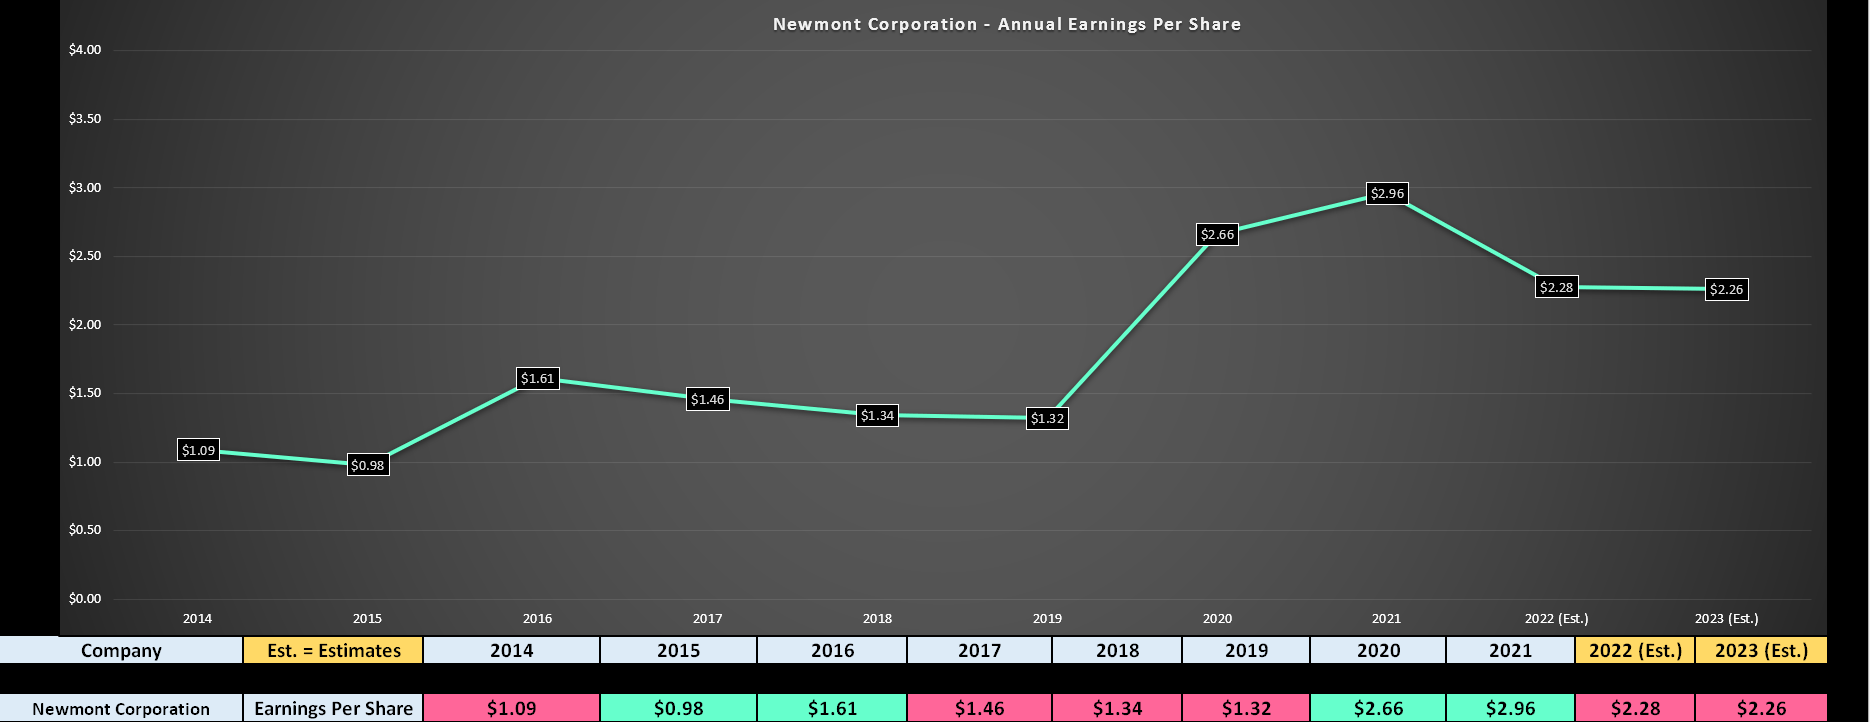
Newmont – Annual Earnings Per Share & Forward Estimates (Company Filings, Author’s Chart, FactSet)
Looking solely at the recent results and margin compression, it’s understandable if some might prefer to pass on Newmont as an investment. However, I don’t see any value in rear-view mirror analysis. While the landscape is undoubtedly harder due to inflationary pressures, the market often looks forward six to twelve months. In my view, we may have seen peak operating costs in Q2 2022 due to lower denominators for many producers, labor tightness, and elevated energy prices, and with the market being forward-looking, the margin outlook is much better post-FY2022, especially if the gold price can come back into favor and help on this side of the margin equation. Let’s take a look at the valuation below:
Valuation & Technical Picture
Based on an estimated 790 million shares at year-end and a share price of $42.60, Newmont trades at a market cap of ~$33.6 billion. This leaves the stock trading at a slight premium to its estimated net asset value (1.03 P/NAV) and 18.8x FY2023 earnings estimates ($2.28). Historically, NEM stock has traded at ~23.8x earnings over the past 20 years, and the gold price currently trades in the upper portion of this 20-year range. However, given the difficulties facing the sector (labor tightness, inflationary pressures on operating costs, and especially development projects) and the fact that NEM has heavier capex bills than its peers, I believe a more conservative earnings multiple to be 24.0 (3% discount).
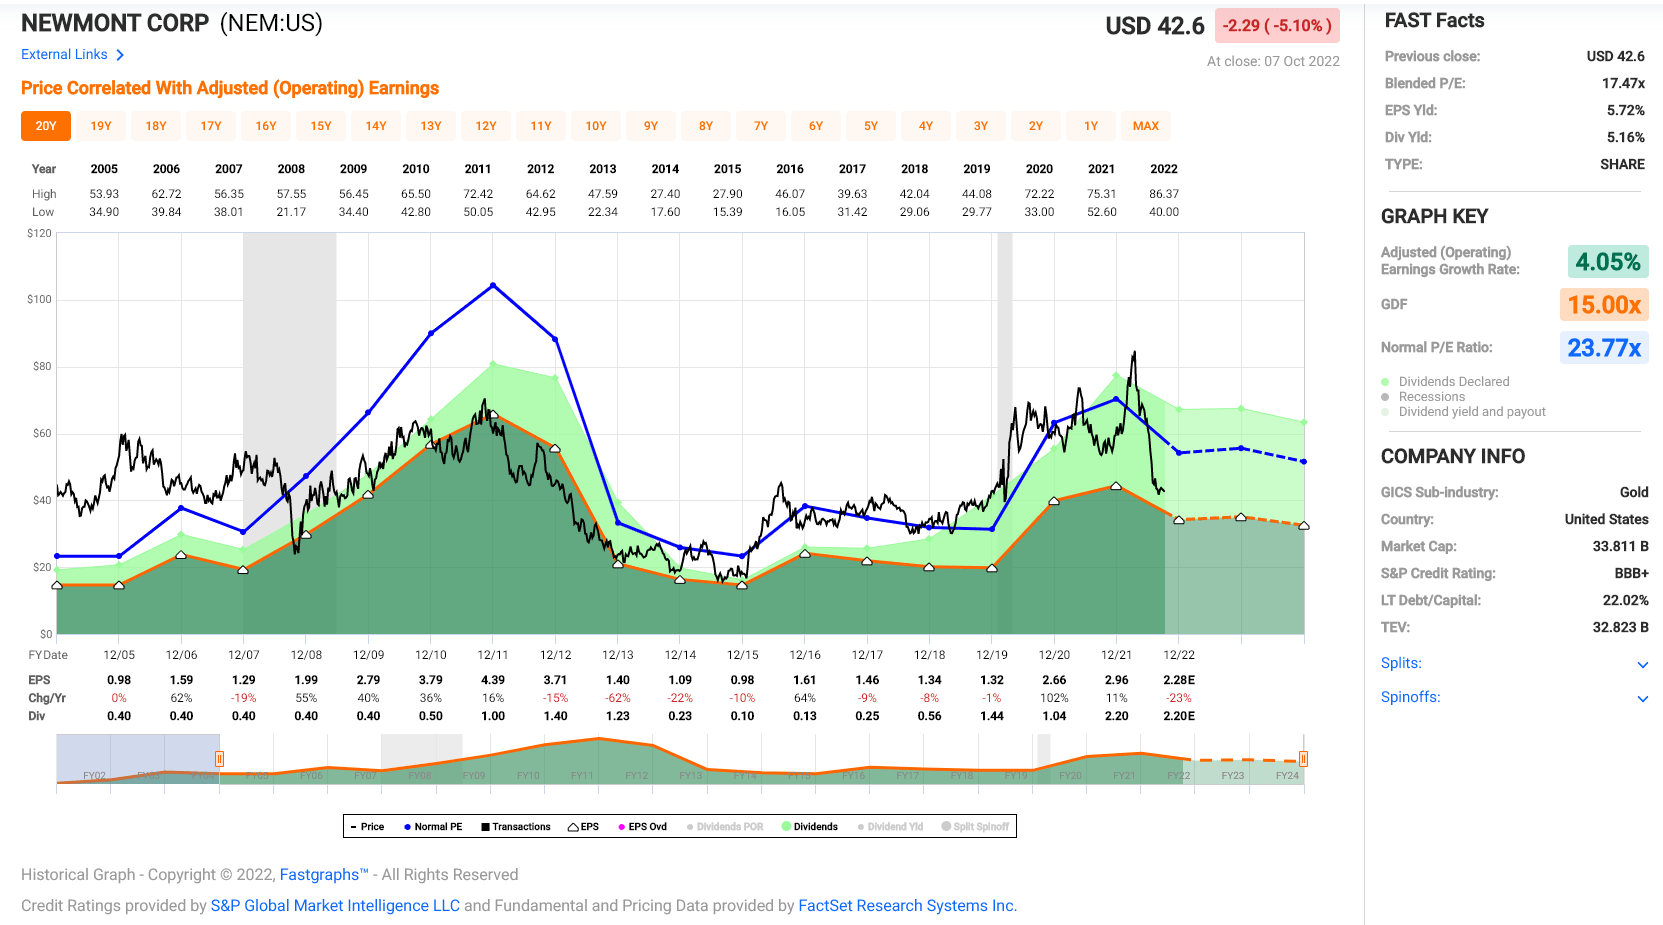
Newmont – Historical Earnings Multiple (FASTGraphs.com)
After multiplying NEM’s FY2023 earnings estimates by 24.0x earnings ($54.20) blended with a fair P/NAV multiple of 1.50 ($61.90), I see a fair value for the stock of $58.05. This translates to a 36% upside to fair value, but on a total return basis, including dividends, the upside to fair value is closer to 41%. That said, it’s important to note that these earnings estimates assume minimal improvement in gold, silver, and copper prices from current levels, which could dramatically increase earnings and this price target. So with a 41% upside to fair value in a base case but well over 55% upside if commodity prices recover next year and significantly more upside if gold prices exceed $2,000/oz.
Some investors might argue that this fair value estimate doesn’t make Newmont all that attractive an investment, with some arguing that the “attractiveness is debatable”. However, the missing piece that I believe is overlooked is that while many stocks have a solid base case upside with the corrections we’ve seen across all industry groups, gold producers and Newmont are unique in that they offer considerable leverage. The below chart evidences this, showing that Newmont’s annual incremental free cash flow increases by $400 million for each $100/oz move in the gold price, with $3.0 billion in annual free cash flow at $1,950/oz.

Newmont – Annual Incremental Free Cash Flow (Company Presentation)
So, while some analysis correctly points out the negative aspects of gold producers (being price-takers in an inflationary environment), some conveniently ignore the positive aspects. The ignored aspect is that while other industries might have pricing power, further pricing power is questionable after two years of price increases and a weaker consumer. Additionally, while they might have pricing power, they don’t have the leverage that gold producers offer. This is because while some companies might be able to raise prices by 2-3% per year without resistance, they don’t benefit from the potential for 15% to 30% increases year-over-year in the gold price, as we’ve seen in bull markets.
One could argue that gold has not responded well thus far, and thus there’s no reason to expect this to change. However, returns in the gold price have been quite lumpy historically, and there isn’t a perfect and immediate correlation between rising prices and negative real rates. That said, in periods of negative real interest rates like we’re in currently, gold has tended to perform its best. In addition, gold performs very well when sentiment is in the dumps and the metal is hated, and that’s exactly the setup we’ve found ourselves in currently.
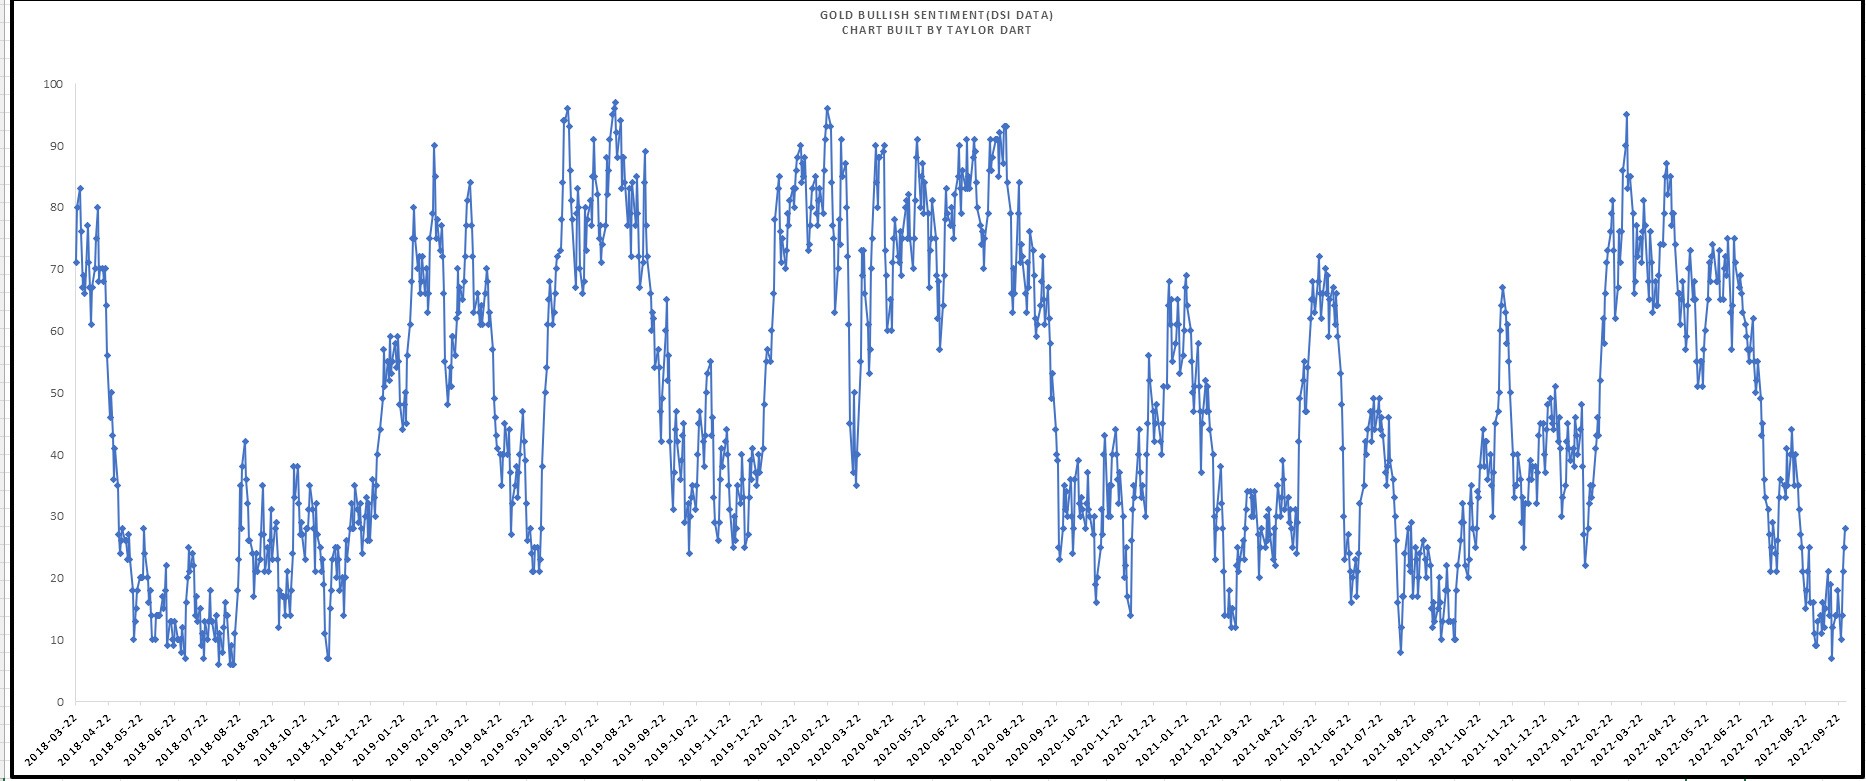
Gold Daily Sentiment (Daily Sentiment Index Data, TradeFutures.com, Author’s Chart)
So, I think the time to be optimistic about the forward returns for gold is now when it’s loathed vs. when it’s typically cheered when its trailing 1-year returns are above 30%, and it’s set up to consolidate or give back some gains with gold performing terribly when it becomes a crowded trade. Hence, while some investors might look at Newmont’s earnings trend combined with recent gold price performance and turn their noses, I think that’s exactly the time to be contrarian. To summarize, I think Newmont’s FY2023 earnings estimates could be conservative, suggesting that fair value could easily be north of $60.00 per share.
Technical Picture
Moving to the technical picture, there’s a lot to like here, with two key points worth highlighting. The first is that, as shown from the yellow boxes (bottom pane) and the top line (Newmont’s relative strength ratio vs. the market), Newmont has tended to hammer out important bottoms when this ratio has fallen below the green line. I last pointed this out at $55.00 per share in November 2021 at the previous signal (second chart below), and past signals have led to a forward 6-month draw-up of 45%, with the last signal exceeding the previous average (56% vs. 44%). Obviously, past performance doesn’t guarantee future returns, but this suggests Newmont could trade as high as $58.00 by the end of April 2023 vs. its recent low at $40.00.
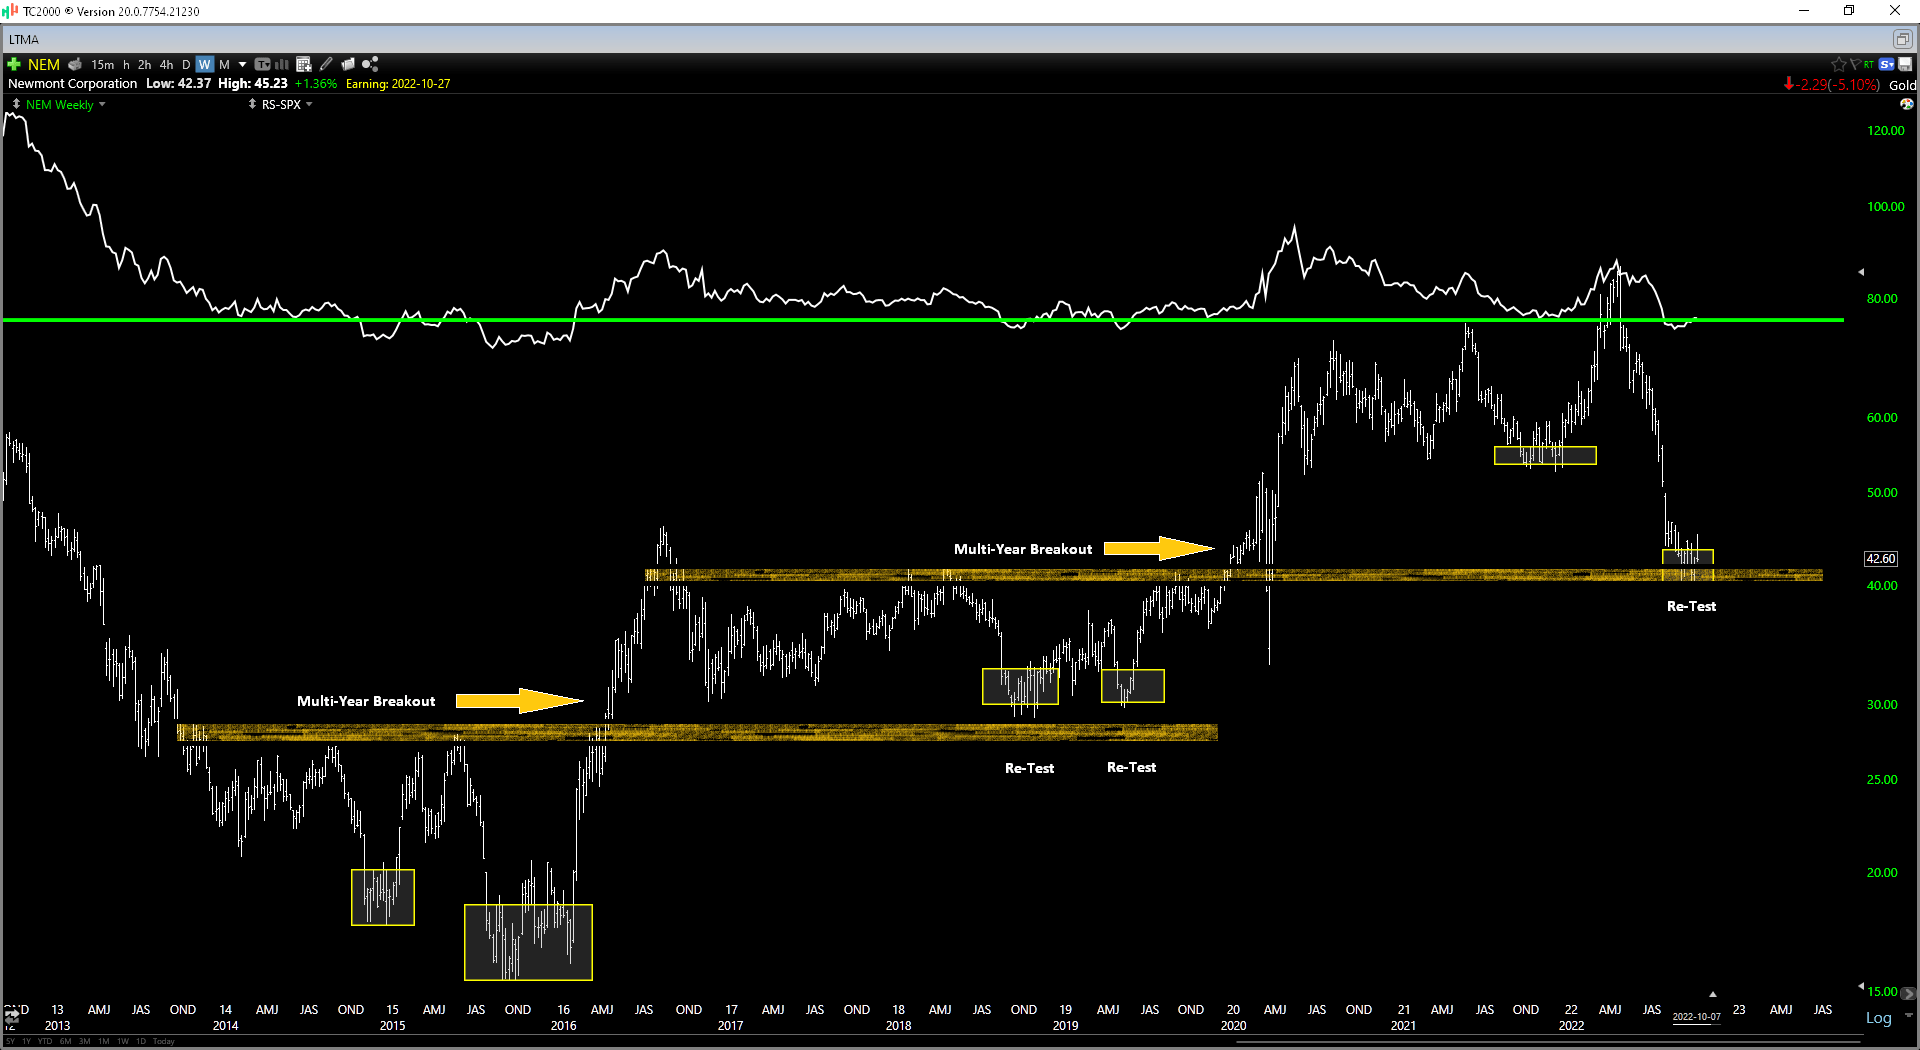
NEM – Technical Picture (TC2000.com)
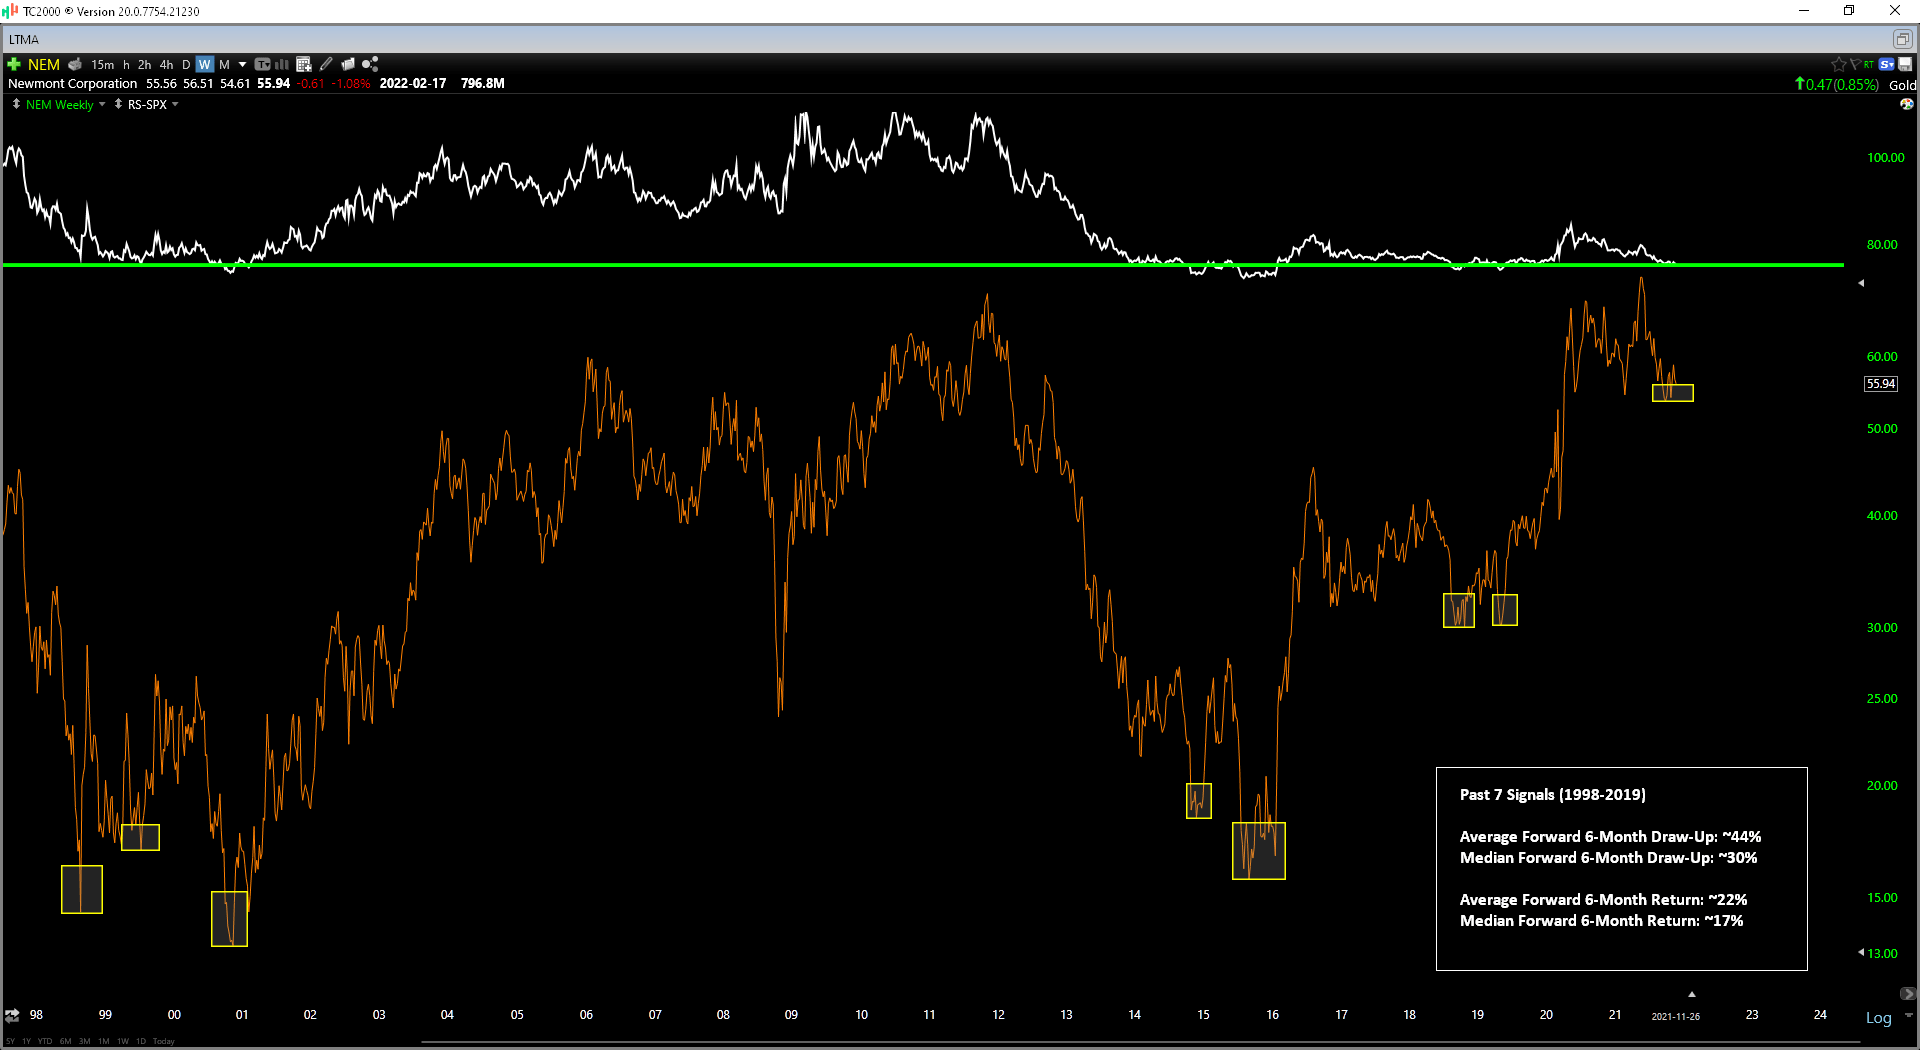
Newmont vs. SPX Ratio (TC2000.com)
In addition, the lower pane on the first chart shows that Newmont has pulled all the way back to a major support level. This is great news because, at the same time as the stock has fallen out of favor, it’s re-testing a critical previous break level, with past resistance zones often becoming new support. This area comes in at $39.00 – $40.00, and we could see a similar scenario to the previous multi-year breakout / re-test shown in the chart, suggesting Newmont should find a floor at $39.00 – $40.00.
Summary
To summarize, while Newmont may not offer the most attractive upside among gold producers, it certainly offers safety, and after a 50% correction, it is beginning to offer a solid value proposition as well. This is because the stock is the go-to name for funds due to its size and liquidity; it’s the largest gold producer globally with a phenomenal development pipeline, and it’s now trading at its smallest premium to net asset value in years, offering a meaningful margin of safety.
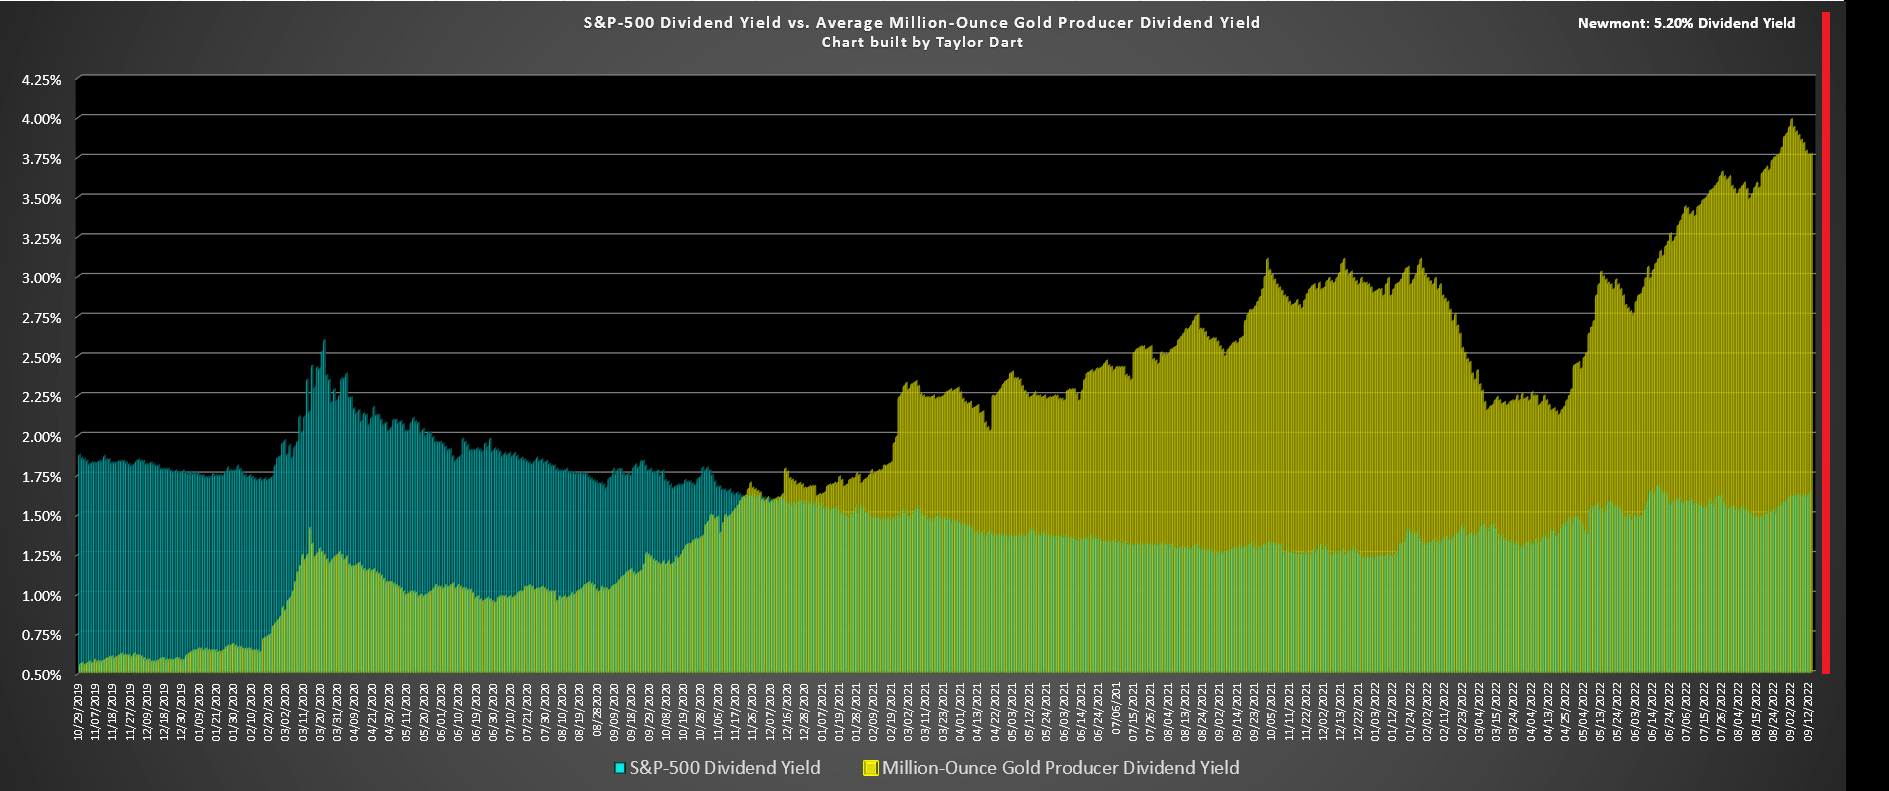
S&P-500 Dividend Yield vs. Gold Producers vs. Newmont (Company Filings, Author’s Chart)
Finally, in a period where the average dividend yield for the general market is still sitting below 2.0%, Newmont is paying 5.20% while the average million-ounce producer pays ~4.0%, a very intriguing setup that makes the sector quite attractive given that investors are being paid to wait for the gold price to turn around due to generous capital returns, unlike past cycles. In fact, the setup could not be more different from the past cycle when we had irresponsible and over-priced acquisitions on balance, less conservative gold price assumptions, and the sector destroying shareholder value due to costly write-downs.
If we combine this with the fact that Newmont is now sitting right near a potential major support level and the fact that we may have seen peak costs in Q2 2022 for the sector (high commodity costs, extreme labor tightness, lower denominator due to moderate production levels), I see reasons to be cautiously optimistic. So, if Newmont were to dip below $40.45 before year-end, I would view this as a buying opportunity.
Be the first to comment