

It’s been a strong start to Q2 for the gold miners (GDX), with the sector being over-represented in the 52-week highs list over the past couple of weeks. While technical strength in gold is undoubtedly a positive sign, were now beginning to see the $2,500/oz and $3,000/oz predictions come out of the woodwork, a typical symptom of short-term euphoria. Newmont Corporation (NEM) has been one of the top performers with the gold (GLD) price rise and is on track to deliver production growth and margin expansion through lower costs looking out to FY-2023. However, the stock is running into a multi-decade resistance level and is beginning to get overbought short-term. Based on this, I see no reason to be chasing the stock here, and I would view any rallies above $64.00 as an area to book some profits.
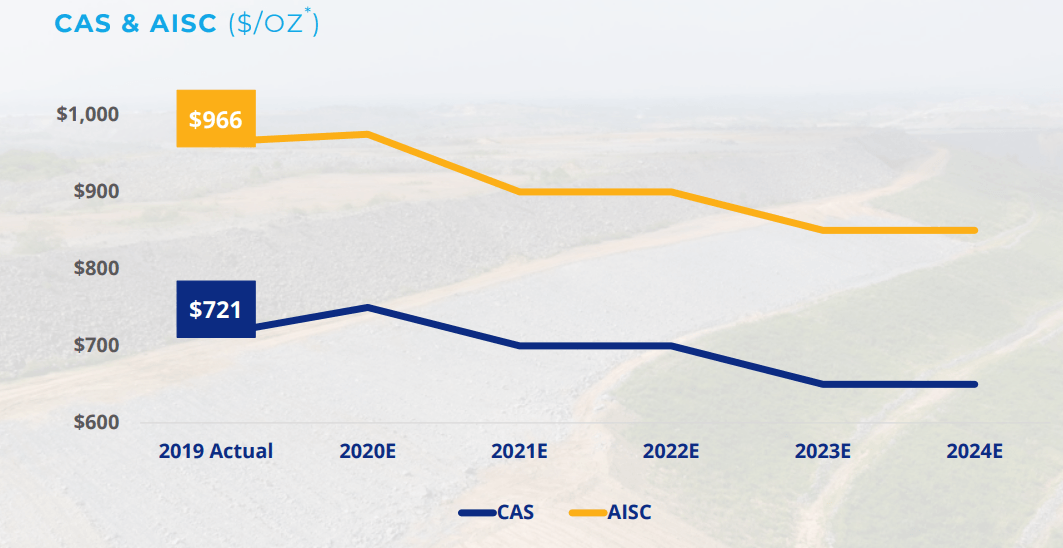
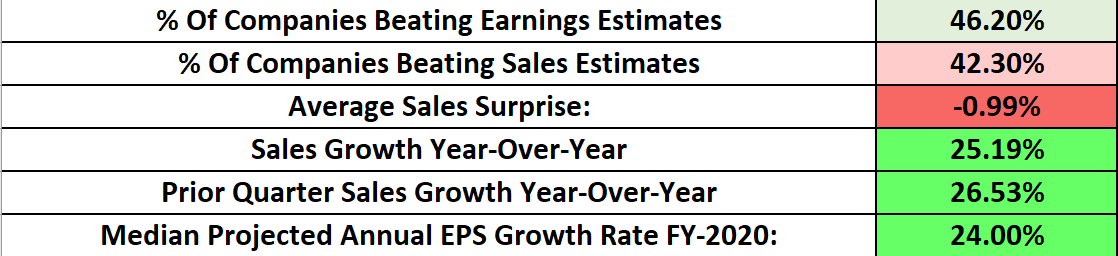
We just exited one of the best earnings seasons for the Gold Miners Index in years, with 25% sales growth year-over-year in Q4, and projected annual EPS growth rates of 40% on average for GDX constituents. While Newmont Corporation delivered exceptional operational results, with 6.3 million ounces of gold production in FY-2019 following the Goldcorp (GG) acquisition, the company fell behind the pack in the earnings department, with annual earnings per share roughly flat year-over-year. We also saw Newmont’s costs come in a little high relative to other gold majors, as Newmont’s all-in sustaining costs came in at $966/oz, 8% higher than Barrick Gold (GOLD) at $888/oz, and 3% higher than Agnico Eagle Mines (AEM) at $938/oz. The good news for investors, however, is that the market is forward-looking and is much more focused on the next 18 months, and this is where Newmont shines. Not only does the company hope to bring costs down to $900/oz in FY-2021, but the company is set to see an earnings breakout next year, with FY-2020 annual EPS estimates sitting above $2.00 per share. Let’s take a closer look below:
 (Source: Company Presentation)
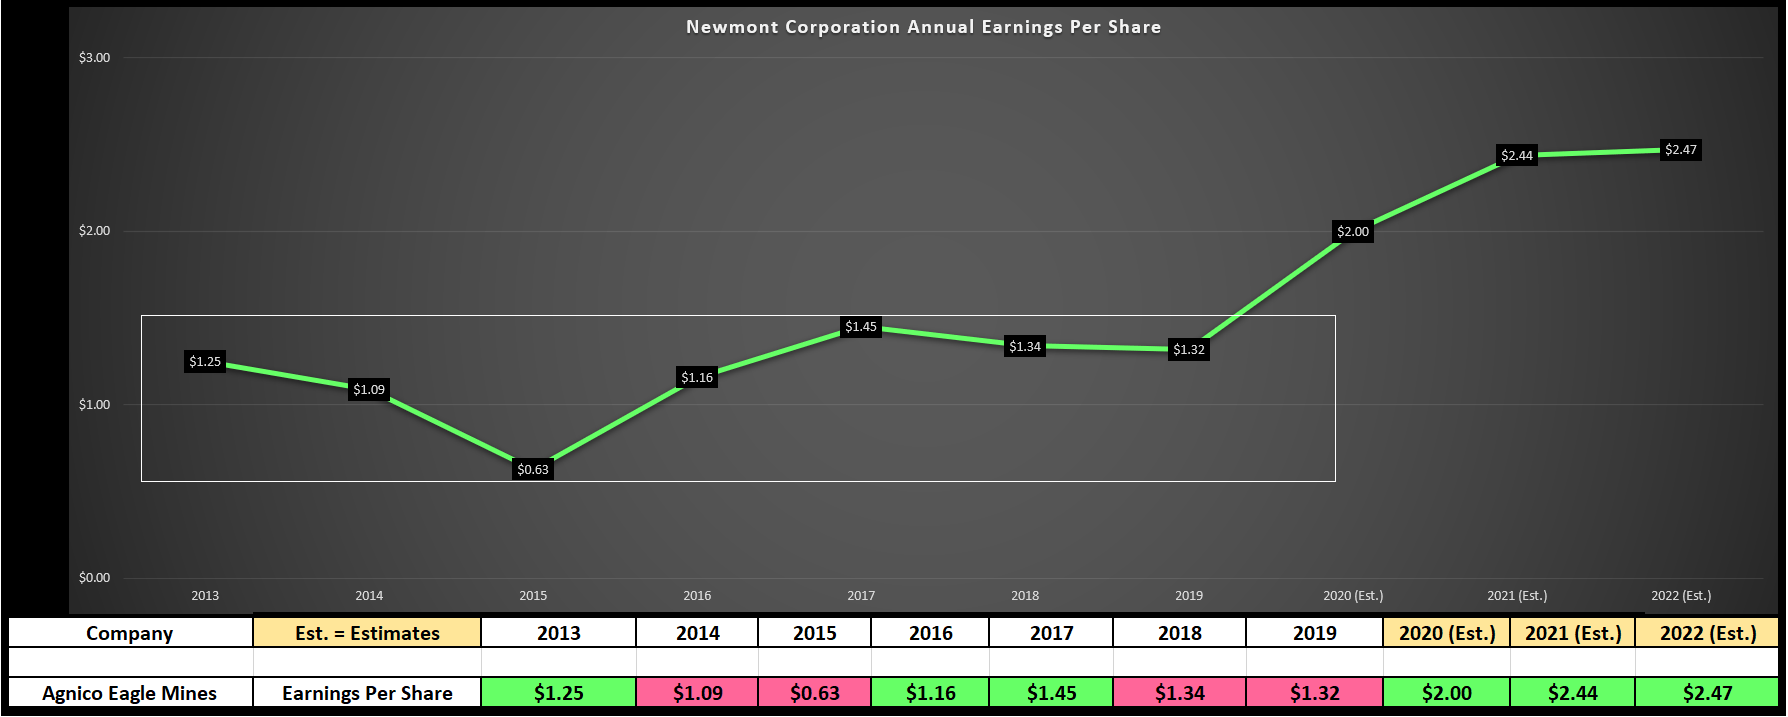
As we can see in the chart below, Newmont’s annual earnings per share have traded in a range the past several years, from a low of $0.63 in FY-2015 to a high of $1.45 in FY-2017. As noted, FY-2019 was a year of non-existent earnings growth with annual EPS dropping from $1.34 to $1.32, but this was a transitional year for Newmont as it absorbed the Goldcorp takeover. If we look ahead to FY-2020, however, annual EPS is expected to spike higher and should put in a new multi-year high, otherwise known as an earnings breakout. As we can see, FY-2020 annual EPS estimates are currently sitting at $2.00, forecasting 51% growth year-over-year. This is incredible growth, especially considering the lackluster earnings growth for most S&P-500 (SPY) companies given the shutdowns. Therefore, from a growth standpoint, there are few names in the S&P-500 as attractive as Newmont currently.
 (Source: Author’s Chart, YCharts.com)
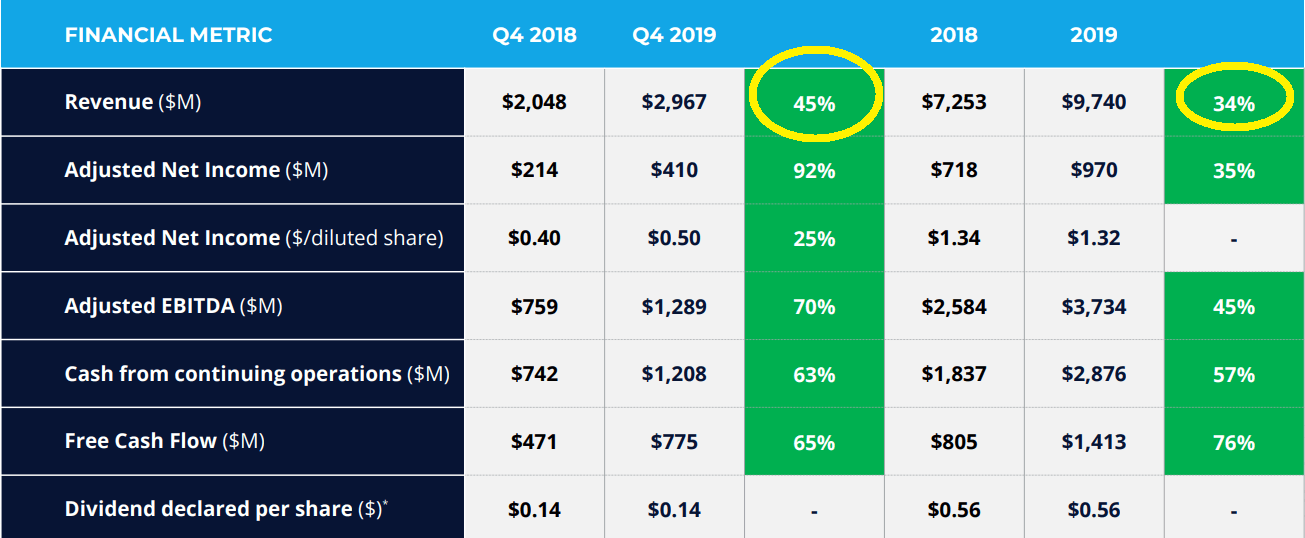
If we take a look at sales growth below, we can see a confirmation that this earnings growth is sustainable, given that revenues are rising at double-digit growth rates. The company’s Q4 2019 revenue came in at $2.97 billion, up 45% year-over-year, benefiting from more gold production with the addition of Goldcorp’s operations, as well as a higher average gold selling price. It’s worth noting that this figure was almost 2000 basis points above the industry average sales growth in Q4 of 25.2%. The biggest red flag for earnings growth is non-existent sales growth, as this tells us that the growth in annual EPS is coming from one-time items, tax benefits, or cost-cutting measures, and these are not drivers of sustainable long-term growth. Therefore, investors should be comforted to see that sales growth is showing up in a big way ahead of annual EPS growth and on track to continue with high gold prices, suggesting that these robust earnings growth rates are here to stay.
 (Source: Company Presentation)
 (Source: Author’s Chart)
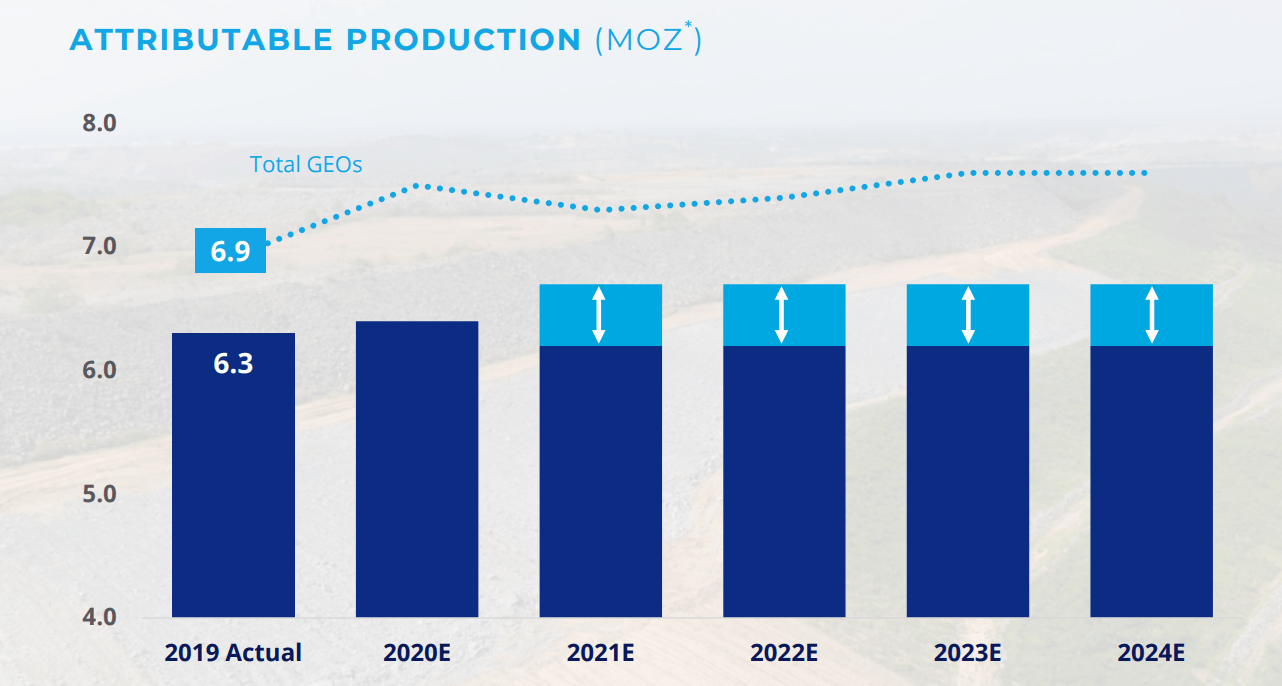
Based on Newmont’s FY-2020 guidance of 6.4 million ounces of gold production at $975/oz, we are likely to see a 1.5% jump in annual gold production, which should offset a 1% jump in costs. The real story, however, is the gold price, as the company’s average gold selling price was $1,399/oz in FY-2019. Assuming a floor going forward of $1,500/oz for the rest of the year, we would expect the company’s average selling price to come in at $1,550/oz or higher, a jump of over 10%. Thus far, while we have seen some interruptions in production from precautions surrounding COVID-19, the main two operations affected are Penasquito in Mexico and Yanacocha in Peru. Fortunately, these two mines combined make up less than 20% of the company’s total gold production, so we shouldn’t see a massive drag on gold production like Agnico Eagle is experiencing. However, if we were to see a second wave of viruses once social distancing rules are lifted, it is certainly possible we could see operations affected further.
 (Source: Company Presentation)
Given the company’s massive annual EPS growth in FY-2020, commitment to lower costs over the next few years, and position as the leading gold major in the sector, one might think it’s time to rush out and buy the stock. However, I believe a good chunk of this positive news is priced into the stock short-term, given that Newmont is up 80% in the past four weeks. Besides, the stock is now beginning to get extended short-term if this rally continues. Let’s take a closer look below:
 (Source: JuniorMiningNetwork.com)
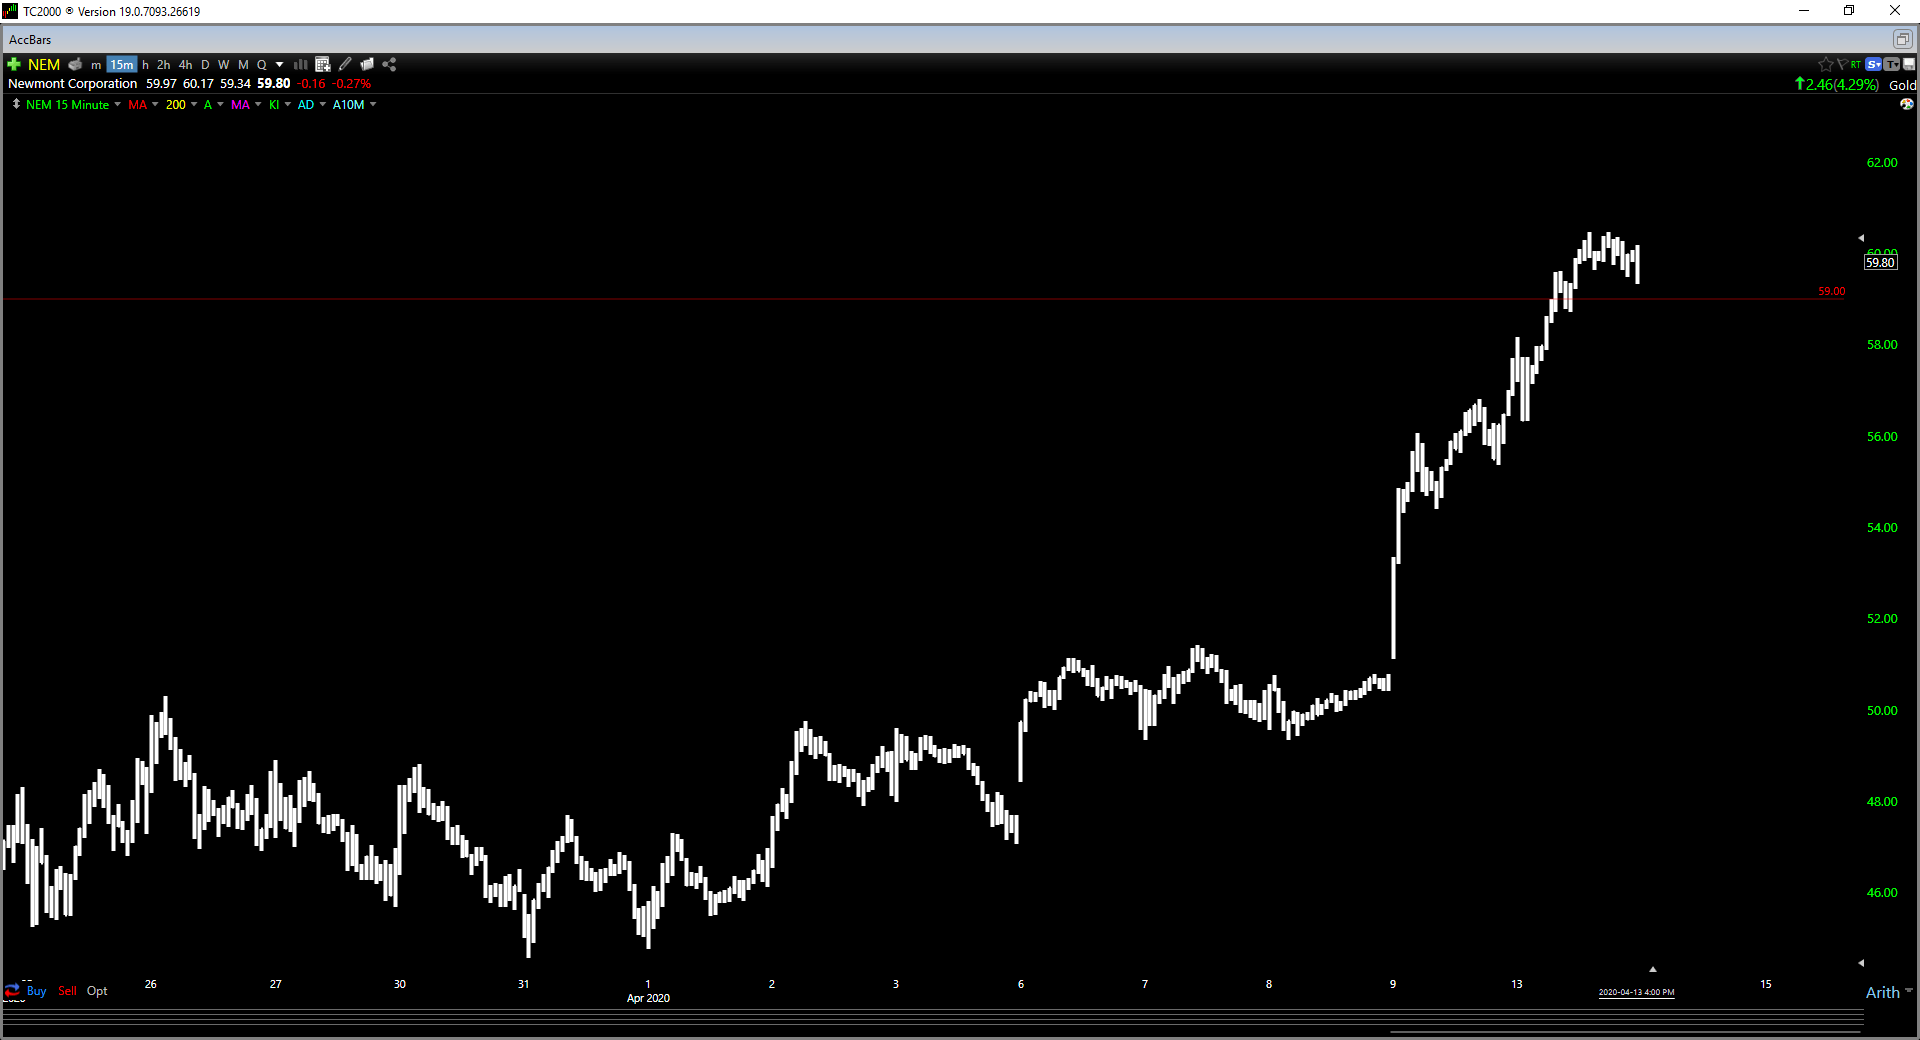
As we can see below, Newmont is banging up against the $60.00 level, an area that had been a brick wall of resistance previously. While it’s possible that the could finally get through this level, it’s worth noting that the stock failed here in the past at higher gold prices in 2011, and buying at this level had typically been a recipe for disaster. This is because corrections from this resistance area have averaged 20% or more over the following five months in the past four occasions. Just because we’ve had trouble here in the past does not mean we have to this time around, but I would be surprised if the bears gave up here without a fight.
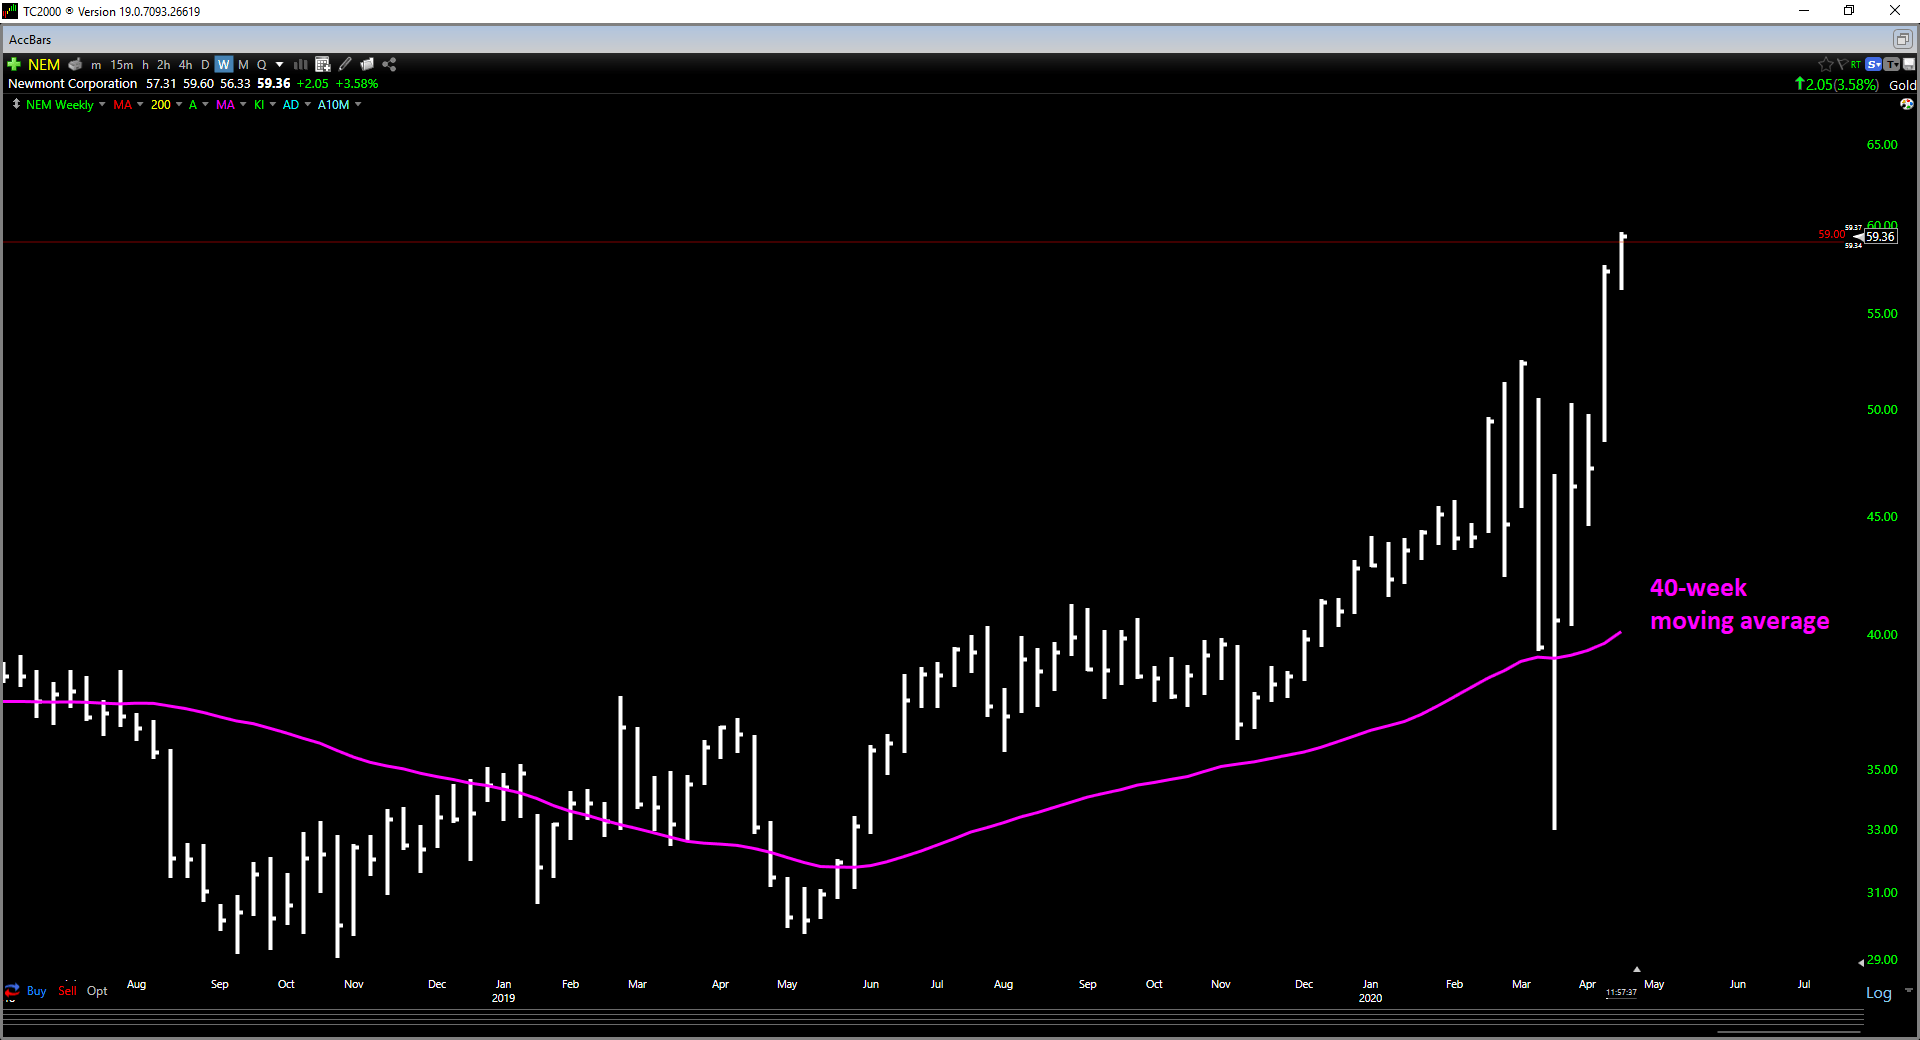
 (Source: TC2000.com)If we zoom in on the weekly chart a little closer below, we can see that Newmont is also extended short-term, sitting more than 35% above its 40-week moving average. Typically, it rarely pays to chase stocks more than 35% above their 40-week moving average, and I would be surprised if this time were different for Newmont. The last time this occurred was in January 2018, and the stock corrected over 25% the next six months.
 (Source: TC2000.com)
Given the fact that few S&P-500 stocks are boasting 50% annual EPS growth rates for FY-2020, Newmont is undoubtedly a name worth keeping a close eye on during sharp pullbacks. Not only does the gold miner have a competitive dividend, and robust sales growth, but the strength in gold is now providing a tailwind to margins. However, stocks rarely go up in straight lines, especially with a mountain of resistance on the horizon, and this means that chasing Newmont above $60.00 is probably not the best idea for traders. If this rally were to continue, I would view any rallies above $64.00 before June as an area to book some profits.
Disclosure: I am/we are long GLD. I wrote this article myself, and it expresses my own opinions. I am not receiving compensation for it (other than from Seeking Alpha). I have no business relationship with any company whose stock is mentioned in this article.
Additional disclosure: Disclaimer: Taylor Dart is not a Registered Investment Advisor or Financial Planner. This writing is for informational purposes only. It does not constitute an offer to sell, a solicitation to buy, or a recommendation regarding any securities transaction. The information contained in this writing should not be construed as financial or investment advice on any subject matter. Taylor Dart expressly disclaims all liability in respect to actions taken based on any or all of the information on this writing.
Be the first to comment