

Photon-Photos
It’s been a rough year for the Gold Miners Index (GDX), and the Australian producers have just finished releasing their financial results in FY2022 (June 2021 to June 2022). Newcrest (OTCPK:NCMGF) was one of the most recent names to report and put together a decent year given the industry-wide challenges, but costs did increase sharply. Fortunately, we should see a significant production increase and moderate cost improvement year-over-year, even with lower copper prices. With Newcrest having a bright future, a more diversified portfolio, and now trading at a high single-digit free cash flow yield, I expect further weakness to present a buying opportunity.

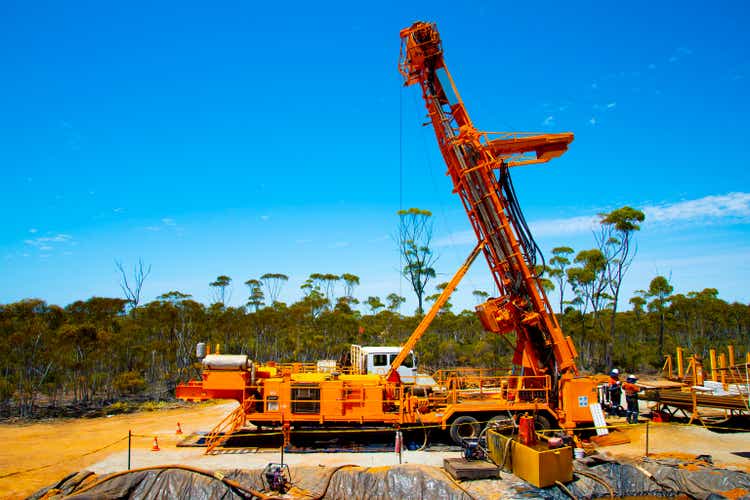
Brucejack Operations (Company Presentation)
Production & Costs
Newcrest released its FY2022 results last month, reporting fiscal Q4 production of ~637,000 ounces of gold, helping it to deliver into the low end of its FY2022 guidance. On a full-year basis, gold production came in at ~1.96 million ounces, a 6% decline year-over-year, with copper production down more than 15% to ~120,700 tonnes. While these results look disappointing on the surface, it’s important to note that this was a tough year for the industry with supply chain headwinds, labor tightness, and in Newcrest’s case, major maintenance at its two largest assets (Lihir, Cadia). The good news is that the company is entering FY2023 with a fifth mine under its ownership, which has increased its production from Tier-1 jurisdictions.

Newcrest – Quarterly Production by Mine (Company Filings, Author’s Chart)
Looking at the chart above, we can see that Brucejack (white bar) delivered a solid performance in fiscal Q4, producing over 90,000 ounces of gold at $1,083/oz, and generating ~$88 million in free cash flow in the last four months of FY2023. This asset is forecasted to produce up to 350,000 ounces this year, a major boost to production, which will reverse the declining consolidated production trend since FY2019. The other benefit next year will be a return to FY2021 production levels at Lihir combined with a much lower cost year at this asset. Finally, assuming Newcrest can deliver into guidance, copper production is expected to hit record levels at ~145,000 tonnes.
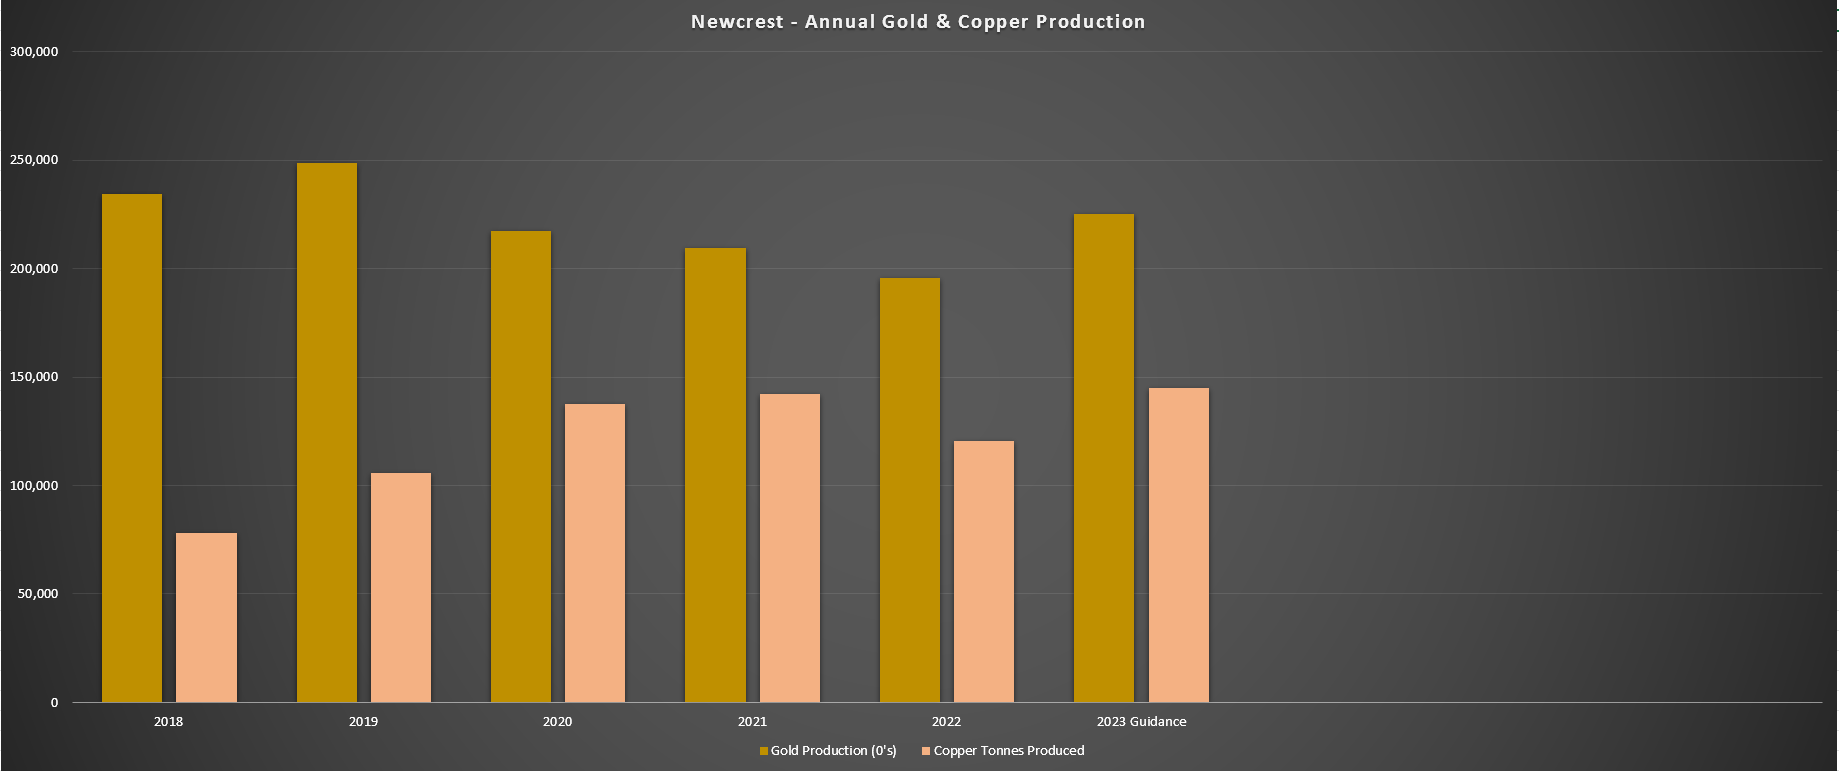
Newcrest – Annual Gold & Copper Production (Company Filings, Author’s Chart)
Given this improving trend in production, I believe it’s more than warranted to give Newcrest a pass on the weaker FY2022 results, which marked the third consecutive year of declining gold production. Besides, when it comes to Brucejack, the ~350,000-ounce production profile at ~$1,000/oz costs looks like it can be improved upon. This is because the company expects $20 million in synergies (contract synergies, travel logistics with Red Chris), with an additional ~$16 million in synergies from its EDGE program, expected to lead to more efficient mine operations (improved stope turnaround times). Lastly, the company is exploring the possibility of bumping up annual throughput by ~25%, pushing production above the 400,000-ounce mark.

Brucejack Mineralization (Company Presentation)
Fortunately, while production was lower year-over-year, Cadia carried Newcrest again in FY2022, delivering record all-in-sustaining costs of (-) $124/oz. This helped to keep the company’s costs and balance the expensive year at Lihir (AISC: $1,622/oz), which was impacted by increased sustaining capital exacerbated by lower production. On a consolidated basis, this translated to respectable all-in sustaining costs [AISC] of $1,043/oz, though this figure was up 14% year-over-year and ~41% from pre-COVID-19 levels (FY2019: $738/oz).
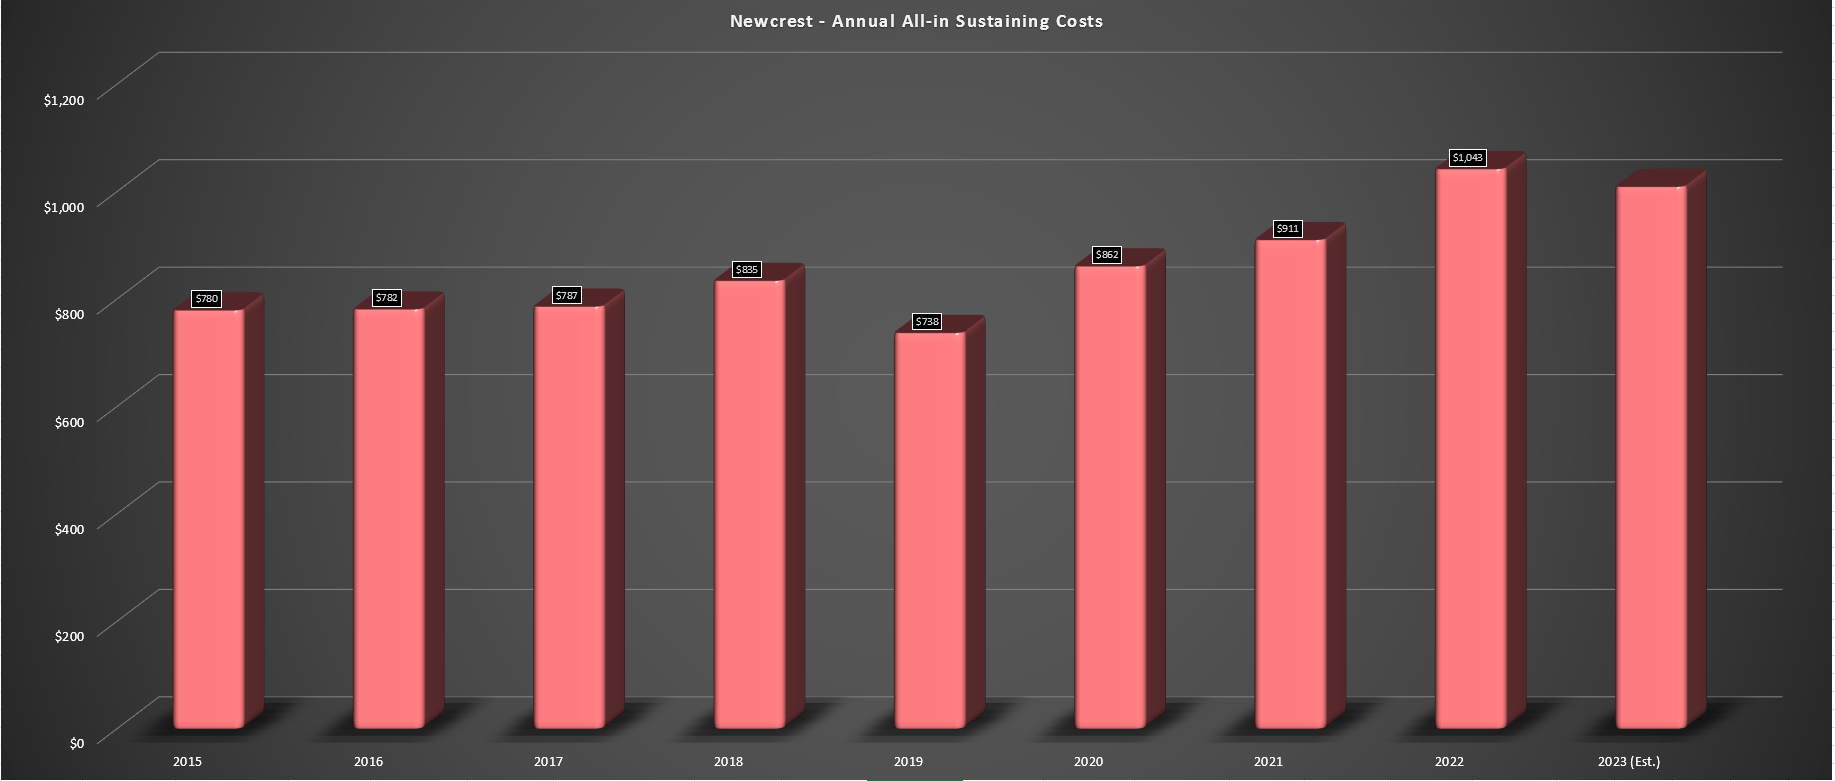
Newcrest – Annual All-in Sustaining Costs (Company Filings, Author’s Chart & Estimates)
A significant portion of this cost increase was out of Newcrest’s control, with Australian miners impacted by a tight labor market and all producers hit by rising diesel, materials, and labor costs, exacerbated by supply chain headwinds. While Newcrest expects these headwinds to continue (6-8% impact in FY2023), this will be offset by higher copper tonnes produced, lower operating costs at Lihir, and declining costs at Brucejack ($1,000/oz vs. $1,125/oz). So, assuming Newcrest can deliver into guidance and produce over 2.35 million ounces of gold, we should see the company’s all-in sustaining dip back below $1,000/oz in FY2023.
Financial Results & FY2023 Outlook
Moving over to the annual financial results, Newcrest saw a sharp decline in operating cash flow ($1.68 billion vs. $2.30 billion), impacted by higher costs and lower sales volume in FY2022. This led to a significant decline in free cash flow, with annual free cash flow sinking from ~$1.1 billion to (-) $868 million in the period. While another year of heavy spending is ahead and the company has several major projects on deck (Red Chris Block Cave, Lihir Phase14A, Havieron Stage 1), which will weigh on free cash flow, we will see a return to positive free cash flow next year, helped by the addition of another mine. It’s also worth noting that free cash flow came in at $229 million, excluding the Pretium acquisition, so it wasn’t nearly as bad as the below chart suggests.

Newcrest – Annual Operating Cash Flow & Free Cash Flow (Company Filings, Author’s Chart)
Some investors might be disappointed with the outlook of similar free cash flow to FY2019 levels and much higher costs in FY2023 (~$1,000/oz vs. $738/oz), which is understandable from a headline standpoint. However, it’s important to note that Newcrest is aggressively investing in its future (FY2023 spend: ~$1.55 billion) and aiming to become the world’s lowest-cost gold producer if it can execute successfully. As the chart below shows, Newcrest seems confident that it can push costs below $750/oz by FY2025 and $600/oz by FY2029, which would place its operating costs more than 30% below the million-ounce producer average (FY2025 estimates: ~$1,100/oz).
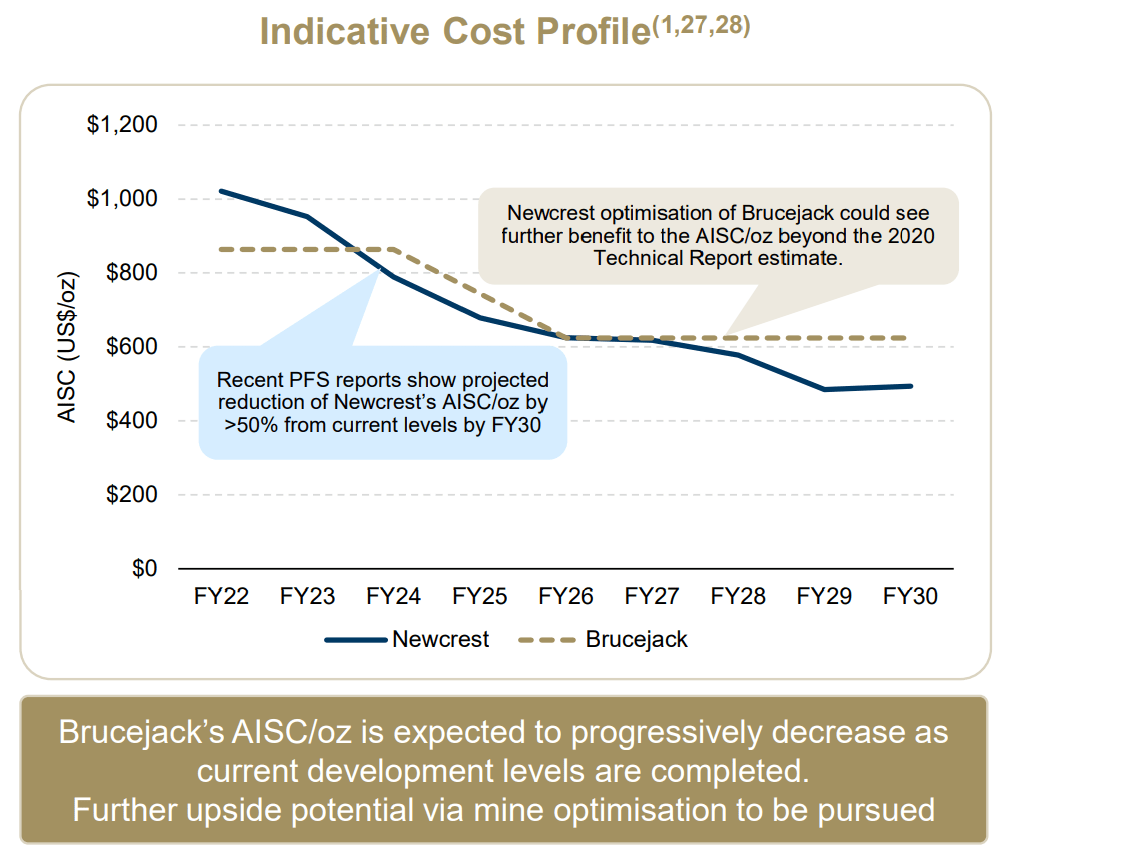
Newcrest – Long-Term Cost Outlook (Company)
I believe these forecasts to be quite ambitious, especially the FY2025 figure of sub $750/oz costs, though a lot depends on the copper price. That said, even if Newcrest misses these estimates and can pull costs down below $875/oz in FY2025 (estimates according to chart: sub $750/oz), it would still take the crown as the lowest-cost producer, which could lead to a re-rating in the stock and a higher P/NAV multiple. Longer-term, sub $750/oz costs look doable, placing it head and shoulders above its peer group. So, while I think a P/NAV multiple of 1.25 makes sense currently (less diversification than peers, elevated capital expenditures), multiple expansion to 1.40x P/NAV is possible post-2025 even with its current portfolio (five mines).
Valuation & Technical Picture
Based on ~895 million shares and a share price of $12.10, Newcrest trades at a market cap of ~$10.8 billion and an enterprise value of $13.0 billion. If we compare this figure with Newcrest’s estimated net asset value of ~$13.0 billion, Newcrest trades at a slight discount to NAV, which is rare for a multi-million-ounce producer with most of its production coming from Tier-1 jurisdictions (Canada, Australia). This discount to net asset value is even more surprising given that Newcrest could reduce its AISC to sub $850/oz by FY2025, even under the assumption that some inflationary pressures like labor remain sticky.
Red Chris Operations (Company Presentation)
Based on this valuation, Newcrest remains attractively valued, with the stock easily able to command a P/NAV multiple of 1.25, given its solid margins and relatively low jurisdictional risk, offset by being less diversified than its peers (5 mines, with two mines contributing over 60% of production). Based on this P/NAV multiple, I see a fair value for the stock of US$18.20 per share [A$26.30], or roughly 50% upside from current levels. Let’s take a look at the technical picture:
![Newcrest Daily Chart [ASX]](https://static.seekingalpha.com/uploads/2022/9/10/45984866-16628109682627482_origin.png)
Newcrest Daily Chart [ASX] (TradingView)
While Newcrest has become more attractive from a valuation standpoint, dipping to a more significant discount to net asset value, we’ve seen a negative development from a technical perspective. This is based on the broken A$19.60 [US$13.50] support level, a previous critical area of support for the stock. While this doesn’t mean that the stock must head lower, the next strong support area sits at A$14.30 [US$9.90], and the mid-point of the lower resistance levels (A$22.80/A$19.60] is A$21.20 [US$14.60]. So, with the stock currently trading at US$12.10, it is in the middle of its support/resistance range.
The slight degradation in the technical picture following the support break is not a huge issue for long-term investors, and I would pay much more attention to valuation than support/resistance levels. So, if I were looking to add to my position, the low-risk buy zone has now slid to A$15.90 [US$11.00] from US$13.30 previously. Hence, while I see the stock as a Hold, I would be patient if I were looking to top up an existing position if I were concerned about further drawdowns.
Summary
Newcrest put together a solid year given the challenging operating environment and completed a major acquisition to transform its portfolio. While I think exercising patience like Barrick (GOLD) has would have paid off handsomely from an M&A standpoint, given that it paid a significant premium to NAV, with the mid-tier group now trading at 0.75x P/NAV, this is an incredible asset. So, I can understand Newcrest’s decision to lock up the asset, especially once the Golden Marmot discovery was announced. In fact, it likely could have locked up Skeena (SKE) and Pretium (PVG) for the price paid for Brucejack if it had waited nine months, adding ~650,000 GEOs per annum in British Columbia by 2027 vs. ~350,000.

Brucejack Operations (Company Presentation)
Ignoring my opinion of its recent acquisition, Newcrest has a bright long-term future, especially if copper prices remain above $9,000/tonne. This is because the company is seeing growing production at lower costs and now trades at a high single-digit FY2023 free cash flow yield, a deep discount to its historical multiple. Given this attractive valuation combined with a low-risk portfolio that’s now more diversified with tremendous exploration upside with the addition of Brucejack, I would view further weakness as a buying opportunity.
Be the first to comment