

eyecrave
New York Mortgage Trust (NASDAQ:NYMT) invests up and down the housing market. From multifamily (32% of total portfolio) to single family mortgage products (40% Agency 40%, 8% Non-Agency), NYMT is a housing lender/investor. There is a Freddie Mac commercial mortgage security held (1%) and a catch-all bucket of Other that includes “business-related” housing loans like “fix and flip”, rentals, other multifamily assets, mortgage servicing revenues, etc. (19%).
There is only $2.55MM in real estate owned in June 2022 versus $2.05MM in December 2021, representing a literal rounding error in an almost $4BN residential portfolio. These have generally been sold at a profit given the record equity supporting the housing market today.
What’s wrong with this portfolio that it deserves to trade at $2.45 when Wall St. estimates the current NAV (net asset value) at $3.93 per share (Source: Koyfin), a 38% discount?
Let’s take a dive.
NYMT Portfolio Quality
We know 40% represents investment in quasi-US government guaranteed mortgages – the best quality one can own. But what NYMT holds is more than just the whole loan, they hold some volatile loan slices called IOs, sort of like side bets on a football game. We will discuss in greater detail.
8% is non-agency, primarily non-mark-to-market home loans and investment securities we will discuss in greater detail because I found a lot of side bets here, too.
Multifamily makes up 32% percent of the portfolio. We know multifamily has been on fire in the good way, but what is the overall quality of this portfolio? We know some is Freddie Mac quasi-government, but not much more.
The very small commercial mortgage is a Freddie Mac multifamily loan securitization that is solid, leaving that 19% catchall:
NYMT Q2 2022 Other Assets (NYMT 2022 Q2 form 10-Q)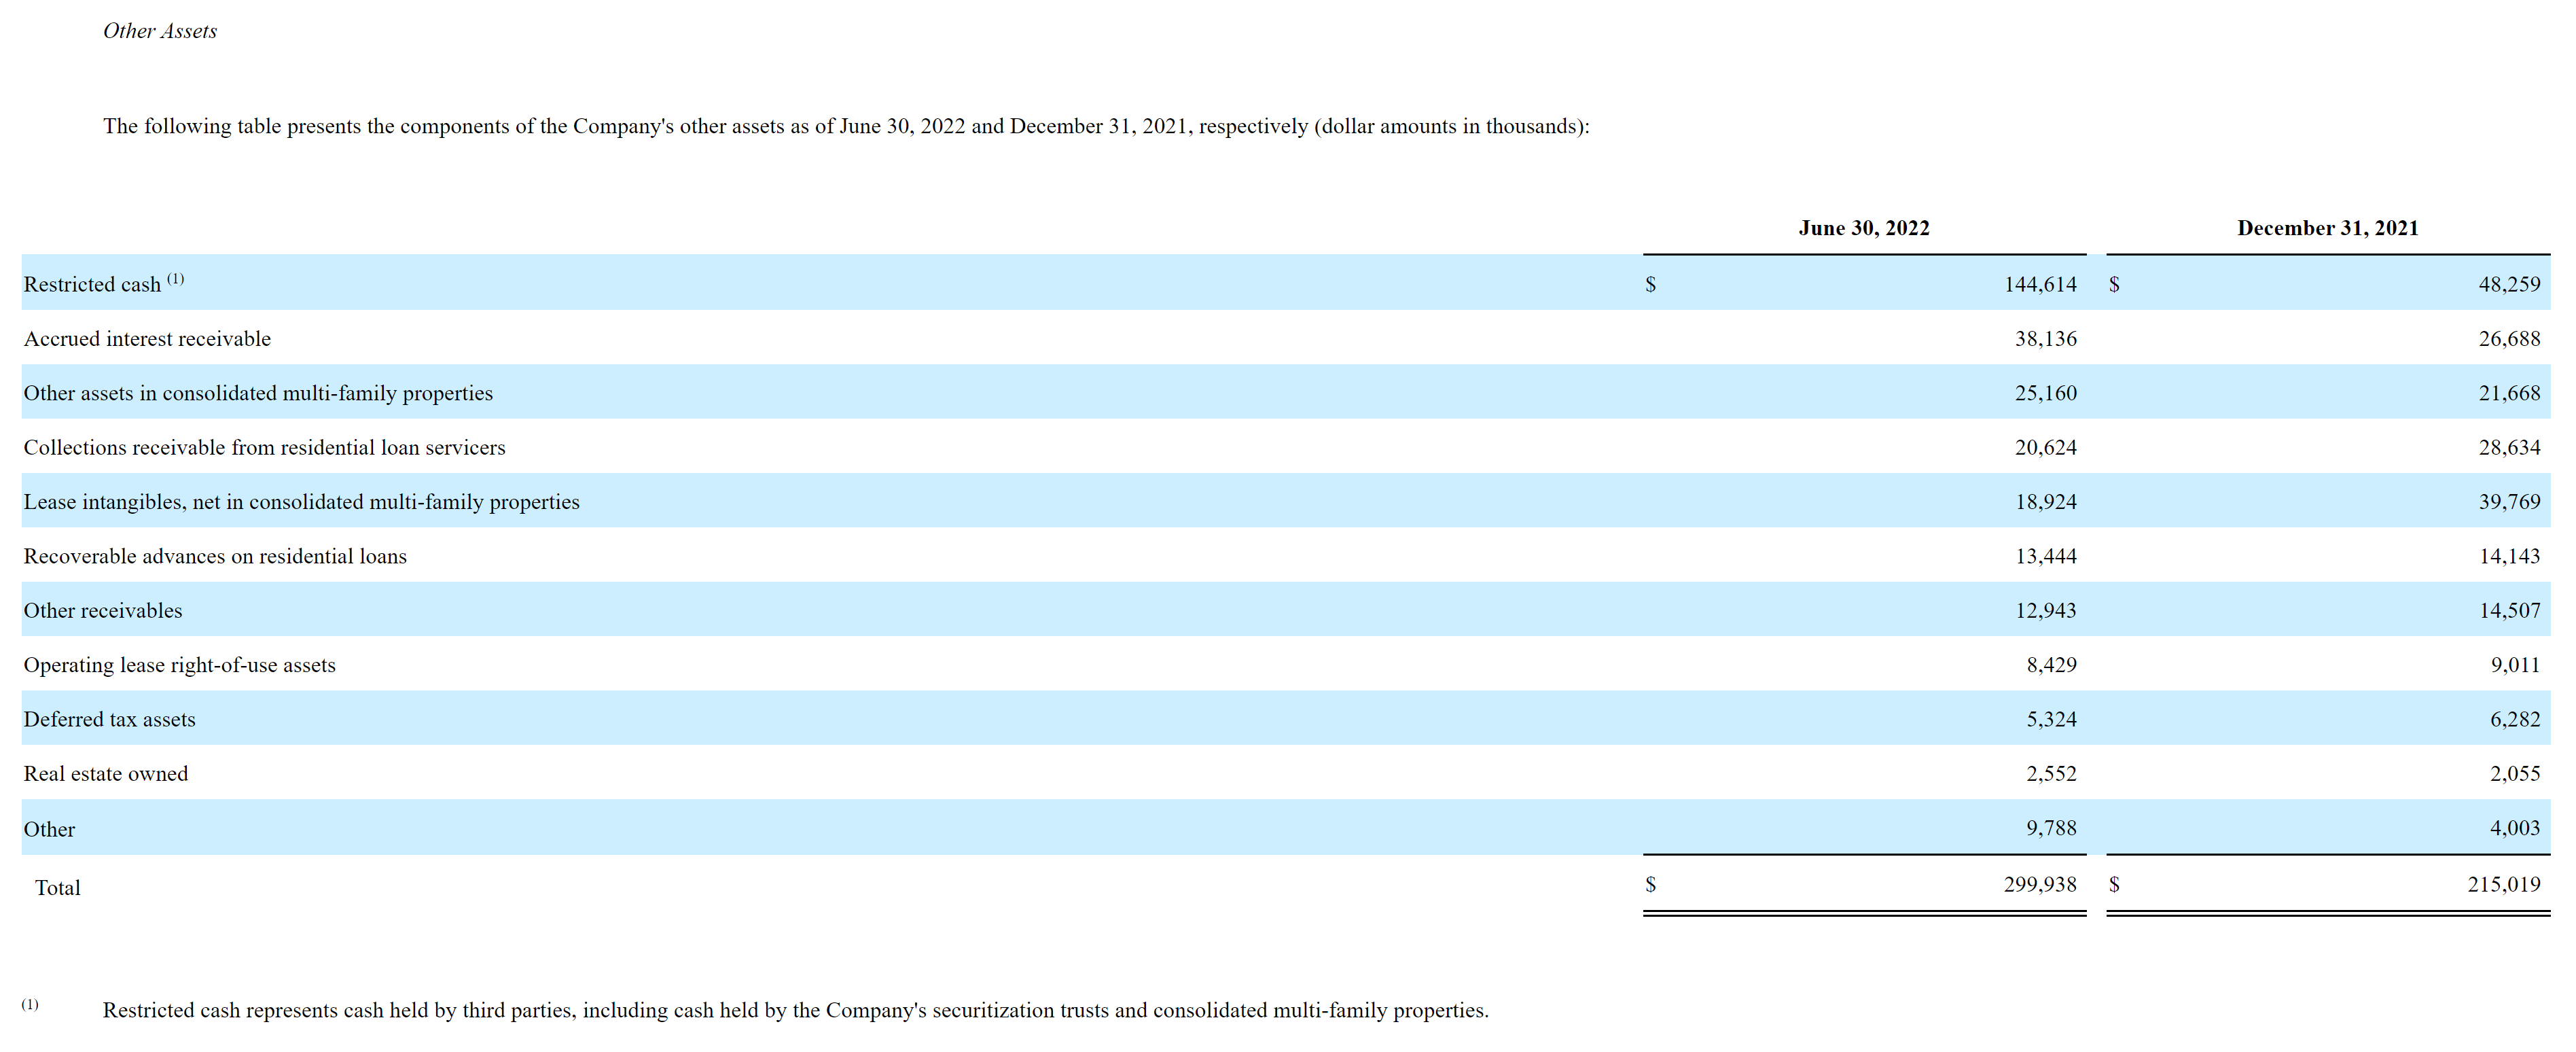
Not much to see other than accrued flows running through the mortgage servicing rights and other normal course of business issues.
Agency Mortgage Assets
NYMT buys more than just agency loans, it also buys asset back bonds secured by these loans. These usually come from specialized financing vehicles (SPEs) in which a lender or asset holder like NYMT contributes a pool or pile of Agency mortgages to the SPE. The SPE carves the pool into slices that have varying claims on the cash flows (interest, prepayment fees, principal) from the pool in exchange for absorbing any problems that might crop up within the SPE loan portfolio. These range from the most protected AAA rated slices to the wildest pieces that include things like interest only, inverse interest only and first loss reserve slices – exotic stuff in both the dowdy Agency market and in NYMT’s asset portfolio.
By wild, we mean volatile. For example, interest only means if interest payments are deferred or defaulted, that’s your entire income stream on that slice – you are in far more trouble than someone who owns both the interest and the claim on the principal loan amount (far more secure in the moment). A first loss reserve means if there are defaults (losses), it comes out of your slice first and is only recoverable if the value lost is later recovered – can be a really bad or really good place to be.
We are focusing on the exotica because in volatile markets, holding these the wrong way can have outsized negative effects. What are they holding and how is it pointing?
NYMT Assets (NYMT 2022 Q2 form 10-Q)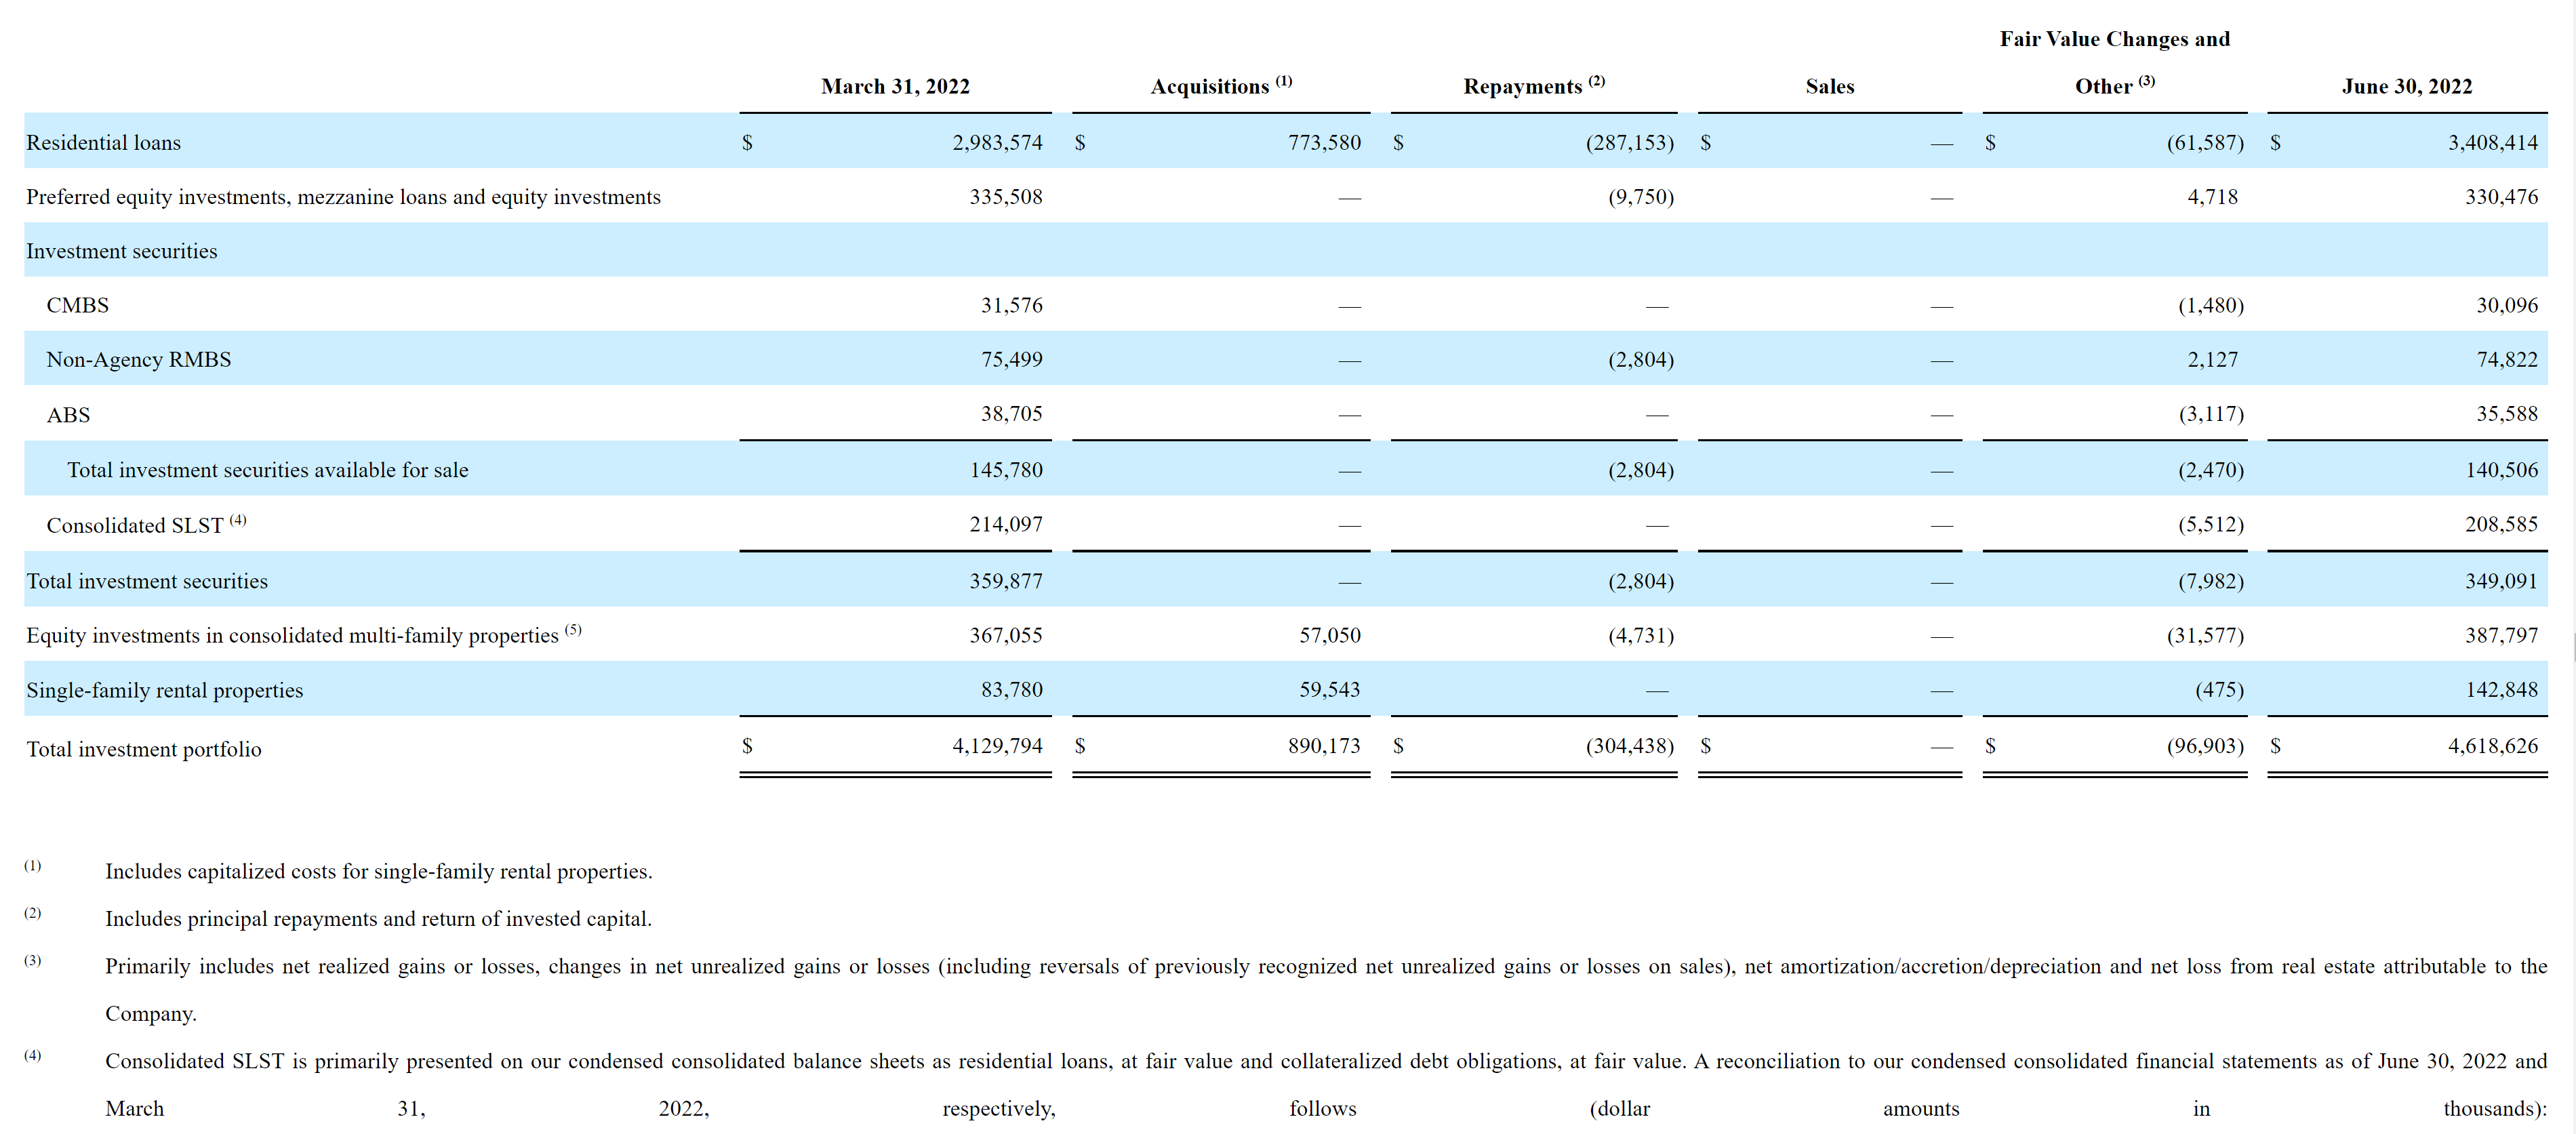
We are going to focus on the Consolidated SLST line (defined, below) which comprises less than 5% of the total residential portfolio, but how much of the common equity cushion would that eat? Almost 25% at today’s share price – big bite.
SLST is formed when:
“The Company invests in subordinated securities that represent the first loss position of the Freddie Mac-sponsored residential loan securitization from which they were issued, and certain IOs and senior securities issued from the securitization.”
That’s what we call high leverage exotica because small moves against your position have high leverage effects on the results. This demands an examination of the housing market risks in the coming recession.
The rest of this portfolio is solid gold.
Non-Agency Mortgage Assets
Similar to the Agency without the government guarantee. All loans are performing fine, but there’s SLST here, too – about 40% of the $50MM in non-agency residential mortgage backed securities (RMBS), or another $19MM in SLST exotica. This could eat almost another 20% of the equity if wiped out.
Otherwise, NYMT has shrunk this part of their portfolio since 2021.
Multifamily Mortgage Assets
Here we get a variety of participation slices that range from a standard mortgage to effective equity ownership.
Multifamily Portfolio Summary (Q2 2022 Investor Presentation)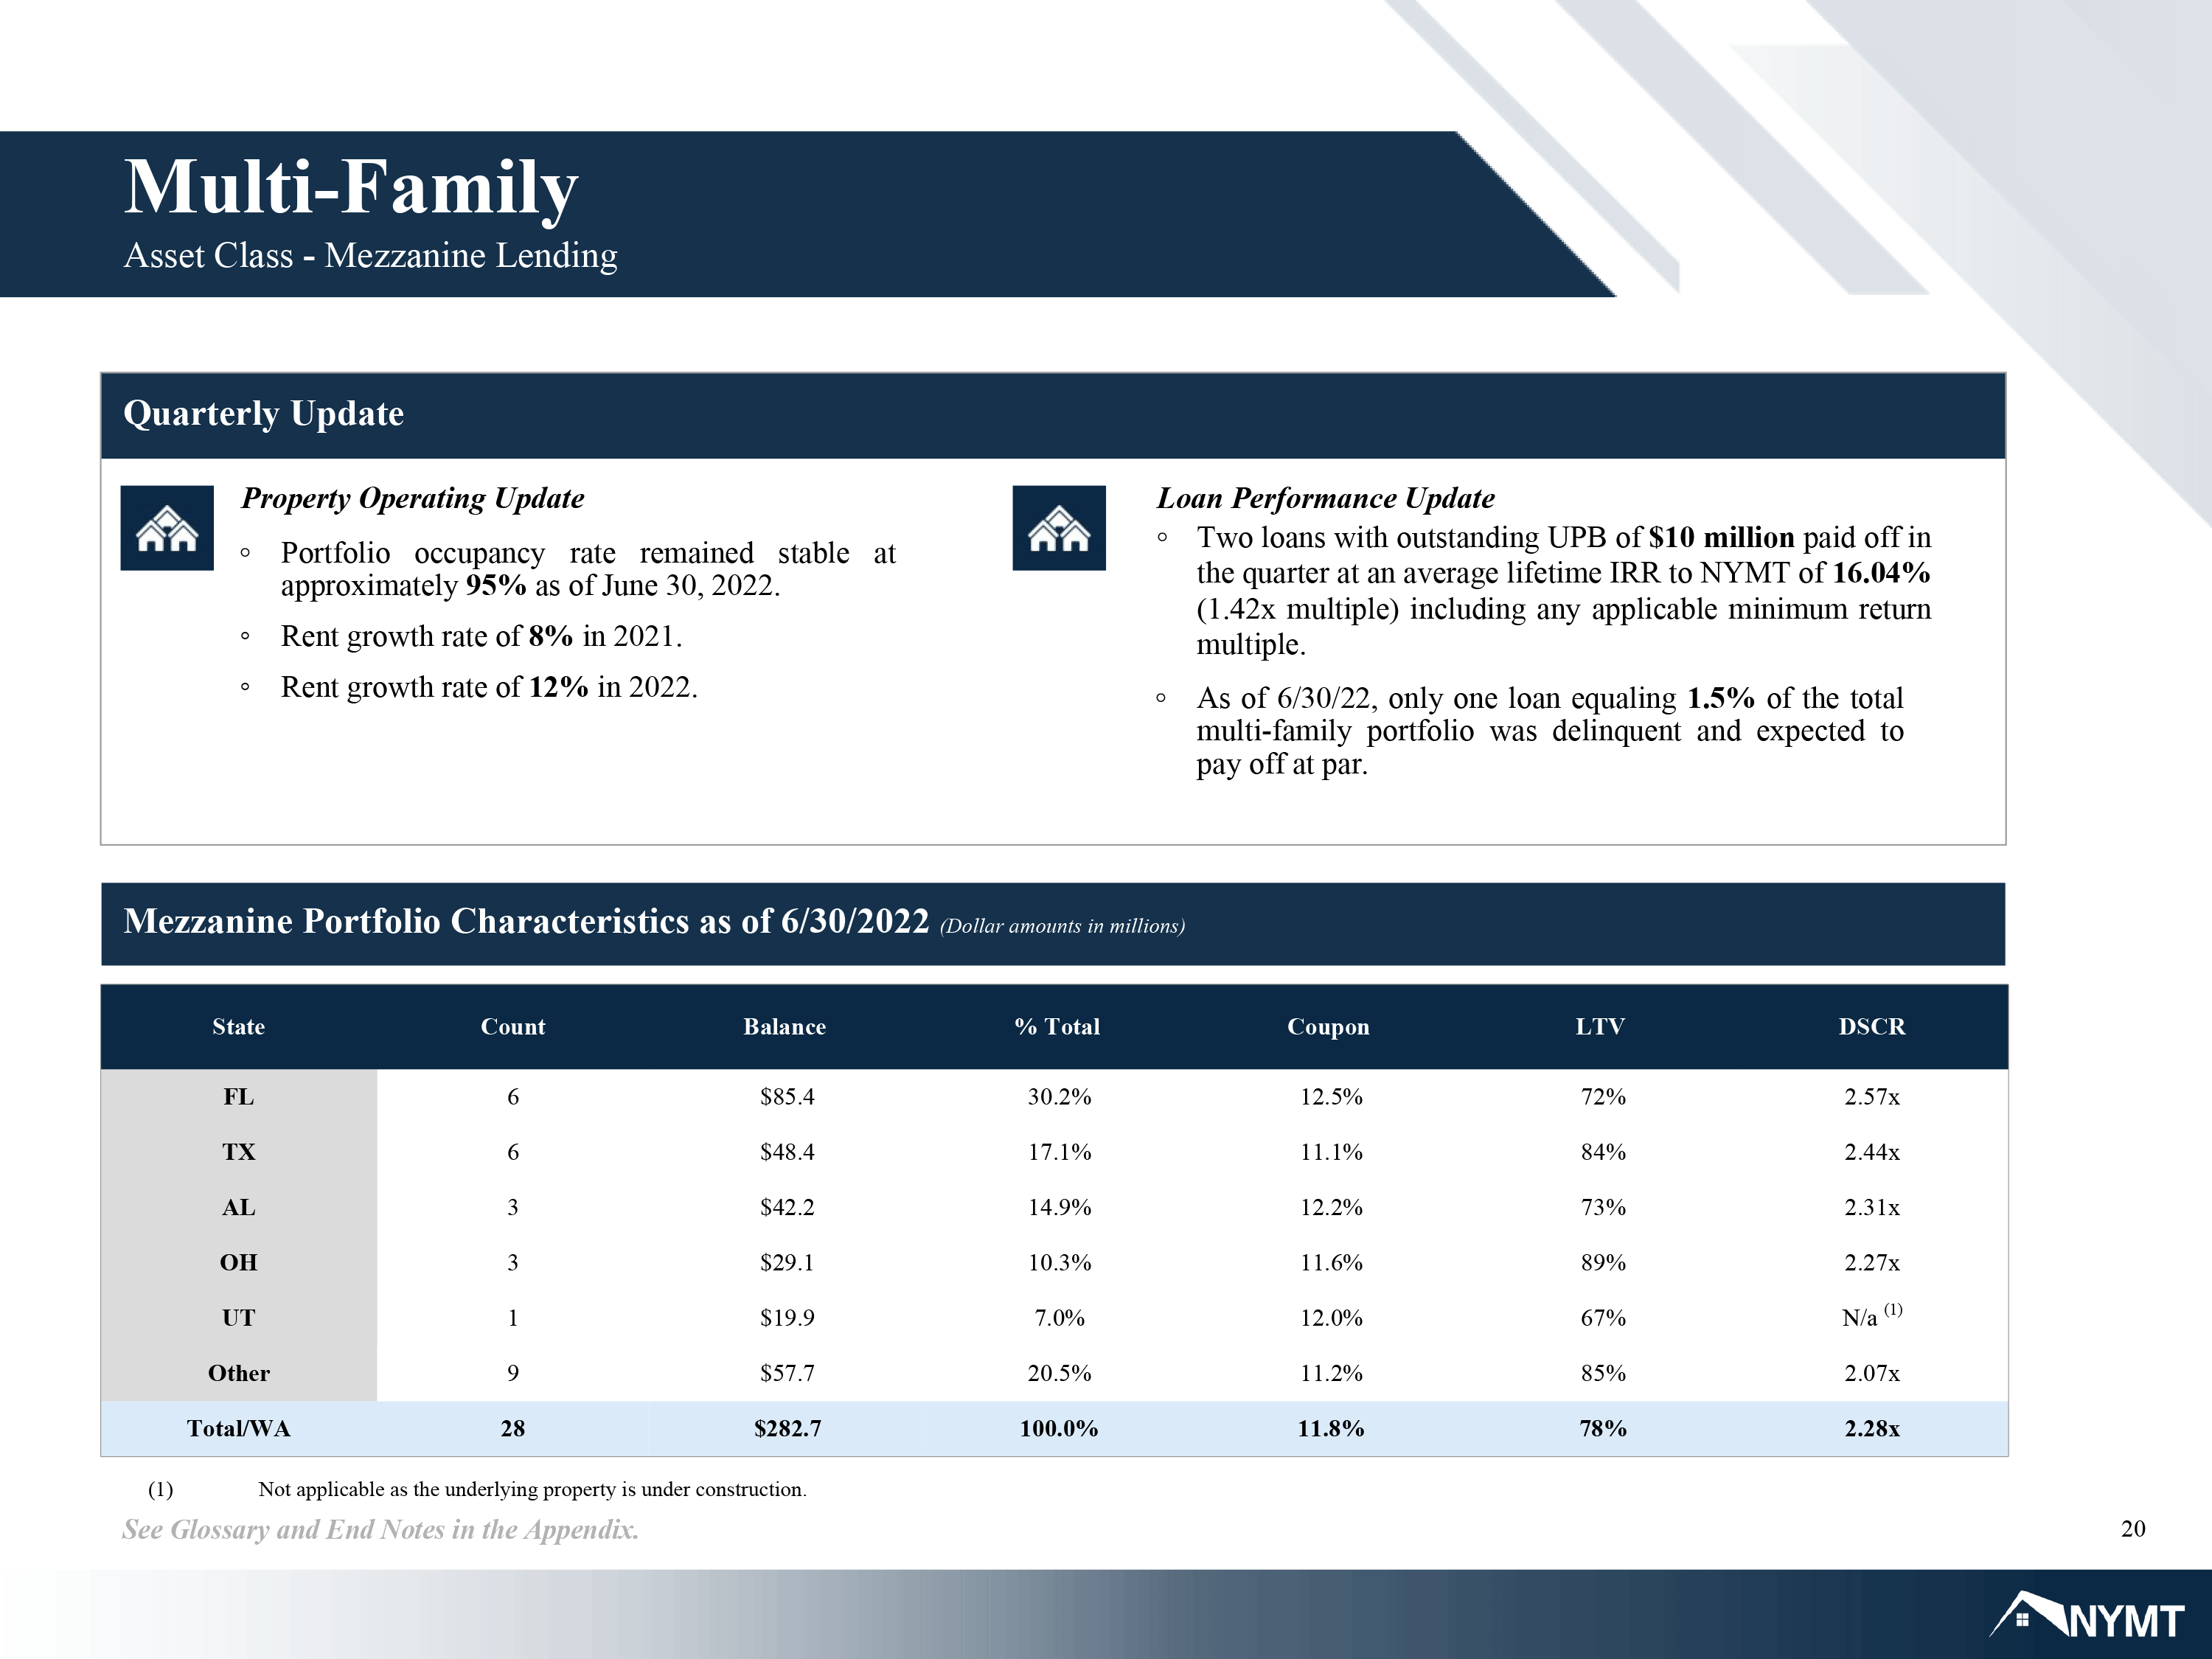
We have some very good metrics here. Relatively high occupancy with 12% rent growth in 2022 already (ahead of inflation) with 2 loans having fully repaid and only one out of 28 loans struggling enough to be delinquent. One might wonder whether any of the 8 Floridian properties experienced uninsured damage by Hurricane Ian. That we have heard nothing is likely good news because insurance filings have happened by now.
We would also like to observe that LTV, or loan to value, might look high. Those assets are not marked-to-market for current value. Since we know how rent has risen the past two years for NYMT (20%), we can imply better loan to value ratios than reported in their financial statements.
Asset Conclusions
Any discussion about a residential mREIT must start with asset quality. NYMT has a systematically more risky asset portfolio than an Agency REIT like Annaly (NLY) or AGNC (AGNC) whose portfolios are 90%+ quasi-government guaranteed assets.
NYMT holds 40% with bulk of the rest in harder to score assets. The good news is the following:
- Housing values are high.
- With the vast bulk of existing mortgages fixed rate in the 3% range or less, interest rate rises do not affect mortgage holder ability to pay.
- Employment is so high the Fed is free to raise rates until unemployment or a liquidity crisis interrupts the process.
- Demand for housing is very high with supply constrained and years behind in catching up.
- Even a 10% decline in housing values would not materially increase defaults.
- Executive Chairman Steven R. Mumma has been there in a variety of roles through all the changes. I found nothing negative on sites like Glassdoor.
There’s risky news here too:
- Almost 8% of the portfolio holds exotic pieces of mortgage pools that could have outsized effects on the common stock.
- Equity ownership in multifamily properties is not nearly as secure as being the mortgage lender only.
- The company provides no color on multifamily asset class or quality.
On a scale of 1 to 5 where 1 is the least risky residential mREIT (AGNC would be our model 1 with NLY at 1.5), we consider this a comfortable middle-of-the-road 3.
We assign a positive tailwind to the 3 because the exotica is generally pointing in the right direction, giving us a 2.8.
What do we mean?
IOs and First Loss Slices
IO stands for securities that either receive interest only or, get ready for this one, inverse interest only. The interest paid to the holder only rises or floats upward when the mortgage is also floating rate and rates rise. Inverse IOs, on the other hand, would pay lower interest as the index rate rises.
High leverage stuff and we have no visibility as to how they are tilting overall other than we know that management is awake at the wheel. NYMT knows what day it is and has been here before, so I believe they are more likely long IO rather than inverse IO instruments today.
The other part, which is so interesting, are the first loss slices on Freddie Mac mortgages that maybe either single or multifamily properties.
Given the high equity values and relatively cheap fixed rate mortgages, we see this pointing in the right direction and believe there is value in these pieces. Hence, our positive tailwind adjustment.
Outlook and Strategy
The company’s strategy rolling forward is focused on the entire residential housing sector:
“In light of current market conditions, which includes increased volatility in interest rate, credit, mortgage and financial markets and the increasing risk of the U.S. economy experiencing a recession within the next 12 months, we currently intend to pursue selective investments across the residential housing sector, with a focus on generating higher portfolio turnover by increasing our allocation to higher coupon, short duration residential investor loans, consider the opportunistic disposition of assets from our portfolio and prudently manage our liabilities. We believe these actions, combined with our strong balance sheet and cash position, will help to protect our undepreciated book value per common share during the expected continued volatile periods in the near future and will better enable us to rapidly reposition our portfolio in a higher interest rate environment and position us to deploy capital and seize on superior market opportunities in the market cycles ahead.”
Given the economic winds, looming recession with rising rates, we like the strategy. By focusing in non-mark-to-market sectors while housing supply remains short strikes us as a viable strategy one would not have used during 2008. They are adapting rather that re-running an old playbook.
Take a look at how their loan portfolio has been performing:
NYMT Q2 2022 Loan Performance (NYMT 2022 Q2 form 10-Q)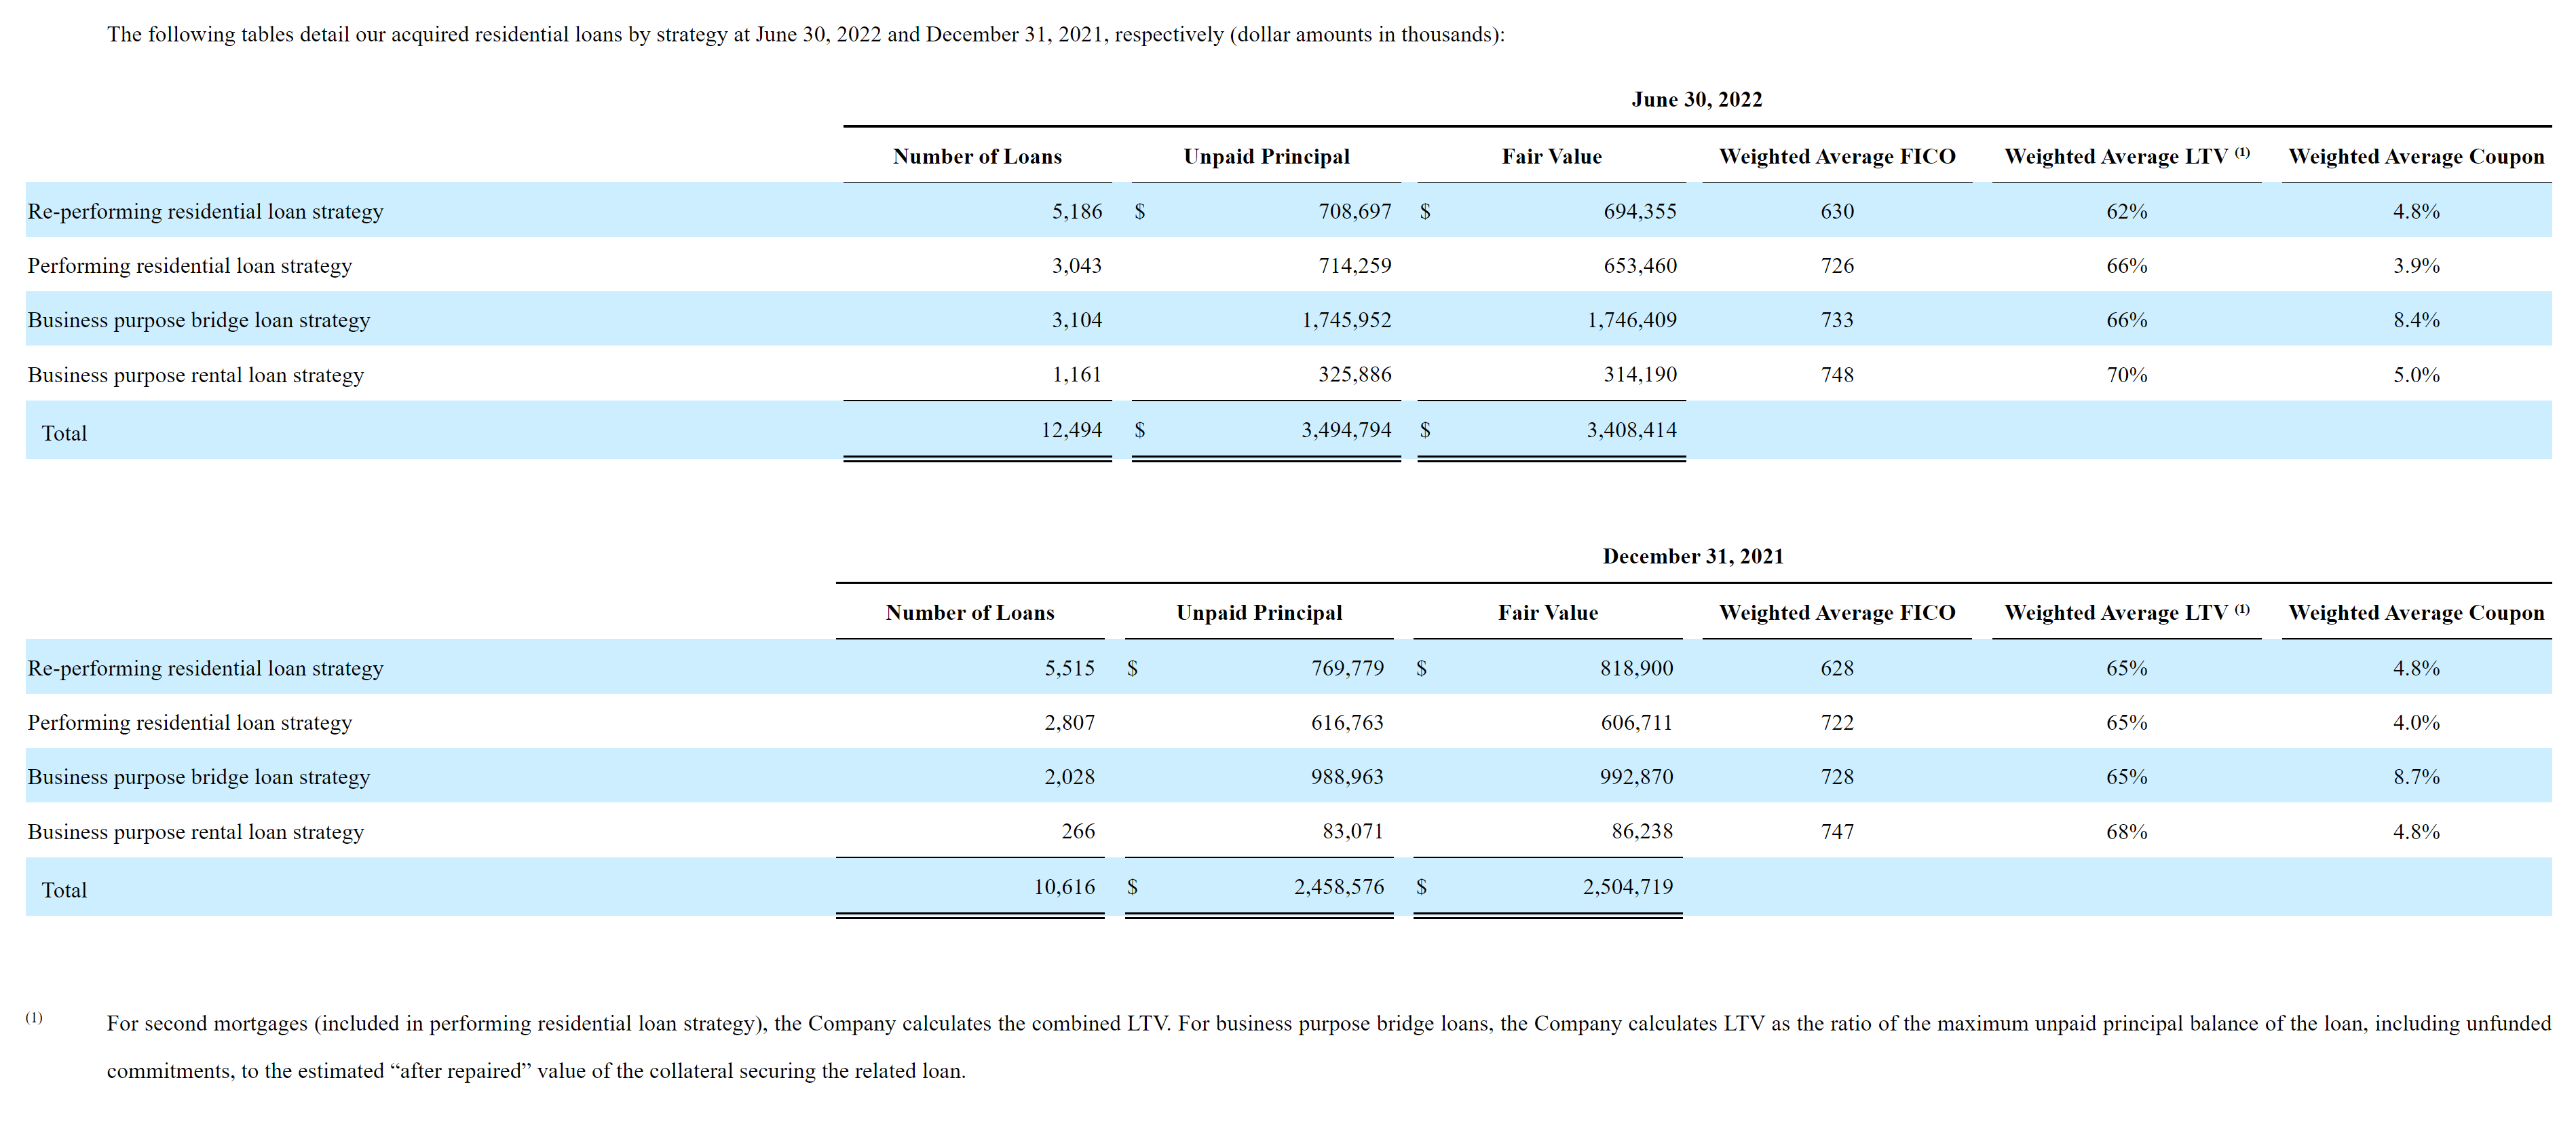
We see loan to value percentages at far more conservative levels than the end of 2007. Even a 10% haircut to asset values would not trigger heavy problems. Values most likely will not crater without another Black Swan event.
There is risk here; and we see it being managed as NYMT adapts to the 2022-2023 environment in ways we believe will generate positive returns on investment (shorter time duration loans) plus trading in the seasoned agency market. NYMT appears well positioned to survive from an asset perspective.
What about the financing stack? What are the risks and opportunities?
The Liability Side
Supporting all these assets is a load of debt. We have about $6.8BN in real estate related assets (excludes cash) of which about $5.1BN are financed by a combination of short and long term financings as well as another approximately $538MM in preferred stocks, leaving about $1.6BN in equity cushion.
Absent a liquidity crisis, we see NYMT continuing the orderly process of shifting their portfolio with market forces down the path of least resistance for their strategy.
If NYMT cannot finance itself efficiently because of rate spikes in the short term markets or it’s leverage slips out of balance, it will need to issue secondary equity to support the portfolio. The asset quality leads us to believe straight equity will cost NYMT more than a pure agency REIT and why we are glad it carries a lower total debt to equity ratio than its hybrid peers. It would also be highly dilutive to the common if Wall St. analyst NAV estimates are correct.
Valuation Analysis
That was a long road through NYMT land. How does it compare to its peer group? We have selected the following hybrid residential mREIT competitors: Chimera Investment (CIM), MFA Financial (MFA), Ellington Financial (EFC), and Arlington Asset Management (AAIC). Of these, AAIC has adopted the novel strategy to forego a common dividend in favor of common stock repurchases.
| Ticker |
Total Debt/ Total Capital |
Preferred Stock Amt Outstanding ($’000) |
Percent of Shareholder Equity |
Total Debt + Preferred / Total Capital |
Est. NAV per Share* |
Share Price 10/13/22 |
Discount to NAV |
| NYMT | 69.42% | 538.2 | 24.3% | 76.8% | $3.93 | $2.42 | 38.4% |
| CIM | 78.59 | 372.0 | 12.5 | 81.3 | 8.34 | 5.39 | 35.4 |
| MFA | 76.98 | 190.0 | 8.9 | 79.0 | 15.46 | 8.16 | 47.2 |
| EFC | 79.09 | 227.4 | 18.4 | 82.9 | 16.55 | 11.66 | 29.6 |
| AAIC | 77.70 | 34.6 |
16.2 |
81.3 | 6.22 | 2.82 | 54.7 |
Source: SA, Koyfin and Q2 2022 Form 10-Qs for each issuer.
Such interesting results. We first have to ask the age old question from the 1970’s, “is it a floor wax or a dessert topping?”
The preferred stock is what we are trying to understand more deeply. Traditional leverage ratios treat preferred more like permanent capital (which it could be) than a debt vehicle (which it could be). Which is it? We submit that depends on how any particular industry treats it. While Dan Ackroyd answered the floor wax question, we’ll handle the leverage one.
If we look at NYMT’s unsecured debt obligations, we see one issued at 5.75% fixed from 2021 and another two at LIBOR + 3.75 and 3.95 percentage points that each mature in 2035. Their preferred stocks boast current fixed rate coupons of 6.75%, 7.875%, 8% and 7%. More or less where one might expect coupons on next tranche lower in the financing stack (risk premium).
By comparison to our peer group:
- CIM has no long term loans;
- MFA has no long term loans;
- EFC has 5.875% Senior Unsecured Notes with a 6.75% Preferred;
- AAIC has 6.75% unsecured debt due 2025 with an 8.25% Preferred.
In all these cases, the referred range of coupon seems like the next reasonable step down the claims ladder (granted, for a more nuanced analysis, we would need to examine credit spreads on the day these were priced. I’m not doing that).
In all cases, we see higher preferred coupons.
Side Road on Preferred Advantages for REITs
Everywhere in the C Corp world, preferred dividends are typically more expensive than for any REIT. That’s because preferred dividends have to be paid out of net income after taxes. Debt interest is paid out of pre-tax earnings. As long as the preferred issuer is a tax payer, those preferred dividends are extra expensive because you allocate more earnings than you actually payout (the taxes are the difference).
REITs, however, do not pay taxes so it is NEVER more expensive to pay a preferred coupon than debt interest if they are the same coupon. That allows REITs to view preferred stock as an extra stretch for leverage rather than permanent capital. Unlike the common, whose dividend is simply determined by leftover distributable income, the preferred will pay a fixed amount, even if the amount resets periodically (floating rate).
We believe it is appropriate to count Preferred Stock as part of a residential mortgage REITs total debt for leverage purposes. On that basis, we can see in the above table that despite having the most outstanding preferred stock as a percent of total capital, NYMT still carries the lowest leverage ratio. Not by much and clearly within its peer range.
Valuation Conclusions
NYMT is a little unusual. They do not engage in any disclosed hedging activities, rather they take the old fashioned banking approach to match fund, securitize and directly manage their GAP (a traditional banking measure where one looks at the degree to which asset and liabilities mismatch in terms of maturity and/or duration). Our peer group is more a hedge and glide group by comparison.
We view New Mortgage Trust’s asset quality to be high with some tailwind leverage in the IO and First Loss pieces they own (about 8% of assets) along with equity positions in multifamily transactions that could bite the common stock hard in the wrong environment.
NYMT faces some stiffer winds than their Agency counterparts with respect to visibility and investor questions. There is also the advantage of not having to mark-to-market assets they believe are not impaired in any substantive way, too.
We like NYMT’s basic business focus on residential and multifamily. We view the multifamily equity investments and higher leverage pieces as positive for market recovery. Granted, we assume the Fed does not have to hike beyond the next 1.5 percentage points quickly or the resulting pressure could force NYMT to make destructive moves to value.
Common Stock
Tough to recommend the common when the leverage ratios are high and rates running the wrong way. Too much volatility in either direction to make us feel there is any clear running room.
We rate NYMT common a soft hold for today only if you like the risk. If you were hoping for an income monster, we recommend selling or not entering at all. These are more trading vehicles, in my honest opinion, than things to hold.
Preferred Stock
Very different story here. NYMT has 4 series that we summarize in the following table:
|
NYMT Preferred Series Ticker |
Series |
Fixed or FtF* |
Convert Date |
Floating Margin over LIBOR** |
Current Yield |
Current Price |
Buy Hold Avoid |
| NYMTL | F | FtF | 10/15/26 | 6.13% | 8.38% | $15.70 | Avoid |
| NYMTM | E | FtF | 1/15/25 | 6.429 | 11.74 | 16.62 | Buy |
| NYMTN | D | FtF | 10/15/27 | 5.695 | 11.76 | 16.84 | Avoid |
| NYMTZ | G | Fixed | N/A | N/A | 11.62 | 14.92 | Buy/Avoid |
* Fixed-to-Floating rate.
** We believe these switch to 90-day Term SOFR plus 26.2 basis points in June, 2023.
Let’s start with NYMTL. We get a nice margin over LIBOR and the second deepest discount from par ($25). When I compare to the NYMTM that has the shortest time to conversion, I see they both have their charms on the surface.
NYMTL gives me more dollar upside and it will take a year longer to get there. We get an extra 5% upside but with the lowest current dividend. By the time this converts, NYMTM will have a baked in lead from far higher dividends over all four years. NYMTL just lost its charms.
NYMTM is our star. It has the shortest time risk, the richest margin when it converts and the same current yield as NYMTN which converts 2.75 years later. They are similarly priced, but NYMTM has NYMTN pinned at every turn, too. NYMTN can join NYMTL in the barn – they lack the juice to win.
Finally, we have funny old NYMTZ, an issue so ugly they assigned it the last letter in the alphabet hoping people might miss it. But hold on, is it really an ugly fixed rate preferred stock? NYMT must love this one, it only costs them 7% with call protection out to 1/15/27. Whether NYMT calls this, you have 67% capital upside plus a current yield similar to the best NYMT preferreds.
The risk here is that fixed rate preferred trades like a long dated bond when interest rates move. It is not surprising it has dropped the farthest with the second lowest coupon in the NYMT preferred group. It also has the furthest to recover, but not so much that it outperforms the NYMTM which offers a 50% capital upside with the same yield and you get there 2 years earlier – far better theoretical performance.
We rate the NYMTZ as split personality – if you want to lock in a great spread with strong upside that likely will NOT be called until rates are far lower, this is a good play. If you are looking to tether to par faster for about the same income and a fat yield over the index, avoid this and buy NYMTM.
Be the first to comment