Ultima_Gaina/iStock via Getty Images
One of the premier property markets in the country, if not the world, especially when it comes to office properties, is New York City. The Big Apple has, for centuries, been growing into the behemoth that it is today. It stands to reason, then, that some of the best investment opportunities in the real estate market may exist there. However, not every REIT that operates in that area is guaranteed to thrive. Between high costs, stresses caused by the COVID-19 pandemic for the office property market, and other miscellaneous factors, some REITs have gone on to struggle. One such firm that has actually shown recent signs of improvement, but that still has a long way to go, is none other than New York City REIT (NYSE:NYC). At the end of the day, despite what the market has been saying recently, this prospect is truly struggling to create value for its investors. Recent improvements are promising, but there is no guarantee that the worst for the company is past it.
Data is encouraging, but problems persist
The last time I wrote about New York City REIT was in an article published in January of this year. At that time, I mentioned that the company was struggling from a fundamental perspective. However, I acknowledged that shares could experience strong upside if the business can turn around its operations. Although I left open that possibility, I ultimately rated the company a ‘sell’ prospect because I saw no such sign of a turnaround transpiring. Lo and behold, my timing proved to be rather ironic. Since the publication of that article, management released financial results covering the final quarter of the company’s 2021 fiscal year. And in response to what could definitely be considered some improvements, shares of the business have generated a return for investors of 21.2%. That compares to the 5.2% decline experienced by the S&P 500 over the same timeframe.

Author – SEC EDGAR Data
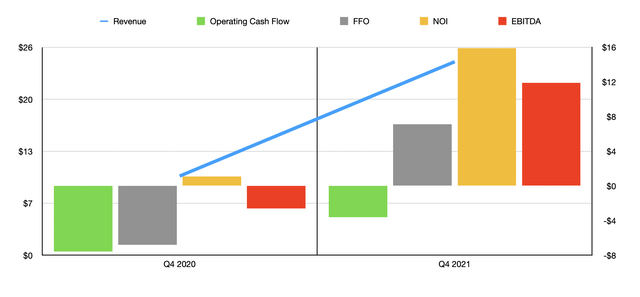
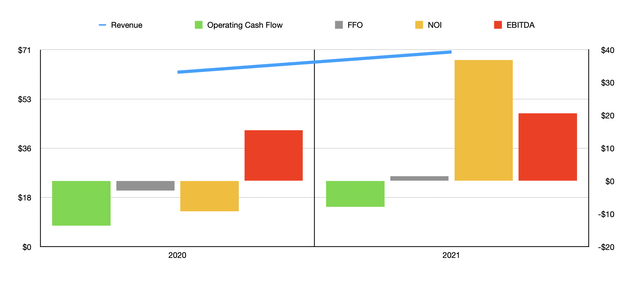
Given this significant and rapid upside, you might think that the company generated some strong performance to warrant it. And you would be right. In the final quarter of the company’s 2021 fiscal year, the business reported revenue of $24.2 million. That compares to the $9.9 million in revenue generated the same time one year earlier. As a result of this, total sales for 2021 came in at $70.2 million. That translates to a year-over-year increase of 11.6% compared to the $62.9 million in sales the company reported for 2021. Interestingly, for the eight properties that the business owns, the occupancy rate actually fell year over year. At the end of 2020, the company’s overall occupancy rate totaled 87%. This dropped to 82.9% by the end of 2021. The real driver of revenue growth, then, stemmed from the accelerated amortization of the company’s remaining unamortized balance of below market lease liabilities. It is also worth mentioning that the company succeeded in leasing an additional 115,630 square feet of space across its portfolio at an annualized straight line rent per square foot rate of $50.15. That is certain to have been a contributor for the business as well, even though it’s all 122,000 square feet worth of space at a price of $67.73 or square foot terminated or expire.
The top line was not the only area where New York City REIT posted some improvements. Operating cash flow in the final quarter was negative $3.6 million. That compares to the negative $7.6 million reported one year earlier. This brought the total figure for the 2021 fiscal year to negative $7.9 million. That compares favorably to the negative $13.6 million the company reported for its 2020 fiscal year. Other profitability metrics also improved. FFO, or funds from operations, came in positive to the tune of $7.1 million for the final quarter. That marks a significant improvement over the negative $6.8 million the company reported one year earlier. This brought the total 2021 results for the company up to a positive $1.5 million. That compares to the negative $2.9 million reported in 2020.

Author – SEC EDGAR Data
There are, of course, other profitability metrics to pay attention to. One of these is the NOI, or net operating income. According to management, this came in positive to the tune of $15.9 million for the final quarter. That compares to the $1.1 million reported one year earlier. For the full 2021 fiscal year, the metric totaled $36.9 million. That compares to the negative $9.2 million reported for 2020. And finally, we arrive at EBITDA. For the final quarter, this was positive to the tune of $11.9 million. That’s up from the negative $2.6 million reported for the final quarter of 2020. As a result, the total performance for the 2021 fiscal year came in at $20.6 million. That’s up slightly from the $15.5 million reported for 2020.
The good news for investors here is that New York City REIT is definitely showing signs of improvement. But the bad news is that the performance improvements still are nowhere near enough for the enterprise to be healthy. Nor do shares look cheap if current performance continues. For instance, the company would have a negative price to operating cash flow multiple. The price to FFO multiple would be an astonishing 115.2. And the EV to EBITDA multiple would still be quite high at 26.3. Only the price to NOI multiple would come in low, totaling just 4.7 for the year. Of course, this doesn’t mean that New York City REIT couldn’t be an attractive prospect. For instance, to generate a price to operating cash flow multiple of 10, the business would only need positive operating cash flow of $17.3 million. For this metric to come in at 15, it would only need cash flow of $11.5 million.
To put this in perspective, when I looked at five similar firms, I found them trading at a price to operating cash flow multiple of between 10.5 and 13.9. Meanwhile, the EV to EBITDA multiples for these firms ranged from a low of 11 to a high of 19.3. Certainly, New York City REIT is more expensive than all of these, but it doesn’t take much more positive cash flow to bring this multiple down. The sad thing though, however, is that I just don’t see a realistic path to that. At least not at this point in time.
| Company | Price / Operating Cash Flow | EV / EBITDA |
| New York City REIT | N/A | 26.3 |
| Empire State Realty Trust (ESRT) | 11.6 | 14.1 |
| Alpine Income Property Trust (PINE) | 12.2 | 16.5 |
| CTO Realty Growth (CTO) | 13.9 | 11.0 |
| Vornado Realty Trust (VNO) | 10.5 | 19.3 |
| One Liberty Properties (OLP) | 12.8 | 13.0 |
Takeaway
At this moment, some investors may be happy with recent performance achieved by New York City REIT. It is true that the final quarter of the company’s 2021 fiscal year was a solid one. But in the grand scheme of things, the company does still work definitely troubled. It wouldn’t take much additional cash flow for the company to look rather appealing. But given how things have been in recent years, I don’t see a realistic way to get there right now. Because of this, I would still reiterate my ‘sell’ opinion on the firm.


Be the first to comment