

Marvin Samuel Tolentino Pineda
Introduction
My thesis is that some headlines exaggerate the impact competitors are having on Netflix (NASDAQ:NFLX). Paid subscriber numbers for the first half of the year are disappointing but there was some pull-forward from COVID and there are other metrics that are encouraging. It’s terrible that paid subs went from 221.84 million in 4Q21 to 221.64 million in 1Q22 to 220.67 million in 2Q22. However, it’s not so bad that revenue went from $7,709 million in 4Q21 to $7,869 million in 1Q22 to $7,970 in 2Q22 and it would have increased more were it not for F/X challenges.
US Market
The Hollywood Reporter shows that in the US from September 20, 2021 to May 8, 2022, Netflix had more than 5.4x as many minutes viewed as Disney+ (DIS), nearly 7.7x as many as Amazon Prime (AMZN) and over 10x as many as Hulu. Netflix displayed these numbers in the 2Q22 letter:
Share of US TV viewing (2Q22 letter)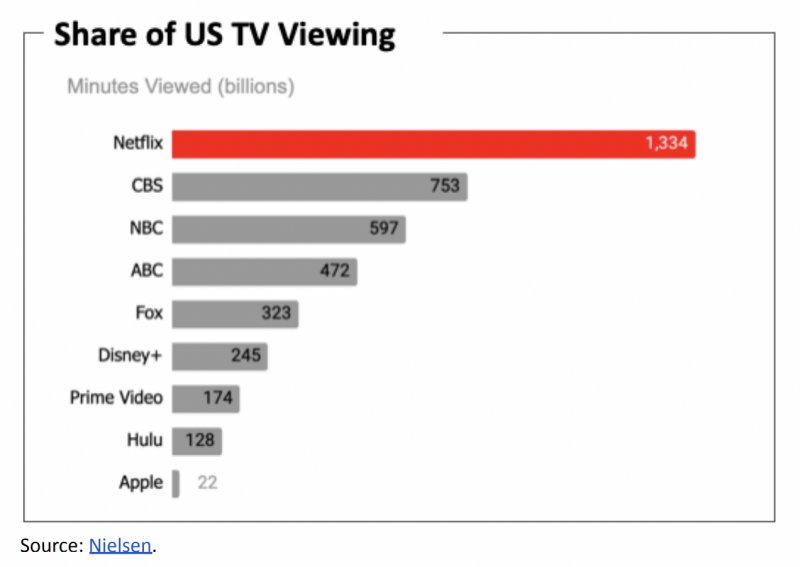
Looking at the strength of CBS (PARA), NBC (CMCSA), ABC (DIS) and Fox, I think Netflix should have at least one channel that always has live content. They could have one hour segments for business morning, general morning, sports updates and general news/comedy for the Americas, Europe and Asia such that 12 hours would be filled. The remaining 12 hours could be filled with behind the scenes interviews, reality TV, gaming news and other subjects. In the past these types of considerations would not be entertained but their announcement about getting into advertising shows that no part of their business is unassailable.
If Prime Video or Apple (AAPL) was a close second to Netflix then there would be concern but legacy channels come in 2nd, 3rd, 4th and 5th place. Netflix reigns supreme with 1,334 billion minutes viewed during this time period. Disney+, Prime Video and Apple get a lot of attention as competitors but their minutes viewed were only 245 billion, 174 billion and 22 billion, respectively.
The Nielsen June update shows that streaming climbed 6.3 points from 27.4% of TV time in June 2021 to 33.7% in June 2022. Meanwhile, cable fell 5 points from 40.1% in June 2021 to 35.1% in June 2022:
Share of TV trended (Nielsen)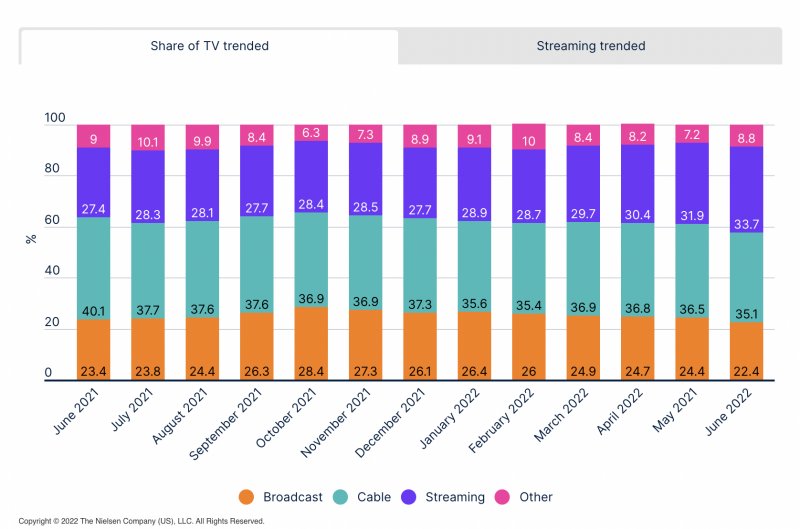
The Nielsen June update goes on to break out the share of TV time for streaming components. Their chart is a bit hard to read but the June 2022 numbers show Netflix on top as follows:
7.7% Netflix
3.3% Hulu
2.9% Amazon
2.0% Disney+
1.0% HBO Max (WBD)
9.9% Other streaming
———-
33.7%
Spurious headlines say Netflix is being crushed by competitors but they fail to stress how much streaming is growing while cable shrinks. It is not a zero-sum game; Netflix and streaming competitors are increasing TV share together as cable declines. Netflix climbed 1.1 points from 6.6% of TV time in June 2021 to 7.7% in June 2022. YouTube climbed 0.9 points from 6% to 6.9%. Hulu increased 0.4 points from 2.9% to 3.3%. Amazon jumped 0.7 points from 2.2% to 2.9%. The combination of Netflix, YouTube, Hulu and Amazon accounted for 3.1 of the 6.3 points streaming gained in this time period. Disney+ and HBO Max combined to gain 1.4 points and the “Other streaming” component which includes names like Peacock rose 1.8 points. Here are the Nielsen chart numbers for the last 13 months:
Streaming trended (Nielsen)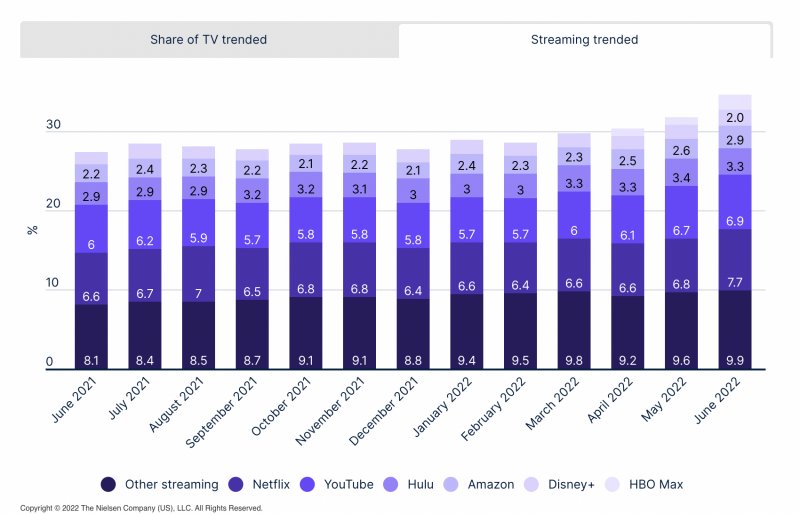
International
A September 2021 Comparitech article shows that South Americans watch the most Netflix.
In 2Q22, $4.4 billion of Netflix’s $8 billion quarterly revenue came from outside the US and Canada (“UCAN”). CNET shows Squid Game which was filmed in South Korea and Money Heist which was filmed in Spain are two of the most watched TV series Netflix has ever had.
An October 2021 Business Insider article talks about the advantages Netflix has in global markets:
Rivals including Amazon, Disney+, Apple, and more recently HBO Max and Paramount+, have also started commissioning more international programming, said producers who worked or had talks with these companies. But Netflix is well ahead of its streaming competition on the international front. “Netflix has a five-year advantage,” said Nicola De Angelis, co-CEO of the Italian production company Fabula Pictures (Netflix commissioned the series “Zero” from the company this year). He said the gap will be hard to close for other players, though he’s also in conversations with Disney and Amazon to produce shows for their streaming businesses.
Business Insider goes on to say that Netflix has more of a “global mindset” with content than competitors and this is reminiscent of what Co-CEO Ted Sarandos said at the December 2019 UBS Global TMT Conference:
So the goal has never been to export Hollywood content around the world, it’s been to tell stories from anywhere in the world to everywhere in the world, and that includes English language territories.
The Business Insider article goes on to cite Teresa Phillips, CEO of Spherex, a tech and data firm. Phillips explains that Netflix focuses on telling authentic local stories from many different countries.
Valuation
The 2021 10-K shows revenue of $29.7 billion. Just 5 years earlier, it was a mere $8.8 billion in 2016 such that the CAGR was 27.5%. Even more impressive is the net income growth which went from $187 million in 2016 to $5.1 billion in 2021 for a CAGR of nearly 94%.
Trailing-twelve month (“TTM”) net income is $5 billion or $3 billion + $5.1 billion – $3.1 billion. If management’s content amortization is accurate such that the net income figure is sound then I think Netflix is worth at least 20 to 25x earnings given the growth we should see in the coming years. This implies a minimum valuation range of $102 to $128 billion.
The 2Q22 10-Q says there were 444,705,591 shares outstanding as of June 30th. Multiplying this by the July 21st share price of $223.88 gives us a market cap of nearly $100 billion. The enterprise value is $8.4 billion more than the market cap due to $14.2 billion in long-term debt that is only partially offset by $5.8 billion in cash. Still, I like to compare earnings to the market cap as opposed to the enterprise value because earnings take a hit from the interest expense line in the P&L.
The market price is under my valuation range so I think the stock is undervalued.
Be the first to comment