

Mario Tama
While Netflix, Inc. (NASDAQ:NFLX) is the market leader in the video streaming market with a share of 21%, its market share had eroded in the past year with intense competition. However, the company announced the launch of its new ad-subscription plan this year. Thus, we analyzed its new subscription plan to determine whether Netflix could maintain the same high growth it has seen in the past with a 5-year average revenue growth of 27.6%.
We forecasted the company’s subscriber base growth in terms of the subscriber contribution from its AVOD and SVOD subscriptions. Moreover, we then estimated the revenue contribution to Netflix consisting of subscription revenue and ad revenue. Lastly, we examined the cost of its deal with Microsoft as its ad-tech provider to forecast the impact on the company’s margins.
New Ad Tier Support Subscriber Growth
|
Netflix Subscribers (‘mln’) |
2012 |
2013 |
2014 |
2015 |
2016 |
2017 |
2018 |
2019 |
2020 |
2021 |
Average |
|
Netflix Subscribers |
25.71 |
35.63 |
47.99 |
62.71 |
79.9 |
99.04 |
124.35 |
151.56 |
192.95 |
209 |
|
|
Growth % |
19.6% |
38.6% |
34.7% |
30.7% |
27.4% |
24.0% |
25.6% |
21.9% |
27.3% |
8.3% |
25.8% |
Source: Netflix, Khaveen Investments
Based on the table above, Netflix’s subscriber growth slowed down in 2021 to only 8.3% compared to its 10-year average of 25.8%. In Q3 2022, its total subscribers stood at 223 mln, representing a growth rate of only 4.2% YoY, indicating a slowing subscriber growth.
According to Netflix, the company will launch its “Basic with Ads” plan in November.
|
Streaming Market Penetration Rate |
2021 |
2022F |
2023F |
2024F |
2025F |
2026F |
|
AVOD |
20% |
27% |
36.5% |
49.2% |
66.4% |
89.7% |
|
Growth % |
35.00% |
35.00% |
35.00% |
35.00% |
35.00% |
|
|
SVOD |
81% |
83% |
85.0% |
87.1% |
89.3% |
91.5% |
|
Growth % |
2.5% |
2.47% |
2.47% |
2.47% |
2.47% |
|
|
Population Growth |
0.90% |
0.90% |
0.90% |
0.90% |
0.90% |
|
|
Market AVOD Growth % |
36.2% |
36.2% |
36.2% |
36.2% |
||
|
Market SVOD Growth % |
3.4% |
3.4% |
3.4% |
3.4% |
||
|
Netflix Subscribers |
2021 |
2022F |
2023F |
2024F |
2025F |
2026F |
|
AVOD |
21.3 |
50.3 |
89.8 |
143.7 |
217.0 |
|
|
Growth % |
136.2% |
78.5% |
59.9% |
51.0% |
||
|
SVOD |
199.4 |
184.1 |
168.3 |
152.0 |
135.1 |
|
|
Growth % |
-7.7% |
-8.6% |
-9.7% |
-11.1% |
||
|
Total Subscribers |
221.84 |
220.7 |
234.4 |
258.2 |
295.7 |
352.2 |
|
Growth % |
-0.5% |
6.2% |
10.1% |
14.5% |
19.1% |
Source: Company Data, Khaveen Investments
From our previous analysis, we forecasted Netflix’s subscriber growth by factoring in its ad-subscription plan. “We assumed that the new service would cannibalize its existing SVOD offering based on the survey by Statista with a worldwide average of 48.3%, indicating that they prefer ad-tier low-cost streaming services rather than more expensive services without ads. We multiplied this figure with Netflix’s 2022 current subscriber base to estimate 106.5 mln subscribers to switch to its ad tier in a 5-year period assumption as the company’s initial launch is only in 12 countries first. Furthermore, we projected the growth going forward for its AVOD and SVOD offering based on the penetration rate growth of 35% in 2022 for AVOD and 2.47% for SVOD multiplied by the forecasted population growth by the UN at 0.9%.” As seen, the SVOD penetration rate is high at 81%, compared to AVOD penetration which was only 20% in 2021. Thus, our growth forecast for SVOD is low (3.4%) in comparison to AVOD at 36.2%.
Justwatch, Khaveen Investments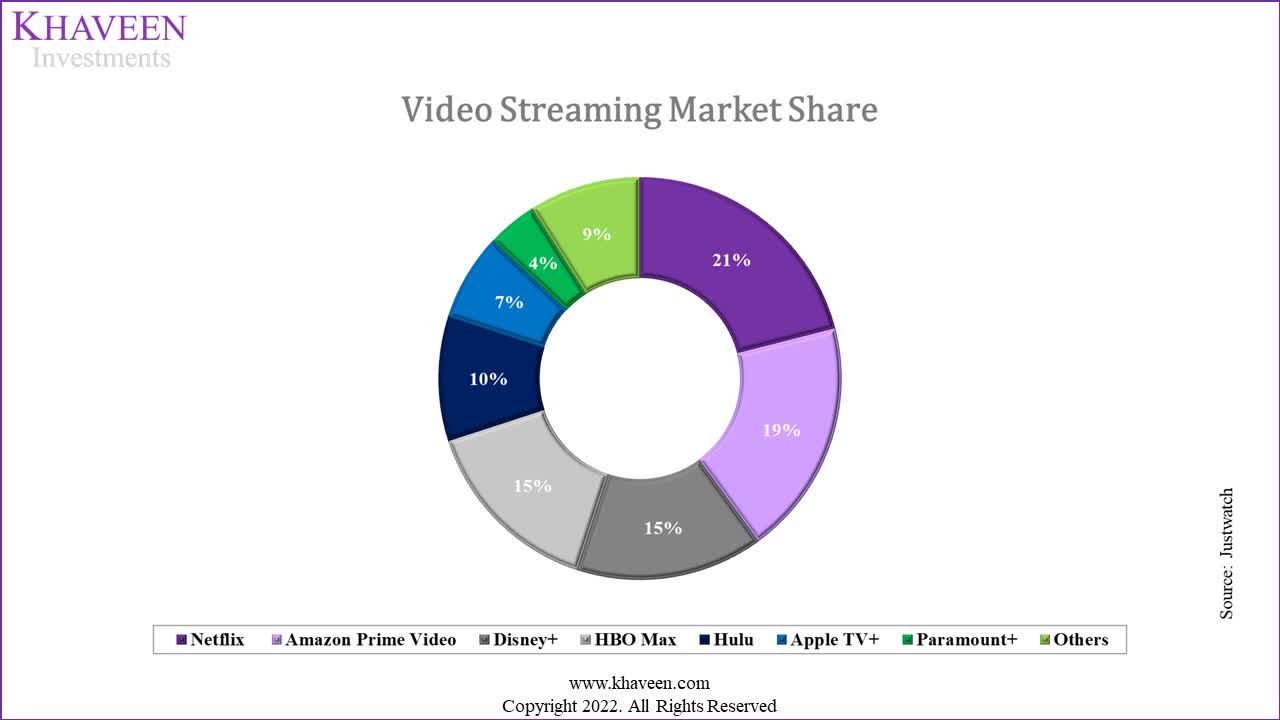
As seen in the chart, Netflix was the market leader in Q3 2022 based on Justwatch with a market share of 21% followed by Amazon Prime Video (AMZN) at 19% and Disney+ (DIS) at 15%. We assumed Netflix’s market share to remain constant as we forecasted the company’s organic subscriber growth based on our derived growth rate from penetration and population growth. Overall, we expect Netflix’s AVOD subscriber base to grow by 21.3 mln per year by cannibalization from our estimation of 106.5 mln subscribers to switch to its new plan. Additionally, we assumed a yearly organic subscriber growth rate of 36.2% for its AVOD subscribers and 3.4% for its SVOD subscribers. In total, we see its total subscriber growth increasing at an average of 9.9%, which is still lower compared to its 10-year average of 25.8%.
Netflix Revenue Supported by Ad Tier
According to Netflix, its Basic with Ads plan will launch in 12 countries including “Australia, Brazil, Canada, France, Germany, Italy, Japan, Korea, Mexico, Spain, the UK and the US.” For the U.S., the plan starts at $6.99 per month but is different across different countries.
Netflix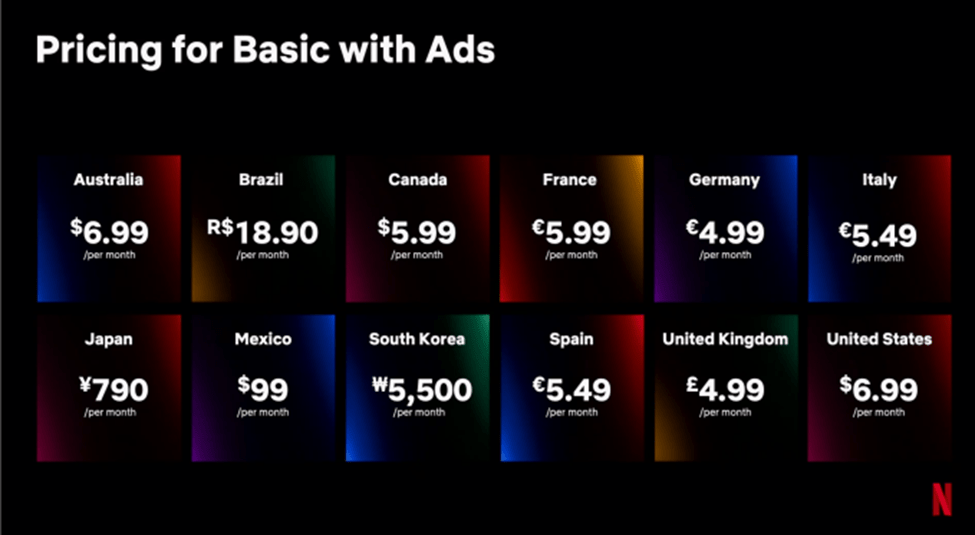
|
Country |
Basic with Ads Plan Price per month |
Exchange Rate |
Price in $ |
|
Australia |
6.99 |
0.64 |
4.47 |
|
Brazil |
18.9 |
0.19 |
3.59 |
|
Canada |
5.99 |
0.74 |
4.43 |
|
France |
5.99 |
1 |
5.99 |
|
Germany |
4.99 |
1 |
4.99 |
|
Italy |
5.49 |
1 |
5.49 |
|
Japan |
790 |
0.0068 |
5.37 |
|
Mexico |
99 |
0.051 |
5.05 |
|
South Korea |
5500 |
0.00073 |
4.02 |
|
Spain |
5.49 |
1 |
5.49 |
|
United Kingdom |
4.99 |
1.14 |
5.69 |
|
United States |
6.99 |
6.99 |
|
|
Average |
5.13 |
Source: Netflix, Khaveen Investments
As seen in the table, we converted the monthly pricing for Netflix’s Basic with Ads plan to USD and obtained an average of $5.13 per month. We used this figure to forecast Netflix’s revenue for AVOD by multiplying it with our subscriber forecast. Compared to AVOD, we based SVOD monthly cost on the company’s 2021 ARPU of $11.67 per month which we multiplied with our Netflix SVOD subscriber forecast to derive its SVOD revenue growth through 2026. Additionally, we assumed its ARPU growth based on its historical 5-year average of 6.3% for both SVOD and AVOD ARPU. We summed the two to obtain its total subscription revenue growth through 2026.
|
Netflix Revenue from Subscription ($ mln) |
2022F |
2023F |
2024F |
2025F |
2026F |
|
AVOD |
1,394 |
3,502 |
6,648 |
11,304 |
18,153 |
|
Growth % |
151.1% |
89.8% |
70.0% |
60.6% |
|
|
SVOD |
29,684 |
29,144 |
28,330 |
27,201 |
25,710 |
|
Growth % |
-1.8% |
-2.8% |
-4.0% |
-5.5% |
|
|
Total Subscription Revenue |
31,079 |
32,646 |
34,978 |
38,505 |
43,864 |
|
Growth % |
5.0% |
7.1% |
10.1% |
13.9% |
Source: Company Data, Khaveen Investments
In total, we see its subscription revenue growing at a forward average rate of 9% through 2026, driven by AVOD subscription revenue growth at an average of 92.9% despite declining SVOD subscription revenue of -3.5%.
Additionally, we previously estimated the average ad revenue per user for Netflix based on the average of its AVOD competitors, which we used to forecasts its ad revenue.
|
Ad Revenue Per User |
Revenue ($ mln) |
Users (‘mln’) |
Ad Revenue Per Users ($) |
|
Hulu |
2,100 |
27.8 |
75.5 |
|
Paramount+ (PARA) |
2,145 |
32.8 |
65.40 |
|
Peacock |
500 |
15.5 |
32.26 |
|
The Roku Channel (ROKU) |
2,285 |
60.1 |
38.02 |
|
Tubi |
380 |
51 |
7.45 |
|
Pluto TV |
786.7 |
64 |
12.29 |
|
Average |
1,366 |
41.9 |
38.49 |
Source: Company Data, Khaveen Investments
|
Netflix Revenue ($ mln) |
2022F |
2023F |
2024F |
2025F |
2026F |
|
Total Subscription Revenue |
31,079 |
32,646 |
34,978 |
38,505 |
43,864 |
|
Growth % |
5.0% |
7.1% |
10.1% |
13.9% |
|
|
Ad Revenue |
820 |
1,937 |
3,458 |
5,531 |
8,354 |
|
Growth % |
136.2% |
78.5% |
59.9% |
51.0% |
|
|
Total Revenue |
31,898 |
34,583 |
38,436 |
44,036 |
52,217 |
|
Growth % |
7.4% |
8.4% |
11.1% |
14.6% |
18.6% |
Source: Company Data, Khaveen Investments
In total, we see Netflix’s revenue growth growing by an average of 13.2% through 2026 in the table above. Overall, although Netflix’s ad subscription plan has a lower monthly subscription cost ($5.13) than its SVOD plans with an average revenue per user of $11.67, we see its revenue growth contributed by ad revenue with an average of $38.49 per user based on its competitors, thus an increasing forecasted revenue growth rate from 7.4% in 2022 to 18.6% in 2026 and a forward average of 12% over the next 5 years.
Profitability Margin Impact with Microsoft Partnership
Based on the company’s earnings briefing, the company highlighted its strong initial signs of demand for ads with its new subscription plan in partnership with Microsoft (MSFT) but also highlighted the cost expected to be incurred with its partnership.
Obviously there’s some cost to our partnership with Microsoft – Spence Neumann, Chief Financial Officer
In our analysis of Microsoft for its acquisition of Xandr, we estimated the fee to be between 20% to 30% and assumed a 25% fee to estimate the cost of the Microsoft partnership.
|
Netflix Microsoft Partnership Costs |
2022F |
2023F |
2024F |
2025F |
2026F |
|
Netflix AVOD Subscribers (‘mln’) |
21.3 |
50.3 |
89.8 |
143.7 |
217.0 |
|
Average Ad Revenue Per Subscriber ($) |
38.5 |
38.5 |
38.5 |
38.5 |
38.5 |
|
Total AVOD AD Revenue ($ mln) |
820 |
1,937 |
3,458 |
5,531 |
8,354 |
|
Cost to Netflix from Microsoft Partnership (25%) ($ mln) |
205 |
484 |
865 |
1,383 |
2,088 |
Source: Company Data, Khaveen Investments
Thus, we forecasted the company’s profitability to account for the cost of the Microsoft partnership. We forecasted its COGS as a % of revenue in 2022 based on its TTM of 59.4% followed by its 5-year average of 60.3% but we expect it to decline by 2.41% per year based on its 10-year average. We then summed our COGS forecast with our estimated Microsoft partnership costs.
|
Profitability |
2022F |
2023F |
2024F |
2025F |
2026F |
|
Total Revenue |
31,898 |
34,583 |
38,436 |
44,036 |
52,217 |
|
COGS as % of revenue |
59.40% |
58.85% |
57.43% |
56.04% |
54.69% |
|
COGS |
18,949 |
20,854 |
22,073 |
24,679 |
28,558 |
|
Microsoft Partnership Cost |
205 |
484 |
865 |
1,383 |
2,088 |
|
Adjusted COGS |
19,154 |
21,338 |
22,938 |
26,061 |
30,647 |
|
Adjusted COGS as % of revenue |
60.0% |
61.7% |
59.7% |
59.2% |
58.7% |
Source: Company Data, Khaveen Investments
Company Data, Khaveen Investments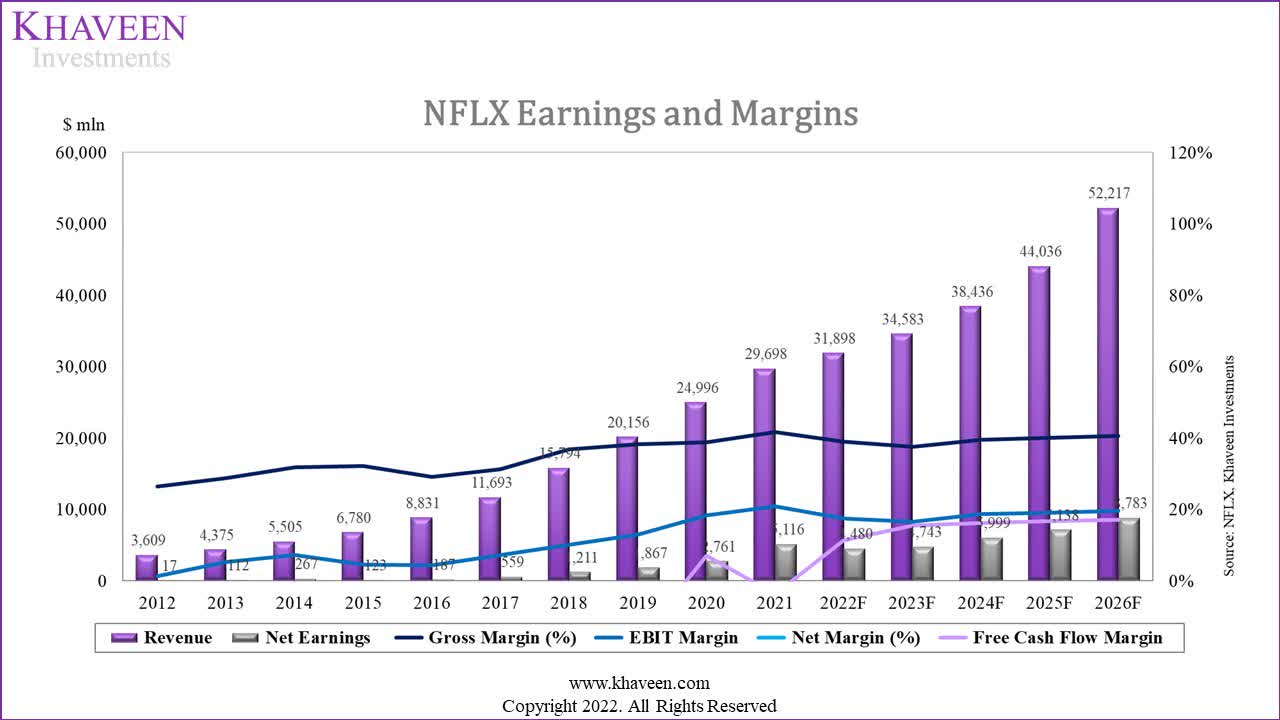
Overall, based on the company’s earnings and margins chart above, its profitability had been improving in the past 10 years until 2021 with increasing gross and net margins. However, we modeled its margins at a 5-year forward average of 39.33% for its gross margins which is only slightly higher compared to the company’s 5-year average of 37.4%. We expect its flattish margin outlook due to the potential costs incurred for its Microsoft partnership as its adtech provider. Thus, we believe that while Netflix’s introduction of its ad subscription plan could drive its revenue growth and compete against AVOD competitors, it would not benefit the company’s profitability margins.
Risk: Cannibalized Revenue
We believe one of the risks with the introduction of Netflix’s new ad-supported subscription is the cannibalization of its premium streaming service. Based on our estimate of the company’s cannibalized SVOD subscribers per year of 21.3 mln, we estimated the cannibalized SVOD revenue per year with our estimated SVOD revenue per user. We then calculated the total AVOD revenue for our estimate of the cannibalized subscribers in terms of subscription revenue and ad revenue. We subtracted the cannibalized revenue and AVOD revenue to obtain the net cannibalized revenue. Moreover, we estimated the organic revenue growth for its AVOD subscribers and calculated the net revenue gain by summing it with our net cannibalized revenue as seen in the table below.
|
Cannibalized Revenue Base Case |
2022F |
2023F |
2024F |
2025F |
2026F |
|
Cannibalized SVOD Subscribers (‘mln’) |
21.3 |
21.3 |
21.3 |
21.3 |
21.3 |
|
Cumulative Cannibalized SVOD Subscribers (‘mln’) |
21.3 |
42.6 |
63.9 |
85.2 |
106.5 |
|
SVOD Revenue Per User ($) |
12.41 |
13.19 |
14.03 |
14.91 |
15.85 |
|
Cannibalized SVOD Revenue ($ mln) |
3,172 |
6,744 |
10,756 |
15,247 |
20,264 |
|
AVOD Subscribers (‘mln’) |
21.30 |
42.60 |
63.91 |
85.21 |
106.51 |
|
AVOD Subscription Revenue Per User ($) |
5.46 |
5.80 |
6.17 |
6.56 |
6.97 |
|
AVOD Subscription Revenue ($ mln) |
1,394 |
2,965 |
4,729 |
6,704 |
8,909 |
|
AVOD Ad Revenue Per User ($) |
38.49 |
38.49 |
38.49 |
38.49 |
38.49 |
|
AVOD Ad Revenue ($ mln) |
820 |
1,640 |
2,460 |
3,280 |
4,100 |
|
Total AVOD Revenue ($ mln) |
2,214 |
4,605 |
7,189 |
9,984 |
13,009 |
|
Net Cannibalized Revenue ($ mln) |
-957 |
-2,139 |
-3,567 |
-5,264 |
-7,254 |
|
Cumulative Cannibalized AVOD Subscribers (‘mln’) |
21.3 |
42.6 |
63.9 |
85.2 |
106.5 |
|
Total AVOD Subscribers (‘mln’) |
21.3 |
50.3 |
89.8 |
143.7 |
217.0 |
|
Organic AVOD Subscribers (‘mln’) |
0.0 |
7.7 |
25.9 |
58.5 |
110.5 |
|
AVOD Subscription Revenue Per User ($) |
5.46 |
5.80 |
6.17 |
6.56 |
6.97 |
|
AVOD Subscription Revenue ($ mln) |
0 |
537 |
1,919 |
4,601 |
9,244 |
|
AVOD Ad Revenue Per User ($) |
38.5 |
38.5 |
38.5 |
38.5 |
38.5 |
|
AVOD Ad Revenue ($ mln) |
0 |
297 |
998 |
2,251 |
4,254 |
|
Total Organic AVOD Revenue ($ mln) |
0 |
834 |
2,918 |
6,851 |
13,498 |
|
Net Revenue Gain |
-957 |
-1,305 |
-649 |
1,588 |
6,243 |
Source: Company Data, Khaveen Investments
For our base case, we assumed the company’s pricing based on the same estimates that we used for the main points as discussed above. As seen in the table, we estimated the company to only break even in 2025 with a positive net revenue gain of $1.588 bln.
|
Scenario Analysis |
2022F |
2023F |
2024F |
2025F |
2026F |
Average |
|
Base Case |
-957 |
-1,305 |
-649 |
1,588 |
6,243 |
984 |
|
Minor Bear Case (Pricing 8% Less) |
-1,134 |
-1,740 |
-1,458 |
241 |
4,123 |
6 |
|
Major Bear Case (Pricing 16% Less) |
-1,312 |
-2,175 |
-2,266 |
-1,106 |
2,002 |
-971 |
Source: Company Data, Khaveen Investments
For our scenario analysis, assuming an 8% lower pricing for our minor bear case, our calculations show that the company to barely breakeven by 2025 but with a lower average net revenue gain of $6 mln per year. Whereas in our major bear case which assumes pricing to be 16% lower than our estimates, our calculations show it to break even only by 2026 with a negative average net revenue per year of -$971 mln.
Verdict
We valued Netflix with a discounted cash flow (“DCF”) analysis as we expect the company to continue generating positive free cash flows (“FCFs”). Based on a discount rate of 9.3% (company’s WACC) and the company’s average 3-year EV/EBITDA of 15.04, our model shows its shares are fairly valued.
Company Data, Khaveen Investments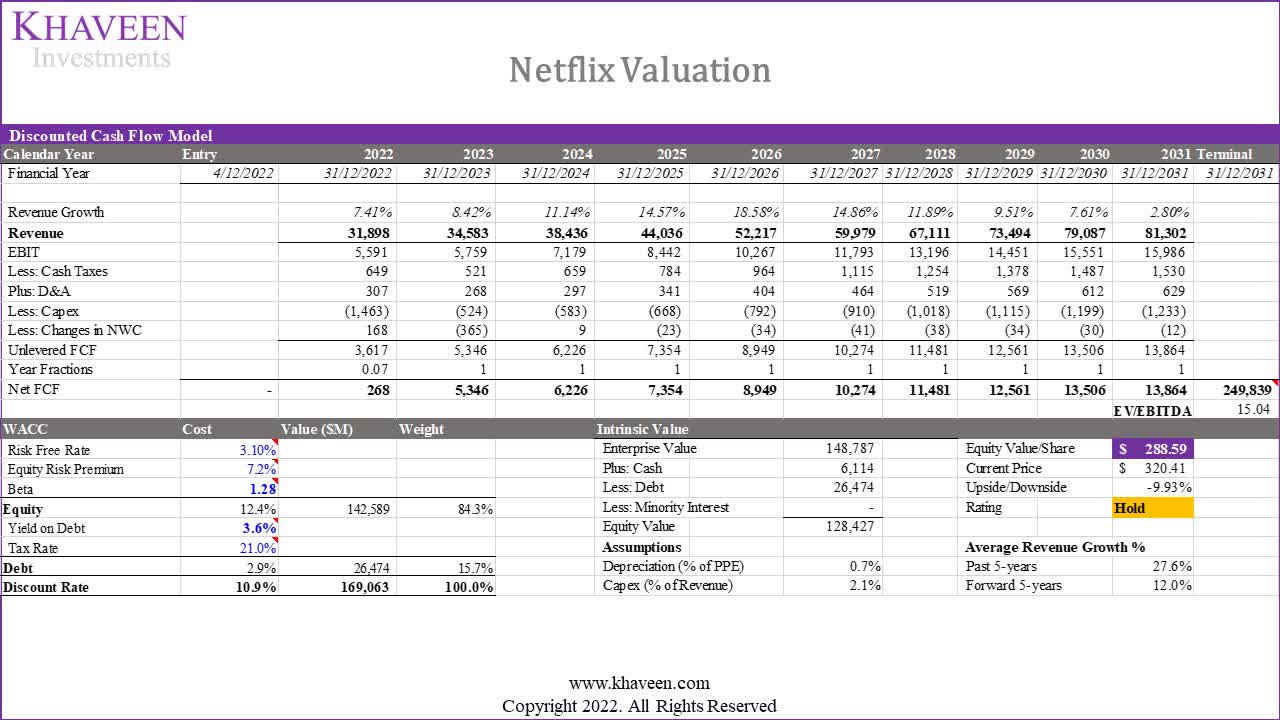
All in all, with the introduction of Netflix’s new ad subscription plan, we expect Netflix’s AVOD subscribers to grow by 21.3 mln per year by cannibalization and organic growth of 36.2% per year through 2026 for its total subscriber growth rate of 9.9% for its forward average. Moreover, we see Netflix’s revenue growth growing by an average of 12% through 2026 in the table above. We find its margins at a 5-year forward average of 39.33% for its gross margins which is slightly higher compared to the company’s 5-year average of 37.4%. However, we find the shift in Netflix’s business model is still unable to keep it ahead of its new competitors. Overall, we rate Netflix as a Hold with a price target of $288.59.
Be the first to comment