

hapabapa/iStock Editorial via Getty Images
Everyone who pays attention to financial news will be aware of Netflix’s (NASDAQ:NFLX) massive share price decline following the Q1 earnings report on April 19th. The reported Q1 EPS was 22% above the consensus expected value. The prevailing narrative is that the decline in the number of subscribers and predicted further shrinkage, an unexpected situation, triggered the sell-off. The shares fell 35% on the trading day following the report, April 20th, and are down another 5% on April 21st.
Seeking Alpha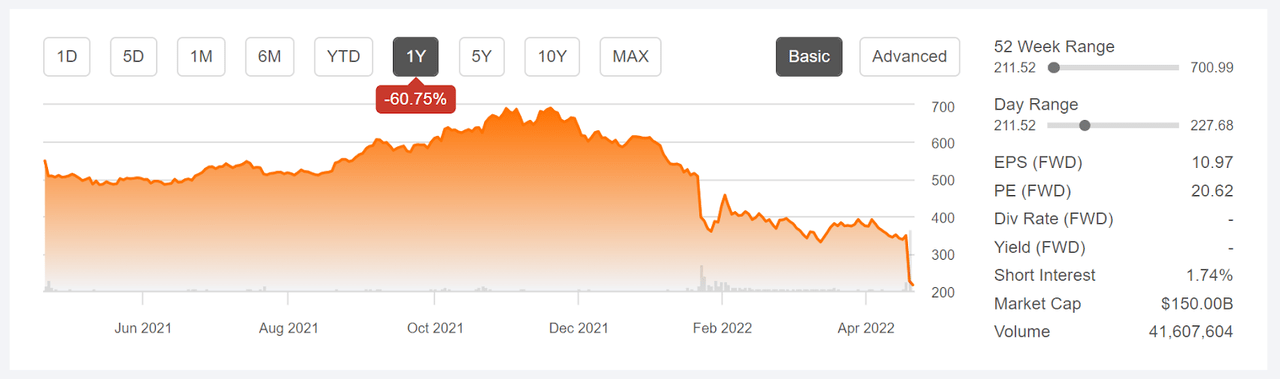
12-Month price history and basic statistics for NFLX (Source: Seeking Alpha)
The reduction in subscriber numbers is a shock because so much of the foundation for the valuation is on high expected growth. After the post-earnings collapse, the forward P/E is 20.6 and the TTM P/E is 21.6, multiples that do not require a high growth rate to justify. This is, in fact, a lower P/E than many utility stocks. By way of example, Southern Company (SO) has a forward P/E of 21.56 and Duke (DUK) has a forward P/E of 21.13.
The recent decline must be considered in a larger context. NFLX hit a 12-month high close of $691.69 on November 17, 2021 and had fallen 50.4% to close at $348.61 just prior to the Q1 report. The current share price is 68.6% below the 12-month high close. After reporting record Q1 EPS for 2021 on April 20th, the quarterly earnings were lower in Q2 and Q3 and then dramatically lower still for Q4. In other words, the results through much of 2021 provided ongoing evidence of slowing growth and the price declined as a result. The outsized drop on April 20th may signal more about investor capitulation at a massive scale than being a rational response to the recent results.
My argument is that Netflix has been struggling over at least the last 12 months and that there has been solid evidence of problems with the valuation, but many investors ignored these data points. I last wrote about NFLX more than a year ago, on February 28th, when I assigned a sell rating.
Seeking Alpha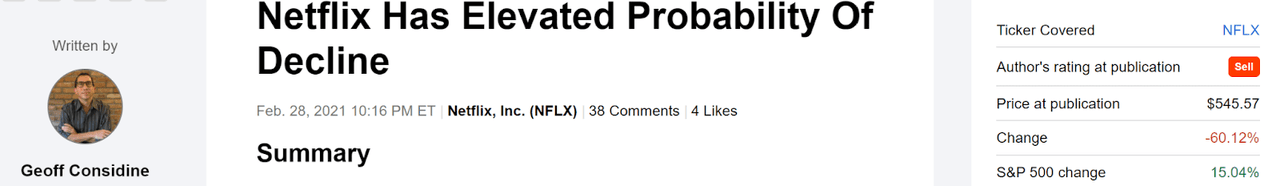
Performance of NFLX since my last analysis on February 28, 2021 (Source: Seeking Alpha)
When I wrote this post, NFLX had missed EPS expectations for the past 4 quarters and the TTM P/E was 93. The Wall Street consensus rating was bullish and the 12-month consensus price target was about 15% above the share price at that time. A significant red flag was that there was a high level of dispersion among the individual analyst price targets, reducing the meaningfulness of the consensus value. Among 31 analysts that ETrade aggregated in calculating the consensus, the highest 12-month price target was $750 and the lowest was $340. As I have noted in many of my posts, having the highest price target at 2X or higher than the lowest is my rule of thumb for discounting the consensus. Research has shown that the consensus price target has a negative correlation with subsequent performance when dispersion is high. In other words, the Wall Street consensus analysis was sending a bearish signal in February of 2021, even though the consensus rating was bullish and the consensus price target indicated an expected 15% gain. I did not call out this price target dispersion issue in my February 2021 post, although I do in many other posts.
Another major concern in early 2021, one that carried a lot of weight in my analysis, was that the options market was sending a strongly bearish signal. In analyzing stocks and ETFs, I rely on the market-implied outlook, a statistical forecast of price returns that is calculated from options prices and represents the consensus view among buyers and sellers of options.
I assigned a sell rating to NFLX based on the very high valuation, the 4-quarter string of earnings misses, and the bearish market-implied outlook to early 2022. I did not cite the high dispersion among the analyst price targets as a concern, but this was also a warning sign.
For readers who are unfamiliar with the market-implied outlook, a brief explanation is needed. The price of an option on a stock reflects the market’s consensus estimate of the probability that the stock price will rise above (call option) or fall below (put option) a specific level (the option strike price) between now and when the option expires. By analyzing the prices of call and put options at a range of strike prices, all with the same expiration date, it is possible to calculate the probabilistic price forecast that reconciles the options prices. This is the market-implied outlook. For a deeper explanation than is provided here and in the previous link, I recommend this excellent monograph published by the CFA Institute.
With more than a year since my last analysis, and with NFLX trading at a much lower valuation, I am revisiting my rating. I have calculated the market-implied outlook through the end of 2022 and I compare this to the current Wall Street consensus outlook, as in my previous post.
Wall Street Consensus Outlook for NFLX
ETrade calculates the Wall Street consensus outlook by aggregating the views of 38 ranked analysts who have published ratings and price targets for NFLX over the past 3 months. The consensus rating is bullish and the consensus 12-month price target is 46.3% above the current share price. As in my analysis last year, there is a large spread among the individual price targets. The highest is 2.4X the lowest. The research on the predictive value of the consensus indicates that this is actually a bearish outlook because of the high dispersion.
ETrade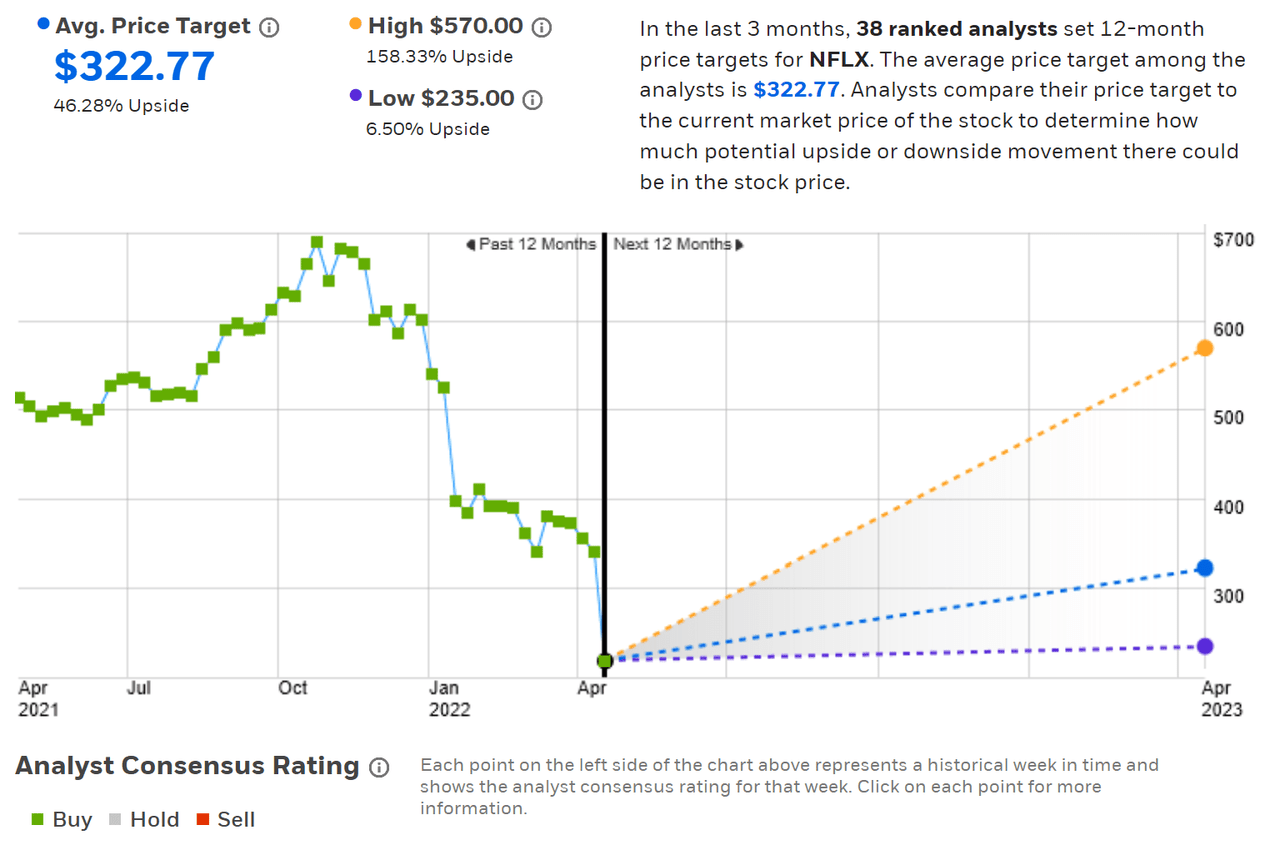
Wall Street consensus rating and 12-month price target for NFLX (Source: ETrade)
Seeking Alpha calculates the Wall Street consensus outlook using ratings and price targets issued by 44 analysts who have published their views over the past 90 days. The consensus price target is even higher than ETrade’s and the dispersion among the individual price targets is also higher than in ETrade’s analyst group. Seeking Alpha’s version of the consensus rating is a hold / neutral, as opposed to ETrade’s consensus buy rating.
Seeking Alpha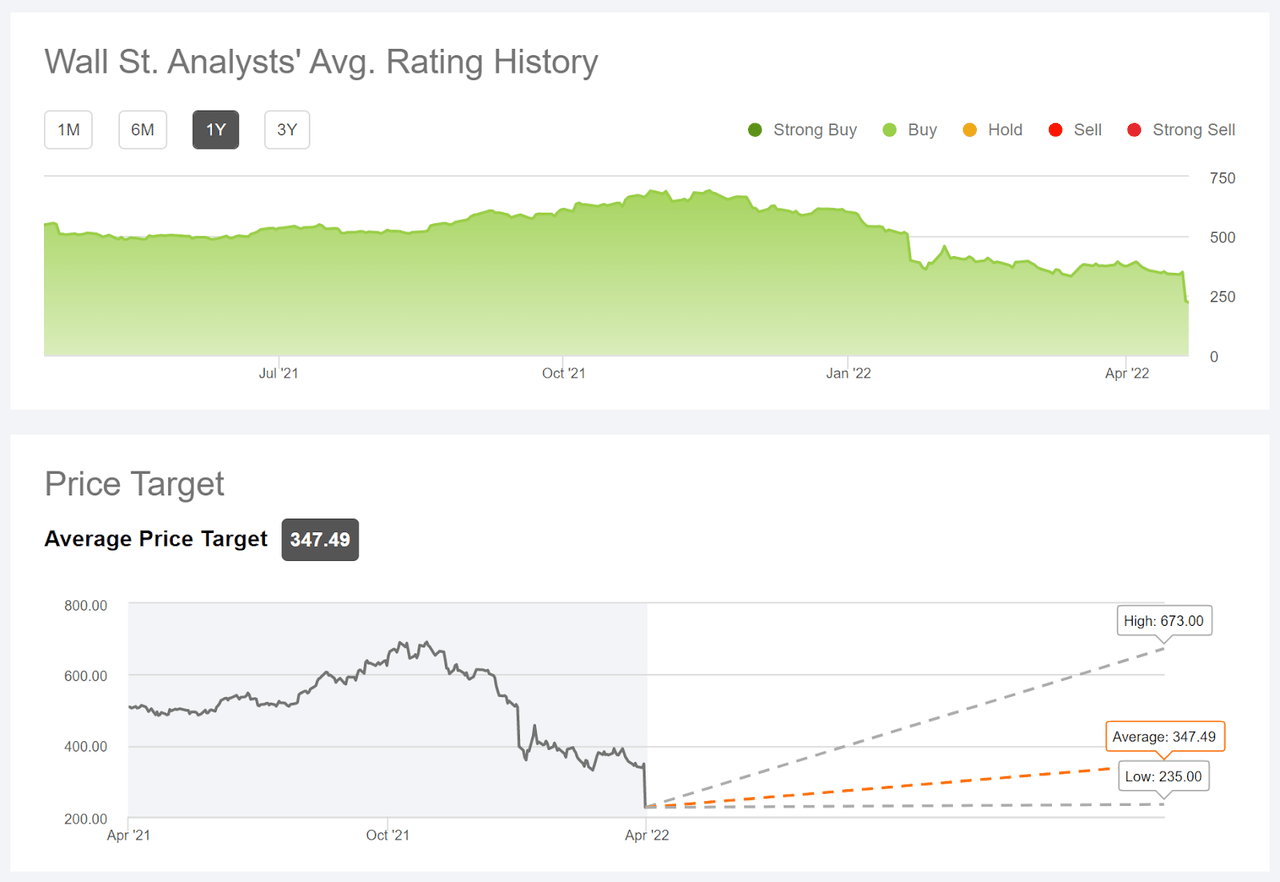
Wall Street consensus rating and 12-month price target for NFLX (Source: Seeking Alpha)
The Wall Street consensus outlooks calculated by ETrade and Seeking Alpha are consistent, with consensus 12-month price targets that are about 50% higher than the current share price and a very high level of dispersion among the individual analyst price targets.
Market-Implied Outlook for NFLX
I have calculated the market-implied outlook for NFLX for the 9-month period from now until January 20, 2023, using the prices of call and put options that expire on this date.
The standard presentation of the market-implied outlook is a probability distribution of price return, with probability on the vertical axis and return on the horizontal.
Geoff Considine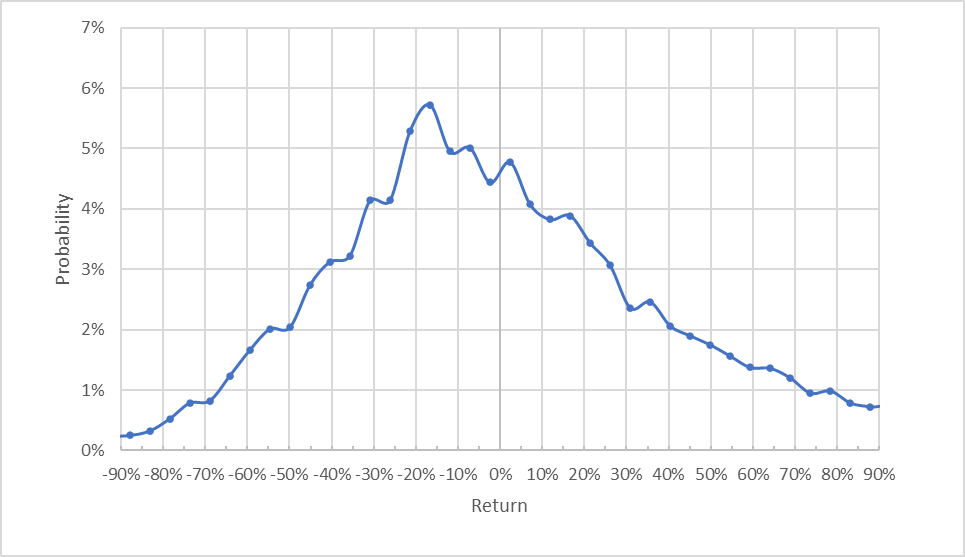
Market-implied price return probabilities for NFLX for the 9-month period from now until January 20, 2023 (Source: Author’s calculations using options quotes from ETrade)
The outlook for the next 9 months is significantly tilted to favor negative returns. The maximum probability corresponds to a price return of -17% for this period. The expected volatility calculated from this outlook is 51% (annualized). For comparison, ETrade calculates 47% implied volatility for the January 20, 2023 options.
To make it easier to directly compare the probabilities of positive and negative returns, I rotate the negative return side of the distribution about the vertical axis (see chart below).
Geoff Considine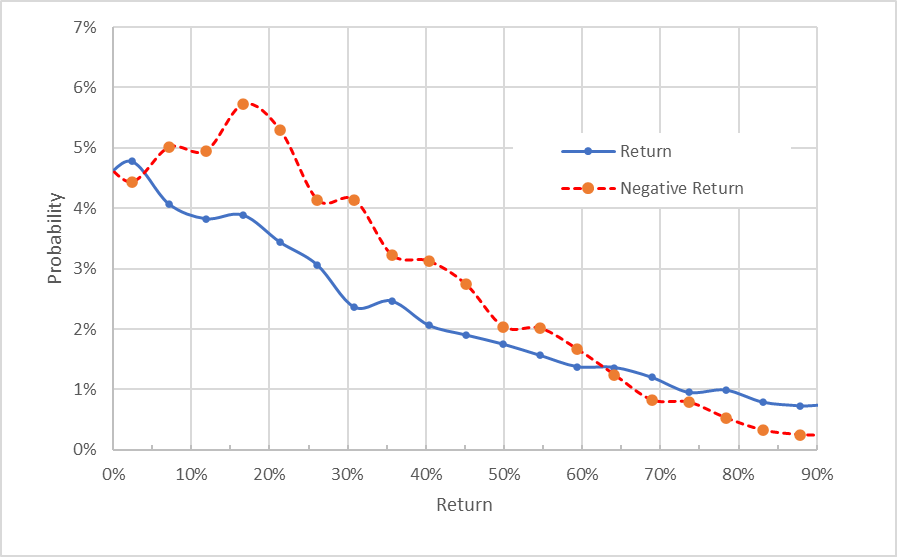
Market-implied price return probabilities for NFLX for the 9-month period from now until January 20, 2023. The negative return side of the distribution has been rotated about the vertical axis (Source: Author’s calculations using options quotes from ETrade)
This view really illustrates that the probabilities of negative returns are consistently and substantially higher than the probabilities of positive returns of the same size, across a wide range of the most probable outcomes (the dashed red line is well above the solid blue line over most of the left ⅔ of the chart above). This is a bearish outlook.
Theory suggests that the market-implied outlook will tend to have a negative bias because risk-averse investors tend to overpay for downside protection (put option), but there is no way to measure whether this bias is present. Considering the potential for a negative bias in the broader context of the range of market-implied outlooks that I have calculated does not change my interpretation of this market-implied outlook as substantially bearish.
Summary
NFLX’s huge drop following earnings represents a broad capitulation, as many investors appear to have lost faith in the company’s trajectory. A range of indicators have been sending bearish signals over the past year and the stock’s high valuations amplified the impacts of bad news. The very high dispersion among individual price targets is still present. The market-implied outlook continues to be bearish as well. While the consensus price target is around 50% above the current price, the rolling 90-day window that is typically used means that some of the price targets were made prior to the recent news which is, obviously, leading many to reevaluate the company’s prospects. Against all of this negative news, of course, the lower valuation makes the shares considerably more appealing. I am changing my rating on NFLX from bearish/sell to neutral/hold, even though there is an elevated probability of additional declines from here. NFLX may not be the growth engine that investors have come to expect, but the company has much to admire.
Be the first to comment