


imaginima
Investment Summary
We continue to see upside value in our broad healthcare exposure. Another name we’ve scaled into this year is Lantheus Holdings, Inc. (NASDAQ:LNTH) and we’re here today to outline the findings of our LNTH risk/reward calculus. Net-net, we see extensive upside for LNTH looking ahead coupled with a lengthy tail of asset returns from its share price. Following the positive outlook from its Q3 numbers, we suggest a price objective of $142, hence are quite constructive on this name. LNTH’s quarterly revenue, EBITDA, FCF yield from FY16–date are observed in Exhibit 1.
Exhibit 1.
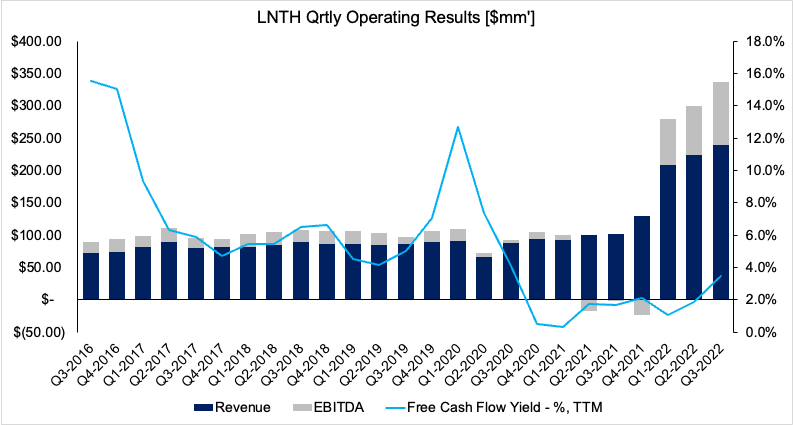
Data: HBI, LNTH SEC Filings
LNTH recent developments
LNTH advised on November 14 that it had obtained exclusive worldwide licensing rights to POINT Biopharma Global’s (NASDAQ:PNT) radiopharmaceutical cancer drug candidates, PNT2002 and PNT2003.
As a quick reminder, PNT2002 is a prostate-specific membrane antigen (“PSMA”) targeted therapy indicated for metastatic castration-resistant carcinoma (“MCRPC”). Meanwhile, PNT2003 has its focus as a somatostatin receptor targeted radiogland therapy (“SSTRRT”) indicated in therapeutic treatment of gastroenteropancreatic neuroendocrine tumours. Hence, we believe this to be a well-reasoned move for LNTH.
The company paid an upfront cash consideration of $260mm, yet the deal has an embedded commercial milestone payments of roughly $1.8Bn to PNT over both compounds. Not only that, but LNTH agrees to pay PNT royalties at a rate of 15% and 20% of net sales for PNT2003 and PNT2002 respectively. Note, these optionalities are contingent on FDA approval.
Regarding who will do the heavy lifting for both products, we note the following from the release:
“Under the agreements, POINT will fund and complete its Phase 3 SPLASH trial for PNT2002, following which Lantheus will file the New Drug Application (NDA) in collaboration with POINT. For PNT2003, POINT will facilitate completion of the ongoing University Health Network (UHN) – sponsored ongoing OZM-067 study in Canada, while Lantheus will prepare and submit the regulatory filings in the U.S. Upon consummation of the agreements, the companies will form joint steering committees to oversee the clinical studies, regulatory filings, manufacturing and commercial readiness for both PNT2002 and PNT2003.”
LNTH expects revenue and EPS accretion from the deal if and when PNT2002 is ready for commercialization. We’d suggest this is a key focus area for investors to zoom in on in the LNTH investment debate, as it broadens its prostate cancer therapy enterprise.
Q3 earnings: divergence from LNTH share price
Switching to LNTH’s financial results, we note there’s several data points worth highlighting. Firstly, quarterly revenue grew 134% YoY to $239.3mm, driven by strengths across the portfolio.
We also saw that OpEx margin came in at 16.7% of turnover, well behind the 40.2% OpEx margin last year. Plus, and despite the broad downtrend of capital investments in healthcare this year, LNTH lifted its quarterly CapEx by $3.7mm YoY to $6.1mm.
We were particular impressed by the numbers made by the company’s PSMA PET imagine agent, PYLARIFY. This segment was the key standout for Q3 in our eyes.
To illustrate, there were several noteworthy growth numbers worth mentioning in the PYLARIFY segment. For example, we noted the following:
- Management noted PYLARIFY is now “firmly established as the leading PSMA PET imaging agent” on the earnings call. If you didn’t know already, the agent has strengths in its ability to selectively bind to >90% of prostate cancer cells. This helps physicians to identify the extent and classification of the disease — a key differentiator.
- PYLARIFY sales came in at $143.8mm, and was used in >30,000 patient scans during the quarter. We note this tremendous growth for a segment launched just 18 months ago.
- LNTH’s partner in Europe, Curium, filed marketing authorization with the European Medicines Agency in June. It also presented top line results from its PYTHON pivotal phase 3 trial last month at the European Society for Nuclear Medicine. For further information on the trial’s outcomes, primary objectives, and endpoints, we encourage investors to check out the study description in the clinical trials database.
- We noted that management revised agreements with an existing PET manufacturing facility (“PMF”) to double the number of locations that manufacture PYLARIFY. It now expects its PMF network to expand by 50% by the end of FY23’.
- Speaking of customers, the company noted >1,000 customers have ordered PYLARIFY, and this base has a 97% reorder rate. To us this demonstrates LNTH’s deep customer network and also illustrates the connectedness it has with its physician and oncologist/radiation oncologist network.
With respect to the divisional highlights, there were many. To name a few:
- The precision diagnostics segment clipped revenue of $89mm for the quarter, up 130bps YoY.
- Meanwhile, DEFINITY sales were up 540bps from the year prior at $60.7mm. This figure is net of rebates and allowances.
- TechneLite net sales of $22.1mm narrowed by 210bps and was the weaker of the company’s core operations.
- Finally, revenue from the radiopharmaceutical oncology division was undoubtedly the star performer, underpinned by the growth in PYLARIFY sales listed above.
Technicals help to understand recent downside
Despite all its positives in Q3, investors were net sellers of LNTH last month, with the trend continuing post-earnings.
LNTH rallied for the entire pandemic era until around September/October this year, when the stock then curled down beneath the 50DMA and 250DMA respectively. Soon afterwards, these two moving averages also crossed to the downside [Exhibit 2].
However, we also note that LNTH is 97.8% owned by institutional investors, hence, selling activity is likely to result in volatility in our estimation. We see evidence of the same as institutions reduced net exposure by -25.7% in October and -25.9% in November, per Refinitiv Eikon data.
In practice, there are many explanations for this, ranging from taxation, quarterly portfolio rebalancing and profit taking to increase the cash position of the fund. We estimate a combination of these factors for LNTH these past 2 months.
Exhibit 2. LNTH 2-year price evolution

Data: Updata
Guidance revision adds to bullish outlook
We’d also highlight that management raised Q4 and FY22 guidance to the upside from the top-bottom lines.
It now projects a revenue range of $915–$919mm for the full year, up from $885–$905mm the year prior. Moreover, it expects to bring this down to adjusted EPS of $0.95–$0.98 in Q4, implying full-year adjusted EPS of $3.80–$3.83 [up 6.4% from a previous $3.50–$3.60]. Note, this calls for a 682.4% YoY increase at the bottom line. We don’t feel the market has priced this in just yet.
We are explicitly aligned with management on its assumptions and forecast management’s EPS number of $3.83 in FY22, stretching up to $4.01 and $4.62 in FY23’ and FY24’ respectively. You can see our projected EPS bridge for LNTH intoFY24’ below.
Exhibit 3.FY22-24’ EPS growth assumptions [qrtly, annual].

Data: HBI Estimates
Valuation and conclusion
We advise that consensus has LNTH valued at 15–20x forward P/E, based on non-GAAP and GAAP earnings respectively. However, we believe this is substantially undervaluing the company’s growth numbers.
Rolling our FY22 EPS assumptions forward, we believe the company should trade at a fair forward P/E of 37.2x [Exhibit 4], or $142.60 apiece.
This represents an upside potential of c.144%, thus confirming our buy thesis.
Exhibit 4. FY22 EPS Est. x 37.2 = $142.60
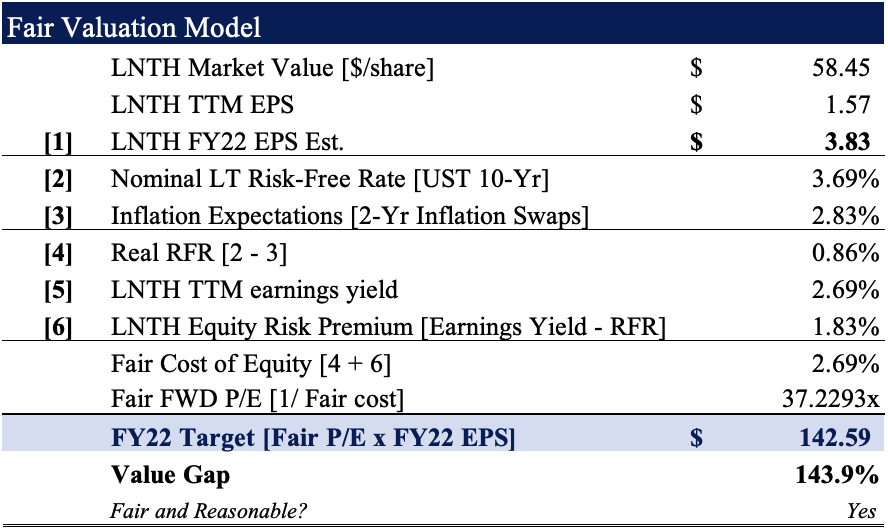
Data: HBI Estimates
To see our justification of this, observe the following:
1. LNTH has seen its return on invested capital (“ROIC”) stretch up back towards pre-pandemic highs. It printed TTM ROIC of c.18% in Q3, well above its cost of capital [Exhibit 5]. ROIC is also the maximum sustainable growth rate the company can achieve, without the use of leverage. Hence, 18% is an incredibly attractive number here in our opinion. This is coupled with large FCF inflows since Q1 this year.
Exhibit 5. Strength in ROIC and FCF from FY22
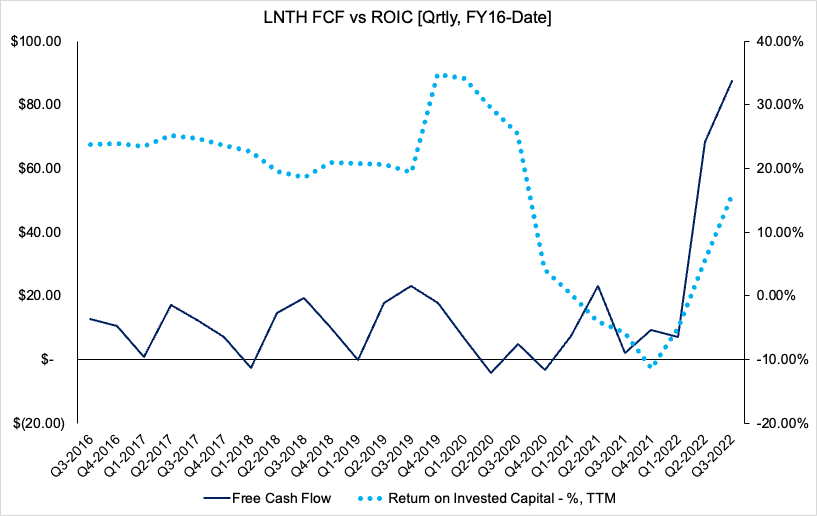
Data: HBI, LNTH SEC Filings
2. In addition, we point investors to LNTH’s economic value added (“EVA”) from Q4 last year [Exhibit 6]. ROIC is linked to valuation through EVA, and EVA also represents the degree of management’s ‘value-add’ above the cost of capital. This further supports our valuation.
Exhibit 6. LNTH EVA above cost of capital
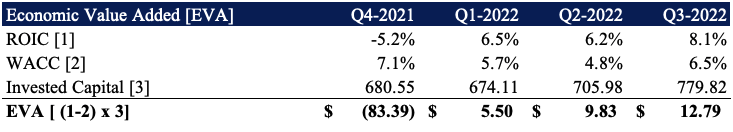
Data: HBI, LNTH SEC Filings
Net-net, we rate LNTH a buy on valuation and future value creation, setting a price objective to $142.
Be the first to comment