

Klaus Vedfelt/DigitalVision via Getty Images
Net Lease REITs are the third-best performing REIT sector so far this year. According to Hoya Capital Income Builder, Net Lease REITs as a whole have returned a gain of +1.13% YTD, while the Equity REIT average shows a loss of (-12.32)%.
Hoya Capital Income Builder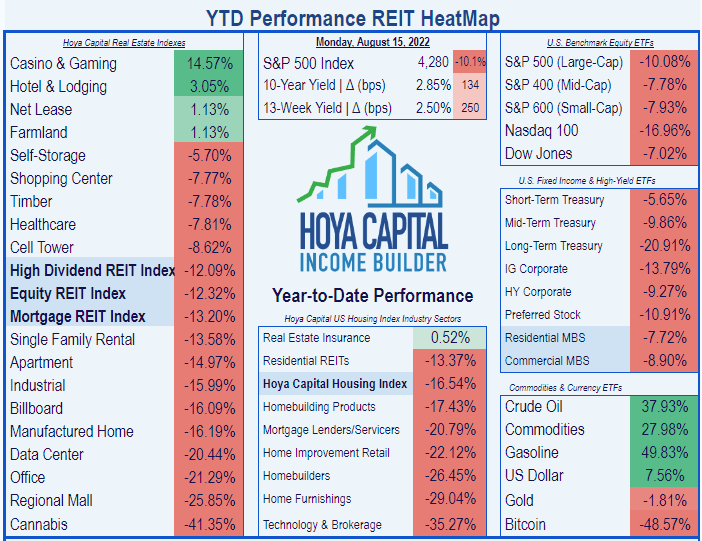
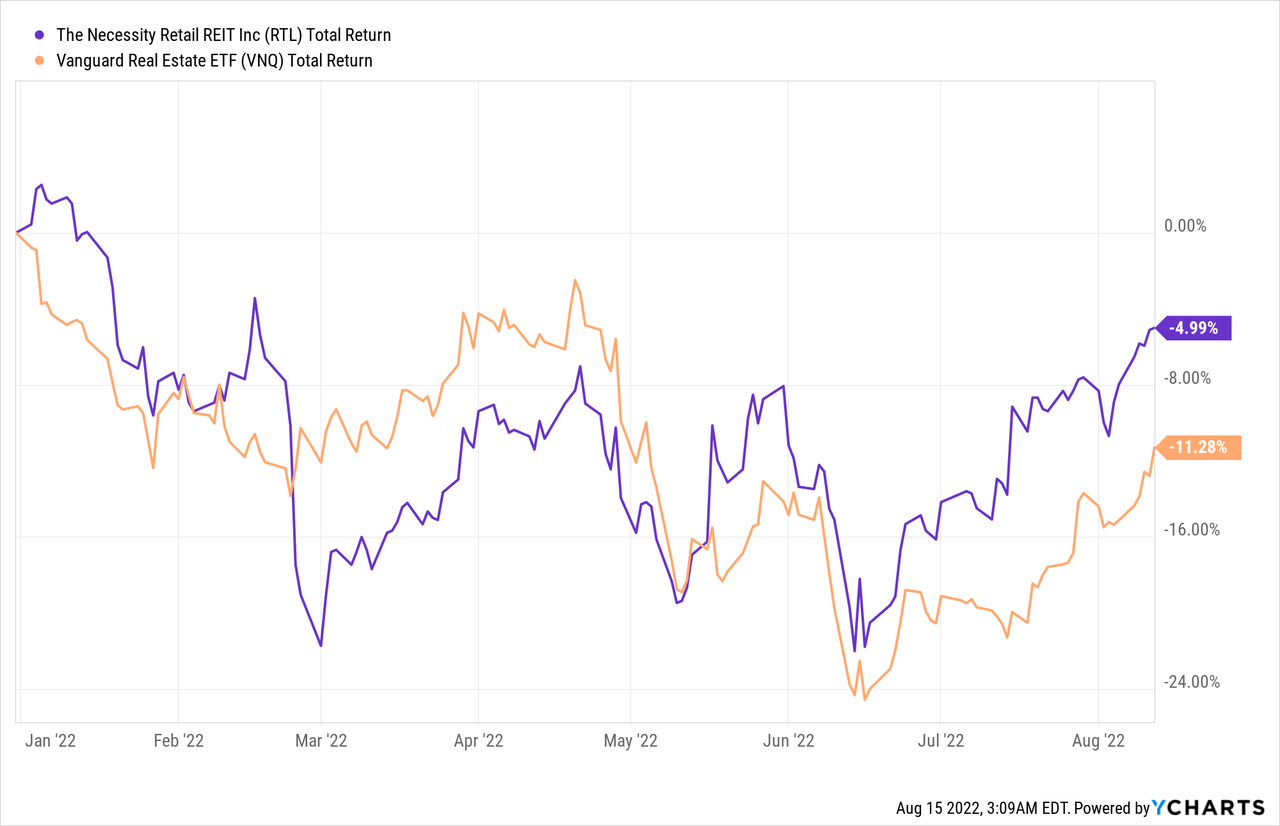
Necessity Retail’s (NASDAQ:RTL) 4.99% total return has outpaced the Net Lease REIT sector as well as the VNQ thus far.
What is the secret of this company’s success, and is it likely to continue?
Meet the company
Necessity Retail
Founded in 2013 and headquartered in New York, Necessity Retail is a small-cap Net Lease REIT, with a market cap of $1.07 billion. The company owns 1,057 properties in 48 U.S. states, with just 90.9% occupancy, earning $389 million per year in SLR (straight-line rent), on leases with a remaining average term of 7.2 years. RTL is externally managed by AR Global, which also manages mousetrap REIT Global Net Lease (GNL).
RTL divides its portfolio into 4 segments:
- Single-Tenant portfolio (48% of SLR), rented long term to primarily stable investment grade tenants, this segment includes 941 properties, comprising 12.3 million square feet, with occupancy of 95.7% (much higher than the total portfolio average), 9.9-year average remaining lease term, 81% leased to retail and 17% leased to industrial tenants.
- Power Center portfolio (28% of SLR) anchored by national brand retailers.
- Anchored Center portfolio (13% of SLR) featuring multiple big box stores.
- Grocery Center portfolio (11% of SLR), anchored by grocery stores and highly resistant to economic downturns due to necessity-driven and in-person nature of grocery shopping.
RTL website
The Power, Anchored, and Grocery-centered segments, also known as the “open-air portfolio,” combine for 113 properties across just 29 states, with 17.0 million square feet, and occupancy of just 87.6%. Only 41% of the tenant are investment grade, and average remaining lease term much shorter, at 4.6 years. However, these three segments still account for 52% of SLR when combined. Management aims to raise occupancy by about 5%, to the low-to-mid 90’s.
The overall tenant base is appropriately diversified, with the top customer (Trust Bank) accounting for just 3.9% of SLR, and the top 10 together contributing just under 30%. Tenants include many well-recognized national brands.
RTL website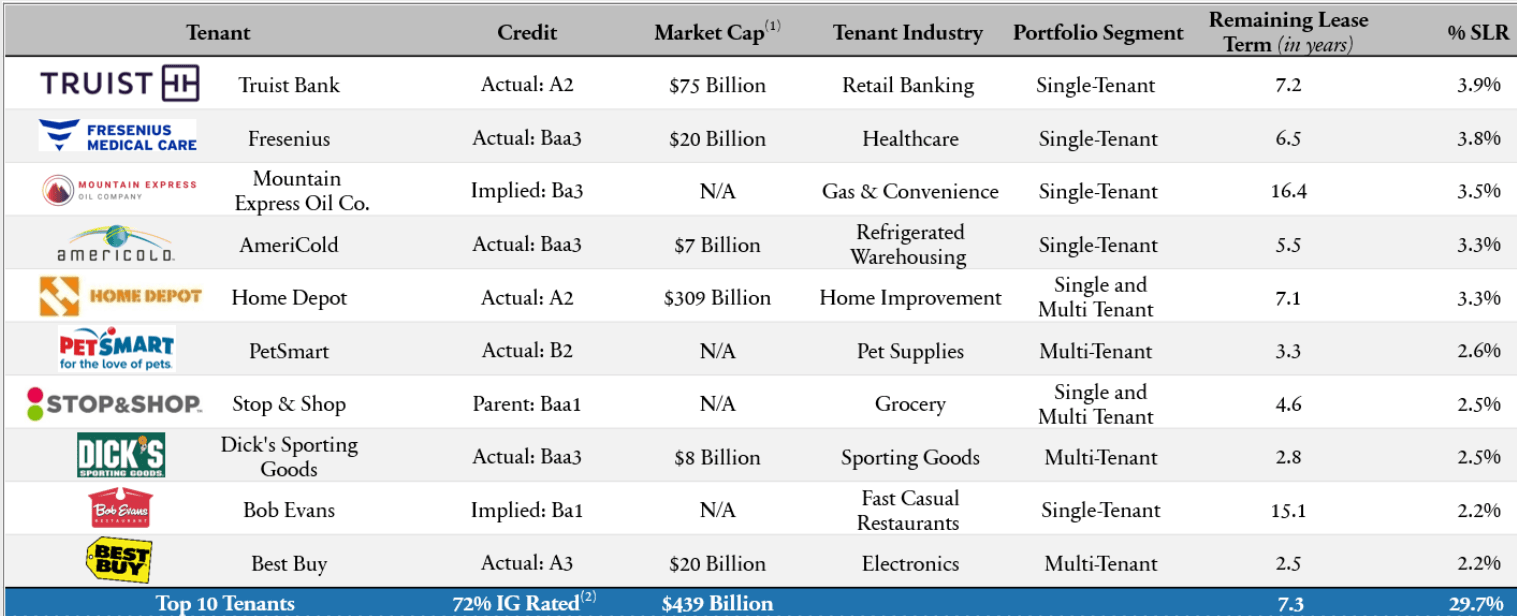
RTL is highly diverse geographically. Although 57% of SLR comes from the Sunbelt, the balance is spread all across the country, especially in dense suburbs with “community-centric lifestyles.” The heaviest concentration is in Georgia, which accounts for only 10% of SLR.
RTL website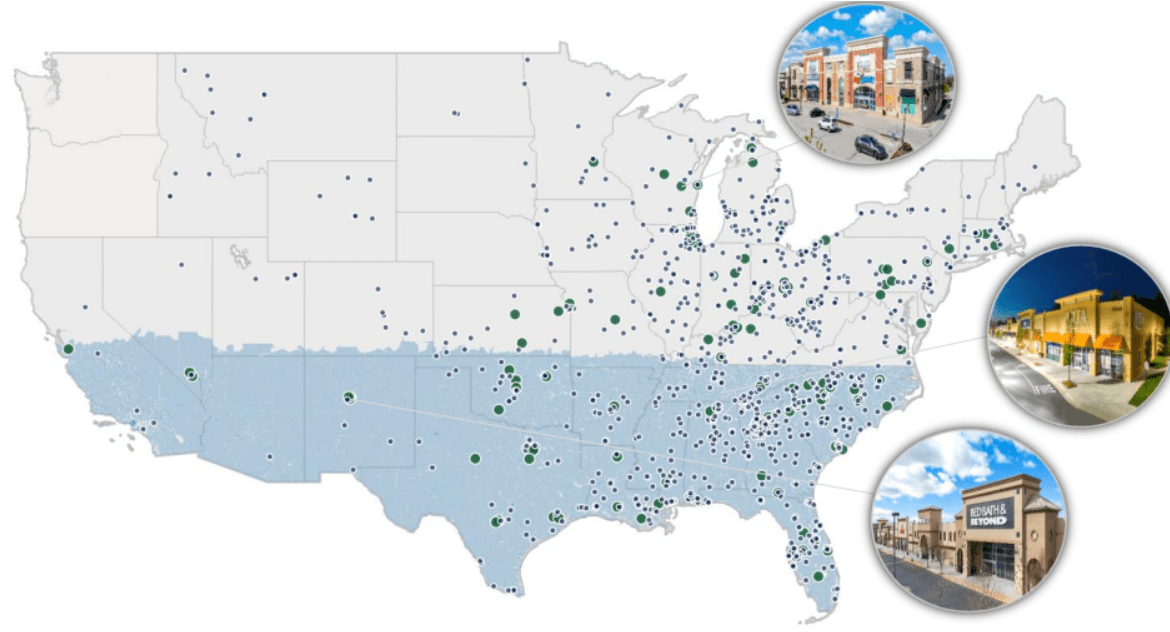
Tenants are also highly diverse by industry. Out of 44 industries represented in the tenant base, gas/convenience stores lead the way at just 8% of SLR, followed by discount and specialty retailers, at 7% each.
RTL website
The company’s acquisition strategy focuses on:
- Credit-worthy tenants with robust unit-level financial metrics and competitive advantages in sustainable industries, and
- Locations that serve as a central neighborhood destination for nearby residents,
- In secondary U.S. markets with strong growth profiles and demographics.
For their single-tenant segment, they seek service-oriented retail properties. For the open-air segment, they look for necessity-based and downturn-resistant retail.
Management went on a buying spree in H1, adding 79 multi-tenant properties to the open-air segment, and 12 single-tenant properties. The open-air center acquisitions cost a staggering $1.3 billion, growing the company’s total square footage by about 10 million, an increase of 45%.
Quarterly results
Here are the Q2 highlights, according to the company’s 10-Q for Q2 2022:
- Revenue from tenants was up 43.3% YoY (year-over-year), at $116.9 million.
- Operating expenses exploded by 144% YoY, to $153.5 million. Property operating expense more than doubled to $27.5 million, G&A expense more than doubled to $8.4 million, and the company showed a huge leap in “impairment of real estate investments,” from $91 thousand to $59 million. This impairment charge reflected the company’s decision to remove from their books a property in Minnesota that they intend to sell.
- Once interest expenses are added in, the company lost $50.5 million in Q2, compared to a loss of “only” $1.5 million in Q2 2021.
- Net loss per share was (-$0.43), compared to (-$0.07) in Q2 2021.
- RTL increased share count by 19.6% over the past 12 months.
- Net cash from operations was $104.6 million, up 60% YoY.
- Total capex $1.8 million, down from $4.4 million YoY.
- Same-store NOI of $16.5 million, down 13.5% YoY.
- Newly-acquired stores posted $21.1 million in NOI.
- FFO of $35.7 million, up 42.6% YoY, thanks to acquisitions.
- FFO per share $0.27, up 17.4% YoY.
- Completed acquisition of $1.3 billion worth of open-air shopping centers.
For the first half of 2022, these are the highlights:
- Revenue from tenants of $211.9 million, up 31.8% YoY.
- Net operating income of $44.2 million, up 28.5% YoY
- Net loss of (-$4.65) million, compared to (-$5.24) million in H1 2021, after factoring in interest expense.
- Net loss per share of (-$0.13), compared to (-$0.16) in H1 2021.
- Share count increased by 19.1% YoY.
- Total assets of $4.7 billion, up sharply from $3.8 billion YoY.
- Total capex $5.2 million, down from $6.8 million YoY.
Base rent revenues in 2023 will be $353 million, tapering off each year to just $223 million by 2027.
Company 10-Q for Q2 2022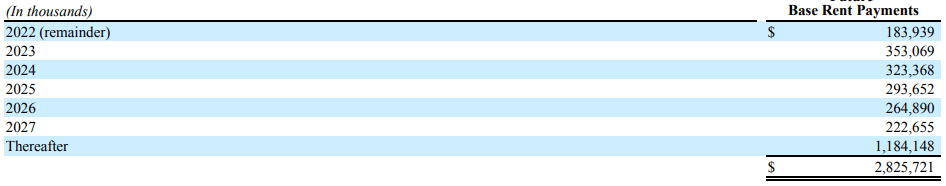
Rent collections for RTY were hit hard during the 2020 pandemic, but have recovered to 99% as of Q2.
Growth metrics
Here are the 3-year growth figures for FFO (funds from operations), TCFO (total cash from operations), and market cap.
| Metric | 2019 | 2020 | 2021 | 2022* | 3-year CAGR |
| FFO (millions) | $98.6 | $97.0 | $97.3 | $137.2 | — |
| FFO Growth % | — | (-1.6) | 0.0 | 41.0 | 11.6% |
| FFO per share | $0.93 | $0.90 | $0.83 | $1.03 | — |
| FFO per share growth % | — | (-3.2) | (-7.8) | 24.1 | 3.5% |
| TCFO (millions) | $105.6 | $92.7 | $145.3 | $210.0 | — |
| TCFO Growth % | — | (-12.2) | 57.7 | 44.5 | 25.75% |
*Projected, based on H1 2022 results
Source: TD Ameritrade, CompaniesMarketCap.com, and author calculations
The picture above tells a clear story. Of course, like all retail, RTY was hit by COVID, but because of the essential nature of its stores, the setback to FFO was relatively mild, and the 41% surge this year results in double-digit 3-year growth. But FFO/share is another matter, lagging FFO every year, and growing by only 3.5% as an annual average. This means the company is issuing new shares faster than it is growing revenue.
Meanwhile, cash flow took a hit in 2020, but has roared back in each of the last two years at phenomenal rates.
Meanwhile, here is how the stock price has done over the past 3 twelve-month periods, compared to the REIT average as represented by the Vanguard Real Estate ETF (VNQ).
| Metric | 2019 | 2020 | 2021 | 2022 | 3-yr CAGR |
| RTY share price Aug. 15 | $12.24 | $7.45 | $8.57 | $8.02 | — |
| RTY share price Gain % | — | (-39.1) | 15.0 | (-6.4) | (-13.14)% |
| VNQ share price | $90.25 | $81.15 | $106.76 | $102.26 | — |
| VNQ share price Gain % | — | (-10.1) | 31.6 | (-4.2) | 4.25% |
Source: MarketWatch.com and author calculations
RTY’s share price has underperformed the VNQ in each of the past 3 years. Investors have seen an average annual loss of (-13.14)%, compared to the VNQ’s plodding 4.25% gain. RTY’s superior dividend yield does not cover that 17.4% gap. It has been a mousetrap of significant proportions.
Balance sheet metrics
Here are the key balance sheet metrics, and this is where RTY presents the greatest cause for concern for investors.
| Company | Liquidity Ratio | Debt Ratio | Debt/EBITDA | Bond Rating |
| RTL | 1.58 | 55% | 17.4 | BB |
Source: Hoya Capital Income Builder, TD Ameritrade, and author calculations
The company’s Liquidity Ratio of 1.58 is down considerably from the 1.81 mark they held at the close of 2021. The company’s total debt for mortgage notes, senior notes, and credit facility loans comes to $2.75 billion as of June 30. The weighted average interest rate is 3.8%. RTL’s weighted average debt maturity is 4.6 years, and 83% of its total debt is fixed rate.
The company has cash and equivalents of $87 million through Q2, down from $237 million in H1 2021, despite a $390 million jump in cash from financing in H1 2022. Cash from investments netted (-$686 million) in H1, nearly 10 times the outflow in H1 2021. Total liquidity, including undrawn available credit, stood at just $108 million on June 30.
While debt maturities are very low for the remainder of this year, and only $26.6 million in 2024 after $289.8 million next year, total payments due will leap to $707.9 million and $604.9 million in 2025 and 2026, respectively. These are pretty high hurdles for a company that is losing money as of today.
Company 10-Q for Q2 2022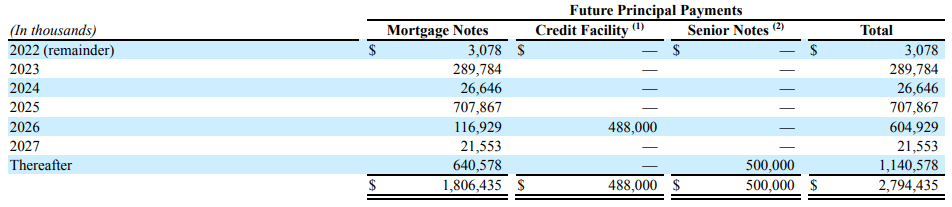
RTL has disposed of 13 properties YTD, totaling nearly $300 million in proceeds, and has another 10 properties totaling nearly $100 million in the disposition pipeline. Some of the proceeds from these dispositions will be used to repay debt. CEO Michael Weil said on the Q2 earnings call that RTL will be either neutral or a net disposer of property in the coming year.
Dividend metrics
RTL’s inflation-beating 10.6% yield is its main attraction, high even for a Net Lease REIT. However, the company did suspend its dividend in H2 of COVID-stricken 2020, and switched from monthly to quarterly when it resumed in January 2021. Even when this is taken into account, the dividend yield is still head and shoulders above average.
Seeking Alpha grades the Dividend Safety a very precarious D-. This is of grave concern, because a cut in the dividend would almost certainly be followed swiftly by a sell-off in shares, as COWhand investors (Cash Only Wanted) seek greener pastures.
| Company | Div. Yield | 3-yr Div. Growth | Div. Score | Payout | Div. Safety |
| RTL | 10.6% | (-8.2)% | 8.20 | 80% | D- |
Source: Hoya Capital Income Builder, TD Ameritrade, Seeking Alpha Premium
Dividend Score projects the Yield three years from now, on shares bought today, assuming the Dividend Growth rate remains unchanged.
Valuation metrics
RTL shares are dirt cheap at 7.8 times 2022 FFO. In a sector that typically sells for a hefty premium to NAV, RTL sells at a discount of (-10.9)%, more than double the REIT average. This combination of high yield and low price is typically very attractive to value investors, even while setting off alarm bells for growth investors. Yield is high, in part because of poor performance in share price, and price may be low for a good reason. Hoya Capital has conclusively shown that cheap REITs tend to stay cheap.
| Company | Div. Score | Price/FFO ’22 | Premium to NAV |
| RTL | 8.20 | 7.8 | (-10.9)% |
Source: Hoya Capital Income Builder, TD Ameritrade, and author calculations
What could go wrong?
A great deal of the risk for this company derives from its external management structure. As GNL says of AR Global,
All of our executive officers face conflicts of interest, such as conflicts created by the terms of our agreements with the Advisor and compensation payable thereunder, conflicts allocating investment opportunities to us, and conflicts in allocating their time and attention to our matters. Conflicts that arise may not be resolved in our favor and could result in actions that are adverse to us.
The company has taken on a lot of new properties in a short time, with a lot of vacancy in those properties. RTL’s success going forward will depend significantly on its ability to lease all that new square footage.
Any cut in the dividend would be disastrous, as it would be swiftly followed by a decline in share price, making new share issuance far less fruitful. That, in turn, would threaten the company’s ability to service all the debt they just took on.
Investor’s bottom line
RTL is strictly a dividend play, and has proven recently to be a bit of a Yield trap, losing significantly more in the underlying share value than the dividends paid. There is pretty high risk of this pattern continuing, with a dividend cut in the near future an uncomfortably high risk. Nine years in, the company is not profitable, and is paying for its acquisition spree with a combination of much-increased debt and copious share issuance. Because maturities are mostly delayed until 2025, they can continue to get away with this for a while, but with shares selling for a 10% discount to NAV, new share issuance is dilutive.
All told, I see RTL as too risky to buy and too compelling to sell. While I am tempted to characterize this company as yet another mousetrap managed by AR Global, RTL has enough going for it to warrant a Hold rating. If you have a high need for inflation-beating yield, this is perhaps as good a bet as any.
Seeking Alpha Premium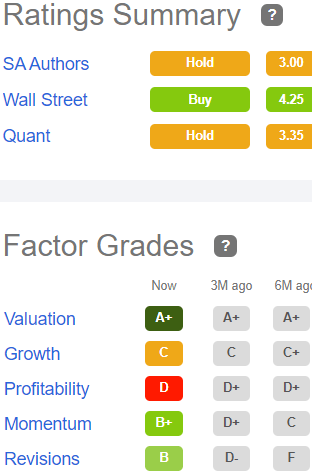
This puts me in step with the Seeking Alpha Quant ratings and other Seeking Alpha authors, as well as The Street, Zacks, and Ford Equity Research.
On the other hand, TipRanks rates RTL as Outperform, and 3 out of 4 Wall Street analysts rate the company a Buy or Strong Buy.
Your move.
Be the first to comment