The Weather
Last week
Last week (ending March 13), the number of heating degree days (HDDs) declined by 24.5% w-o-w (from 124 to 94). We estimate that total energy demand (as measured in total degree days, or TDDs) was 22.2% below last year’s level and as much as 27.8% below the 30-year norm. Cooling demand remained too weak to have a meaningful impact on natural gas consumption.
This week
This week (ending March 20), the weather conditions are getting colder. We estimate that the number of nationwide HDDs will rise by 18.2% w-o-w (from 94 to 111). Total average daily demand for natural gas should be somewhere between 102 bcf/d and 106 bcf/d, which is 11.9% above the 5-year average for this time of the year. However, despite higher HDDs, total energy demand (measured in TDDs) should be 6.1% below last year’s level and 4.5% below the 30-year norm.
Next week
Next week (ending March 27), the weather conditions are expected to get just slightly colder. The number of HDDs is currently projected to edge up by 1.8% w-o-w (from 111 to 113). In annual terms, however, total energy demand (measured in TDDs) is currently expected to jump by as much 17.2%. The deviation from the norm should turn positive (+3.6%) – for the first time since February 21.
Total Energy Demand
Source: Bluegold Research estimates and calculations
This winter season, the weather has been totally violent (for the bulls). Since November 2019, numerical weather prediction systems have shown significantly more “bearish changes” than “bullish changes” (see the chart below). The cumulative amount of potential TDDs lost over the past five months (November-March) due to changes in the weather models is estimated at 497 (or more than 2,000 bcf of potential natural gas consumption). Moreover, the largest bearish changes were for week 1, week 2 and week 3, which are normally covered by the standard short-range weather models.
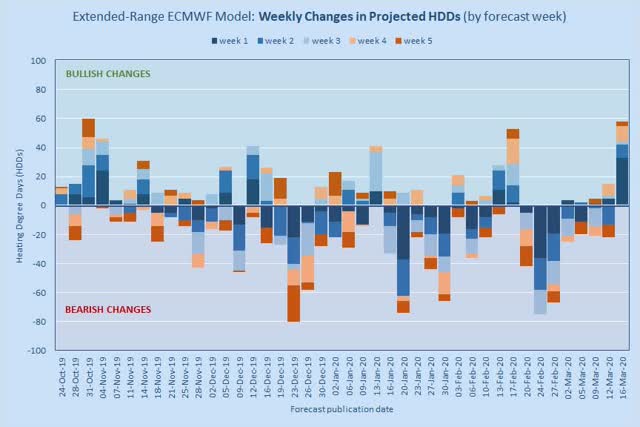 Source: ECMWF, Bluegold Research estimates and calculations
The bulls, however, may find comfort in knowing that, while the weather remains the key driver of natural gas consumption, its relative importance is slowly declining due to seasonal factors. May contract and subsequent summer contracts will be less weather-driven and more “price-driven” or “economics-driven.” Finally, the traders will be able to switch their attention from the chaotic weather models to something more orderly, such as fuel-switching economics.
The share of the Electric Power (EP) sector in the overall consumption mix will rise above 30% in April and above 50% in summer. Natural gas consumption in the EP sector is less susceptible to changes in the short-range weather models.
Coronavirus
However, in the very short term, no indicator, forecast or event is more important than the situation around the coronavirus. The disease, its spread and people’s reaction to it can potentially morph into a major cataclysm of global proportions.
We have to understand that coronavirus (or the government’s and people’s response to coronavirus) is disrupting our way of life. The net impact from coronavirus is bearish in the sense that its immediate impact is demand destruction. But demand can only be destroyed up to a point. Natural gas is a “commodity of necessity”. Without it, there will be no electricity, no heating, no cooking, no fertilizers, etc.
At the same time, coronavirus can potentially destroy supply because oil and gas crews cannot work from home. In total, therefore, the situation is a rather complex one and is evolving rapidly. It is best to remain very conservative in all your trading decisions.
We, at Bluegold Research, are fortunate enough to be able to work from home. Therefore, we will continue to monitor the situation in the global natural gas market, and we will keep you up to date. Also, we remain optimistic, and we believe that the world is well-equipped to withstand the challenges posed by COVID-19.
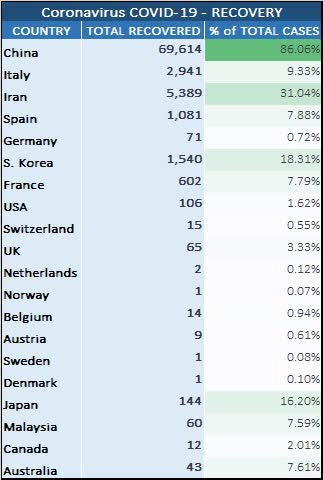
Source: Worldometers (website)
Total Supply-Demand Balance
Overall, the latest numerical weather prediction models (Wednesday’s short-range 00z runs) agree that, over the next 15 days, TDDs should remain slightly below the norm (on average).
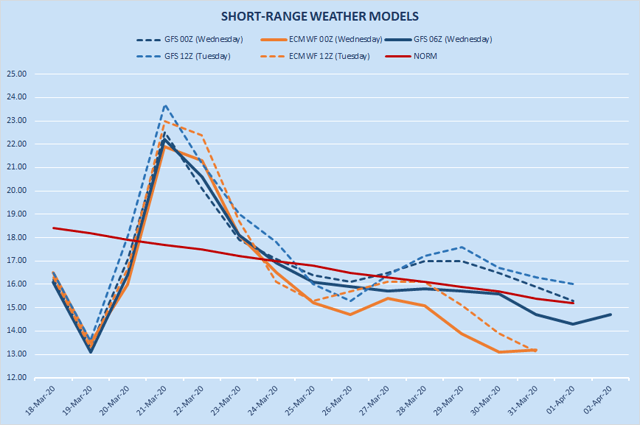 Source: NOAA, ECMWF, Bluegold Research
However, there is a disagreement in terms of scales: the latest GFS model (06z run) is projecting 86.5 bcf/d of potential natural gas consumption (on average over the next 15 days), while the ECMWF model (00z run) is projecting 85.6 bcf/d.
 Source: Bluegold Research estimates and calculations
Overall, over the next 15-day period, total demand (when adjusted for probability) is expected to average 100.8 bcf/d (some 15.6% above the 5-year average), supported (in part) by LNG sales and pipeline exports into Mexico.
We do not (yet) see any disruptions in the industrial demand, nor do we see any significant slowdown in LNG feedgas flows.
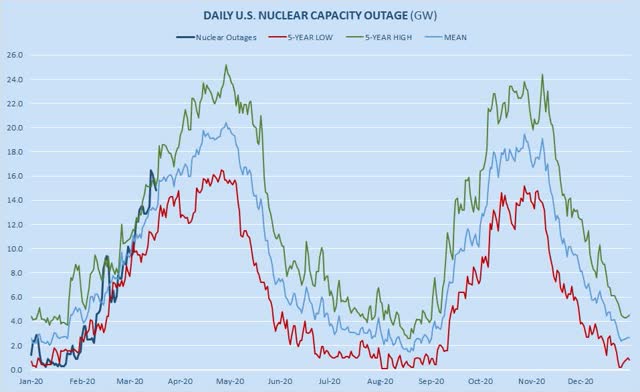
Non-degree-day factors have a bullish impact on natural gas consumption in both relative and absolute terms. We estimate that, at the current spread between natural gas and coal, coal-to-gas switching must be averaging approximately 7.9 bcf/d (1.3 bcf/d above last year’s level and 0.8 bcf/d above the 5-year average). Additionally, nuclear outages are spurring some extra consumption in the Electric Power sector. Indeed, the bullish impact from seasonal maintenance at nuclear power plants is likely to increase in the nearest future as nuclear outages are rising and should continue to rise until mid-April (at least).
However, stronger wind, hydro, and solar generation are having a negative impact on the potential power burn. On balance, however, we estimate that non-degree-day factors are currently having a bullish impact on potential natural gas consumption (compared to the same period in 2019). We estimate the net impact to be around +4.6 bcf/d (+0.5 bcf/d vs. 2019).
Overall, in the week ending March 20, we currently project that total unadjusted supply-demand balance in the U.S. will be looser (vs. the same week in 2019) but only by +2.0 bcf/d (as per EIA methodology). In the week ending March 27, we expect the balance to tighten up to -7.5 bcf/d (see the table below).
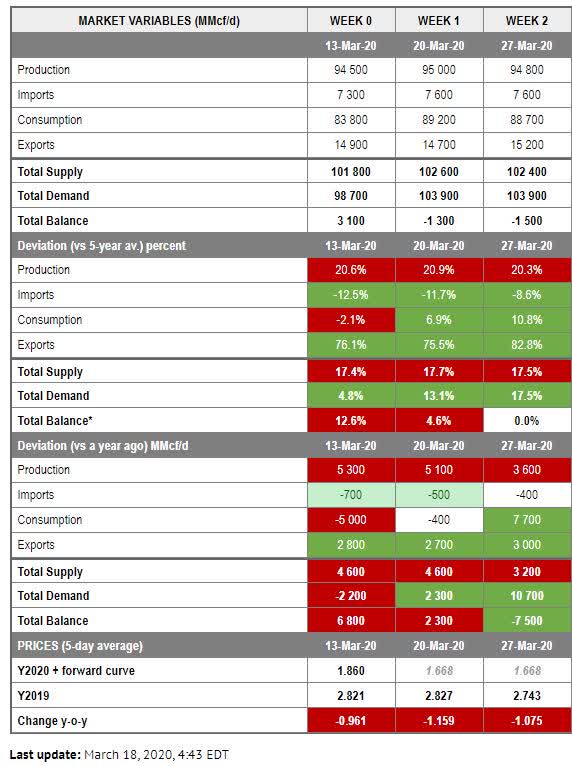 Source: Bluegold Research estimates and calculations based on EIA methodology (Lower-48 states + Alaska). The figures in the table above are weekly averages measured in million cubic feet per day (MMcf/d). Deviations from the 5-year norm are measured in percentages. Deviations from the previous year are measured in MMcf/d. Deviations are colored in accordance with their notional effect on the price. For example, higher consumption should have a positive effect (green color), whereas higher production has a negative effect (red color). Total Balance represents the net result of the interaction between total supply and total demand. Total Balance = total supply minus total demand. Total Balance does not equal storage flows. *Total Balance deviation vs. 5-year average = total supply deviation minus total demand deviation.
The collapse in oil prices is a disaster for shale producers. Production will be reduced. North American oil and gas producers have already slashed their capital spending by about 30% on average after crude prices crashed last week (see the table below).
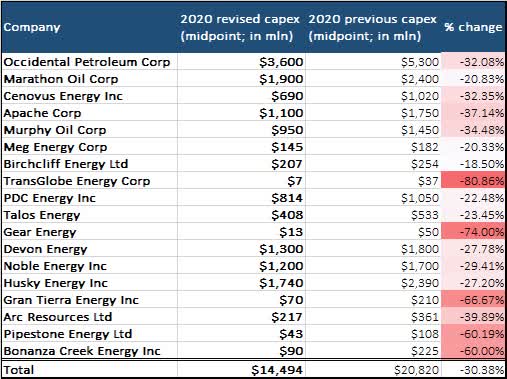 Source: companies’ reports
We believe that dry gas production in the U.S. should fall and will fall, but probably only gradually. We currently expect U.S. dry gas production to average 93.94 bcf/d over the next three months (March-April-May), 2.32 bcf/d lower than the latest EIA estimate of 96.26 bcf/d over the same period.
Storage Report
This week, the U.S. Energy Information Administration should report a smaller change in natural gas storage compared to the previous week. We anticipate to see a draw of 5 bcf (1 bcf larger than the comparable figure in the ICE’s latest report for the EIW-US EIA Financial Weekly Index, 86 bcf smaller than a year ago and 58 bcf smaller vs. the 5-year average for this time of the year). Annual storage “surplus” is projected to expand by 77 bcf (in total) over the next 3 weeks (4 EIA reports): from +796 bcf today to +873 bcf in the week ending April 3.
Thank you for reading this article. We also write daily and weekly reports, covering key variables in U.S. natural gas market (supply, demand, storage, prices and more). We provide the following to subscribers:
We are offering a two-week free trial, and we will soon begin to cover global LNG market. Come and join us.
Disclosure: I/we have no positions in any stocks mentioned, and no plans to initiate any positions within the next 72 hours. I wrote this article myself, and it expresses my own opinions. I am not receiving compensation for it (other than from Seeking Alpha). I have no business relationship with any company whose stock is mentioned in this article.


Be the first to comment