

Thank you for your assistant/iStock via Getty Images
Introduction
Nabors Industries (NYSE:NBR) released its second quarter of 2022 results on August 3, 2022.
Note: This is a quarterly update from my preceding article published on June 6, 2022. I have covered Nabors Industries in Seeking Alpha since Sept. 2014.
1 – 1Q22 Results Snapshot
Revenues were $630.943 million in the second quarter of 2022, up from $489.33 million a year ago. Nabors’ total costs and expenses increased to $692.3 million from $654.9 million in 2Q21 due to much higher direct expenses, general and administrative costs, and research and engineering expenses.
NBR reported a second-quarter 2022 loss of $82.92 million or $9.41 per share. The figures beat analysts’ expectations.
NBR 2Q22 highlights (NBR Presentation)
The second-quarter adjusted EBITDA was $158.04 million compared to $117.32 million in the second quarter of 2021.
Nabors Industries exited 2Q22 with 96.4 rigs running in the US. The daily margin increased to $10,738 per day, up slightly year over year in the second quarter. For the International segment, NBR exited 2Q22 with 74.3 rigs with a daily margin stable at $14,331 per day.
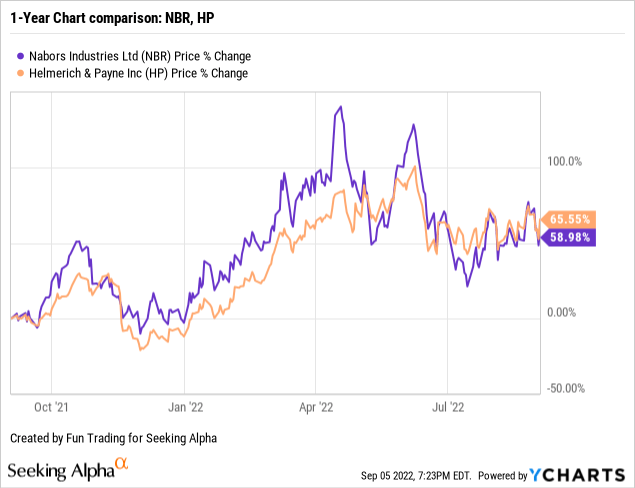
2 – Stock performance
Nabors Industries has done very well on a one-year basis and is up 59%. However, NBR and HP have dropped significantly since May.
3 – Investment Thesis
The investment thesis is a challenging exercise for this onshore drilling company. The situation has improved significantly in the past two quarters. The company is generating free cash flow due to a surge in drilling demand and higher commodity pricing, which boosted land drilling rig day rates to a level not seen for a long time.
Westwood Global Energy Group is turning optimistic for onshore drilling but is still cautious due to a rig oversupply. It wrote on August 25, 2022:
Despite a positive outlook for demand, the oversupply of rigs will remain a key factor in the sector, with demand unlikely to return to the pre 2014 downturn levels that led to a surge in newbuild rig construction. While utilisation in 2022 has increased to 45%, from 43% in 2021, and is forecast to grow to 53% by 2026, numbers will remain well below maximum capacity.
At the same time, the increased focus on automated rigs, which currently account for just 16% of the overall rig fleet, could also lead to demand outweighing supply of these rigs, a trend that is already being noted in the U.S. specifically, where some drilling contractors are expecting to exhaust their available supplies of super-spec rigs by mid-2023.
As I said in my preceding article, because the company is highly associated with oil prices, I suggest trading LIFO in your long-term position to compensate for the adverse effects of any fluctuations and lessen the overall risk attached to this volatile sector.
This dual strategy is what I am recommending in my marketplace and forms the backbone of my Gold and Oil marketplace.
3.1 Nabors Fleet Status Snapshot 2Q22
The total working rigs increased to 173 rigs from 168 in 1Q22. Nabors’ average Lower 48 working rig count was 91 in 2Q22. For the international segment, it was 74. Utilization average 52%.
CFO William Restrepo said in the press release:
We expect similar improvement in the third quarter. Utilization for our high-spec Lower 48 rigs currently stands at 81%. With the current market tightness, pricing is rising rapidly. Margins are expanding, a trend we expect to continue in coming quarters. The accelerating market and our pricing momentum in the Lower 48, as well as stronger than expected fundamentals in the International segment, have significantly outpaced the estimates embedded in our previous EBITDA outlook for 2022 and 2023.
NBR Fleet status 2Q22 (NBR Presentation)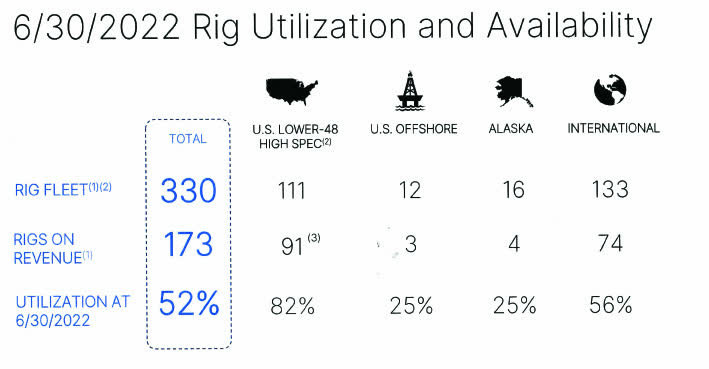
Nabors Industries – Balance Sheet In 2Q22: The Raw Numbers
| Nabors Industries | 2Q21 | 3Q21 | 4Q21 | 1Q22 | 2Q22 |
| Total Revenues and other income in $ Million | 489.33 | 524.17 | 543.54 | 568.64 | 630.94 |
| Net income in $ Million | -196.01 | -122.50 | -113.68 | -184.50 | -82.92 |
| EBITDA $ Million | 50.81 | 102.57 | 121.64 | 50.27 | 144.33 |
| EPS diluted in $/share | -26.59 | -15.79 | -14.60 | -22.51 | -9.41 |
| Operating cash flow in $ Million | 133.71 | 113.28 | 102.29 | 41.35 | 120.80 |
| CapEx in $ Million | 77.00 | 65.72 | 54.14 | 84.26 | 76.63 |
| Free Cash Flow in $ Million | 56.71 | 47.56 | 48.16 | -42.90 | 44.16 |
| Total cash $ Million | 399.90 | 771.88 | 991.49 | 394.04 | 417.98 |
| Long-term debt in $ Million | 2,823.1 | 3,075.5 | 3,262.8 | 2,610.1 | 2601.5 |
| Shares outstanding (Basic) in Million | 7.46 | 7.91 | 7.95 | 8.31 | 9.08 |
Courtesy: NBR PR
* Estimated by Fun Trading.
Balance Sheet Snapshot
1 – Revenues and other income were $630.94 million in 2Q22
NBR Quarterly Revenues history (Fun Trading)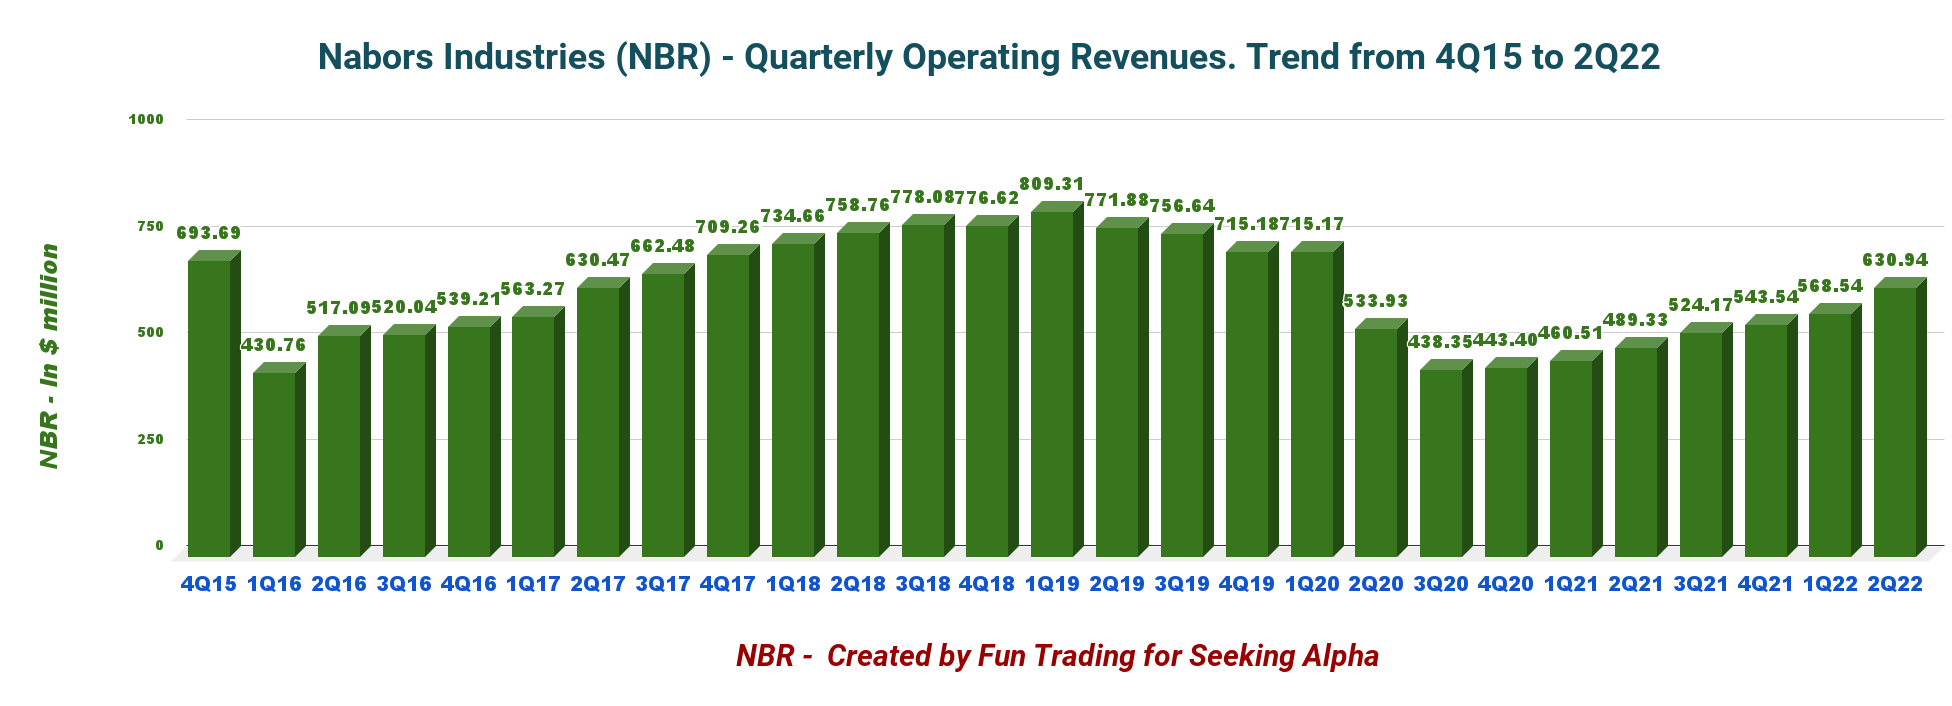
The quarter’s net loss was $82.92 million, or $9.41 per diluted share, compared to a loss of $196.01 million, or $26.59 per share, during the second quarter of 2022.
CEO Anthony Petrello said in the conference call:
In the second quarter all operating segments performed well, exceeding the expectations we laid out on last quarter. This performance reinforces our strategy.
The second-quarter adjusted EBITDA was $158.04 million compared to $117.32 million in the second quarter of 2021.
1.1 – Revenues per segment:
NBR Quarterly revenues detail in 2Q22 (Fun Trading)
1.1.1 – U.S. Drilling:
The quarterly operating revenues were $253.008 million, up 16.3% from $217.58 million in 1Q22. Nabors’ average Lower 48 rig count is 89.3, increased by nearly six rigs. Daily adjusted gross margin in the Lower 48 market averaged $8,706, more than 13% higher than the prior quarter.
1.1.2 – International Drilling:
The quarterly operating revenues were up 8.7% to $296.32 million ($279.03 million in 1Q22). It is the primary segment for Nabors and represents 47% of the revenues. The International rig count averaged 74.3 rigs, up more than two rigs from the prior quarter. Daily adjusted gross margin for the second quarter averaged $14,331, up $1,197 from the preceding quarter.
1.1.3 – Drilling Solutions:
Revenues were $55.88 million in the second quarter of 2022, up from $36.74 million in 1Q22. It mainly reflects increasing activity in the US with higher volumes in performance drilling software and managed pressure drilling.
1.1.4 – The Rig Technologies/Others:
Revenues increased to $45.094 million from $36.84 million in 1Q22 due to higher aftermarket sales and equipment rentals.
2 – Free cash flow was $44.16 million in 2Q22
NBR Quarterly Free cash flow history (Fun Trading) Note: The Generic free cash flow is cash from operations minus CapEx. The company uses a different calculation and indicates a free cash flow of $56.924 million. The issue is that NBR utilizes “net cash provided by investing activities” instead of actual CapEx.
Trailing 12-month free cash flow was $96.98 million, with $44.16 million in 2Q22.
3 – Net debt is now down to $2.18 billion at the end of 2Q22
NBR Cash versus Debt history (Fun Trading) NBR Net debt (NBR Presentation)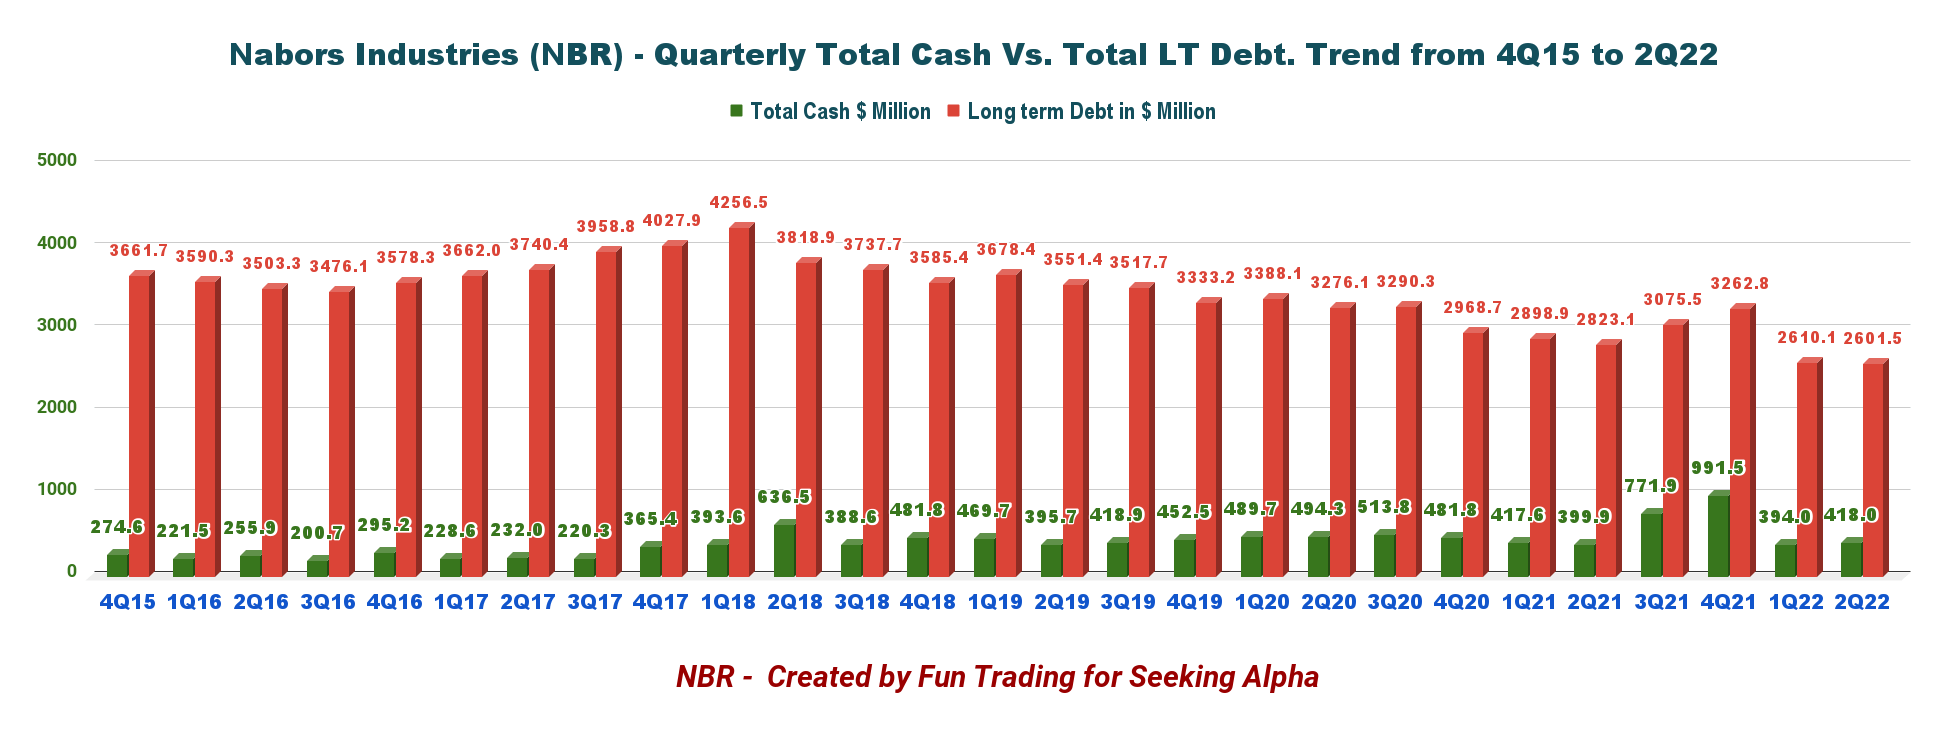
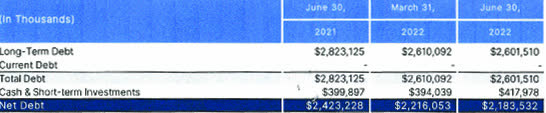
CEO Anthony Petrello said in the conference call:
In the second quarter, we again reduced net debt, driven primarily by excellent free cash flow we drove net debt below the $2.2 billion mark. We remain focused on generating free cash flow as we continue to delever the capital structure and improve the balance sheet.
NBR Debt maturities profile (NBR Presentation)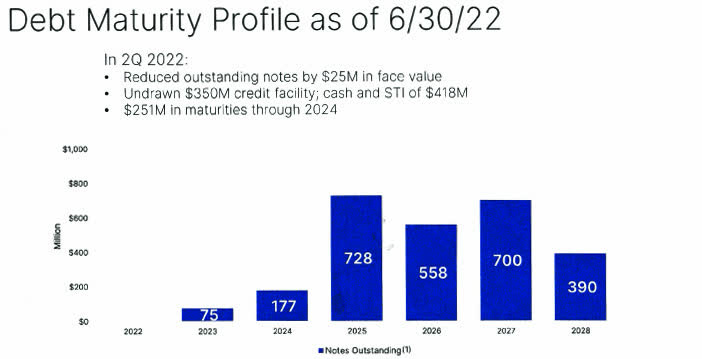
4 – 3Q22 and full-year Guidance
4.1 – International
- The rig count is approximately in line with the second-quarter average
- Adjusted gross margin per day of around $14,400.
4.2 – U.S. Drilling
- An increase in average Lower 48 rig count of 3 to 4 rigs over the second quarter average.
- Lower 48 adjusted gross margin per day of approximately $10,400 – $10,600.
- An additional rig and higher average day rates in Alaska; Offshore in-line with second quarter levels.
4.3 – Drilling Solutions
Adjusted EBITDA up by approximately 12% over the second quarter level.
4.4 – Rig Technologies
Adjusted EBITDA up by roughly $2 million over the second quarter level
4.5 – Capital Expenditures
CapEx for 3Q22 is set between $110 million and $120 million. CapEx for the full year 2022 is forecasted at $380 million.
Technical Analysis (Short Term) and commentary
NBR TA Chart short-term (Fun Trading StockCharts)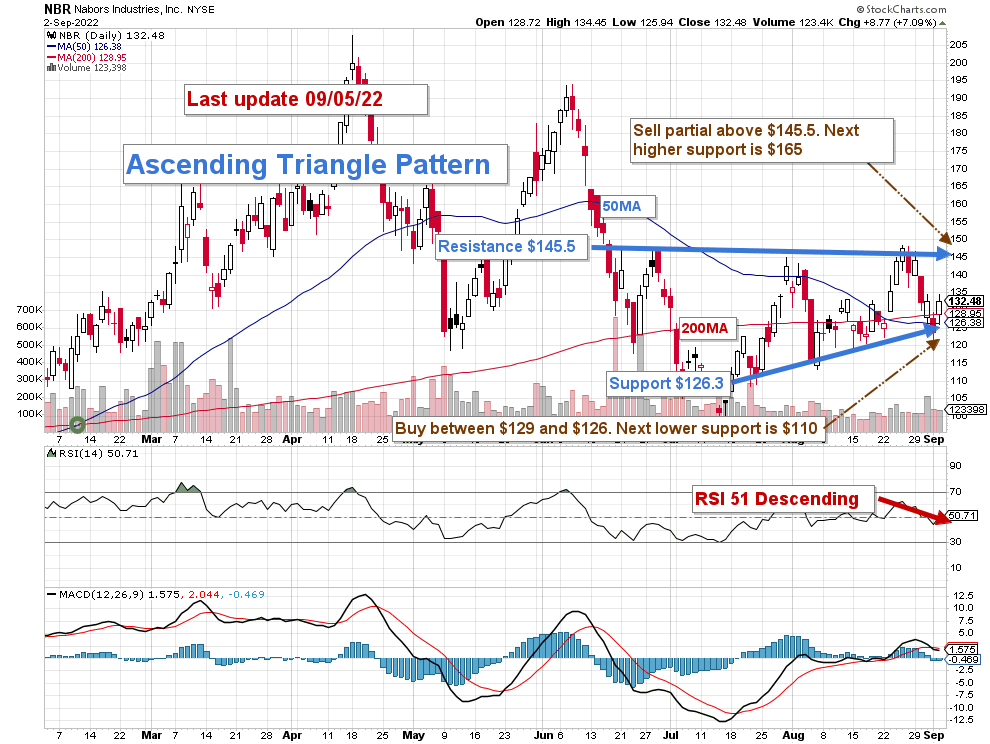
NBR forms an ascending triangle pattern with resistance at $145.5 and support at $126.3.
The trading strategy I suggest is to sell over 50% of your position above $145.5 and wait for a retracement between $129 and $126 to accumulate again, with potential lower support at $110.
Oil momentum has slowed down recently, and NBR has significantly retraced from its highs. If oil prices cannot hold above $85, I believe NBR could drop as low as $110, where I see lower support.
Watch oil prices like a hawk.
Warning: The TA chart must be updated frequently to be relevant. It is what I am doing in my stock tracker. The chart above has a possible validity of about a week. Remember, the TA chart is a tool only to help you adopt the right strategy. It is not a way to foresee the future. No one and nothing can.
Author’s note: If you find value in this article and would like to encourage such continued efforts, please click the “Like” button below as a vote of support. Thanks!
Be the first to comment