

lyash01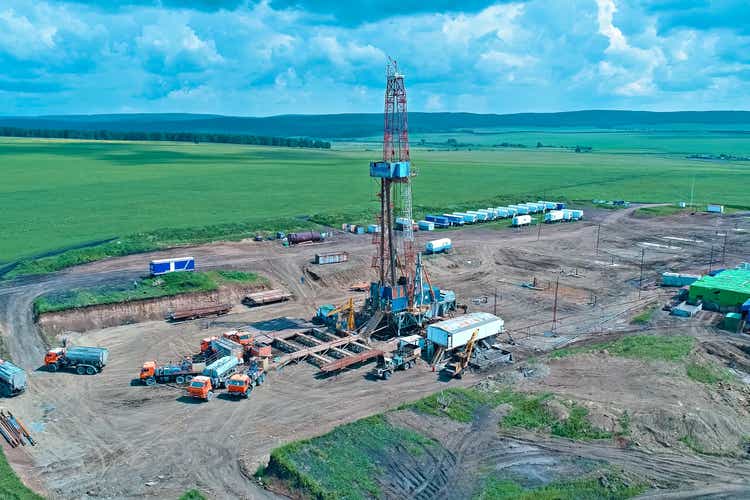
Introduction
Nabors Industries Ltd. (NYSE:NBR) released its fourth quarter and full-year 2022 results on February 8, 2023, and Helmerich & Payne, Inc. (HP) released its fiscal first quarter 2023 results on January 30, 2023.
This article looks at Nabors Industries’ recent fundamental history, including the fourth quarter earnings. I will also compare NBR with HP earnings from time to time, as HP is a direct competitor that recently delivered a solid quarter.
I recommend reading my article on HP, published on January 31, 2023, by clicking here.
Nabors Industries CEO Thomas Petrello said in the Q4 conference call:
Adjusted EBITDA in the fourth quarter totaled $230 million. This marks the third consecutive quarter of sequential EBITDA growth above 20%. Consolidated revenue increased 10% sequentially. Our global average rig count for the fourth quarter increased by 3.4 rigs. This growth was driven by increases in both US and International markets.
1 – NBR’s 4Q22 and full-year 2022 results snapshot
Revenues were $760.15 million in the fourth quarter of 2022, up from $543.54 million a year ago.
NBR reported a fourth-quarter 2022 loss of $69.07 million, or $7.87 per share, compared with a loss of $14.60 last year. The figures missed analysts’ expectations. Nabors’ adjusted EBITDA was $230.022 million.
Nabors Industries exited 4Q22 with 96 rigs running in the U.S. The daily margin increased to $16,107 per day, up year-over-year in the fourth quarter. For the International segment, NBR exited 4Q22 with 77 rigs with a daily margin stable at $14,902 per day. The margin is improving, which is a positive.
NBR Rig margin Presentation (NBR Presentation)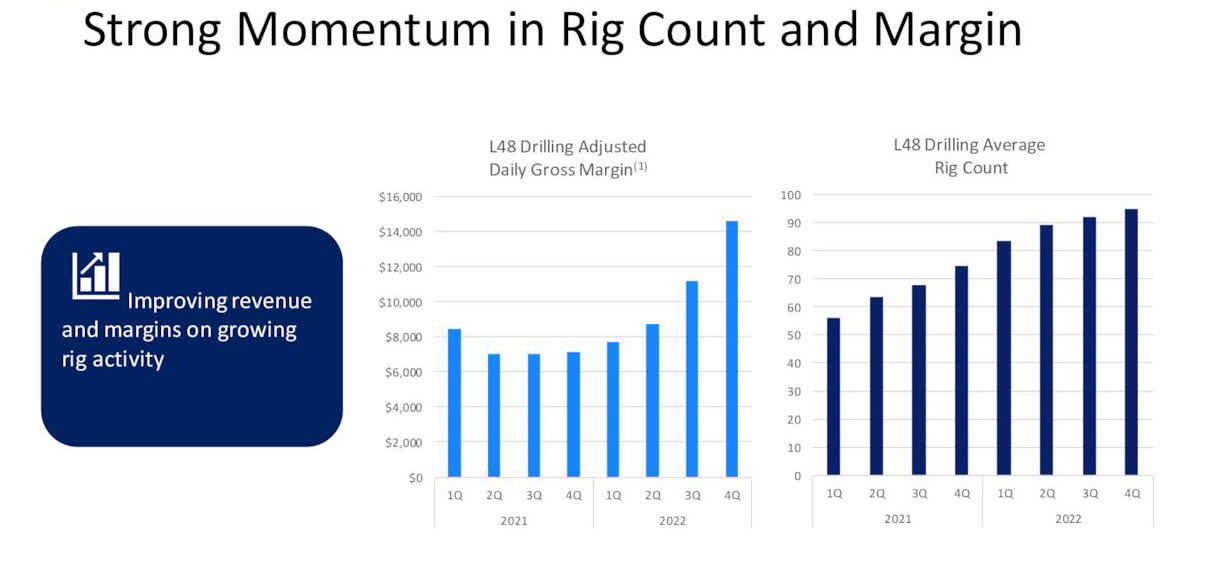
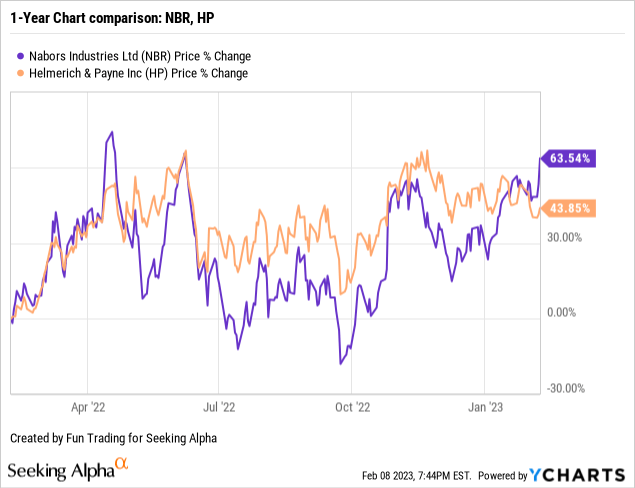
2 – Stock performance
Nabors Industries has done very well on a one-year basis and is up 64%. However, HP is outperforming NBR and is up 44%. Both companies did very well in 2022, despite some steep retracement in July and October. I am expecting more volatility in 2023.
3 – Investment thesis
The investment thesis for Nabors Industries is always challenging, especially if we compare the company with its direct competitor, Helmerich & Payne.
The onshore drilling business is not in an industry where money can be made quickly, and any progress is usually minor and far apart. Also, NBR is not what we call “shareholders’ friendly” and is not paying dividends. On the other hand, Helmerich & Payne have been paying a dividend for many years.
However, the situation has improved significantly with higher margins and better utilization, but it is a laborious process that translates to boring results.
The issue is that 2023 may turn bearish if the global economy enters a painful recession. In this case, NBR will see its profit margins disappear quickly, and shareholders will start to worry about the debt level.
Thus, as I said in my preceding article, because those companies are highly associated with oil and gas prices, I suggest trading LIFO about 50%-60% (even more for NBR) of your long-term position to compensate for the adverse effects of any fluctuations and reduce the overall risk attached to this volatile sector. A simple look at the company’s history explains why you must be careful.
This dual strategy is what I am suggesting in my marketplace and forms the backbone of my Gold and Oil marketplace.
I believe NBR is less attractive than HP because of its more robust U.S. revenue segment and dividend policy. However, due to higher stock volatility, NBR looks more attractive for full-time traders.
3.1 Nabors and H&P Fleet Status Snapshot 4Q22
3.1.1 – Nabors Industries
The total working rigs increased to 180 rigs from 177 in 3Q22. Nabors’ average Lower 48 working rig count was 96 in 4Q22. For the International segment, it was 77. The utilization average is 55%, up from 54% the preceding quarter.
NBR Rig counts (NBR Presentation)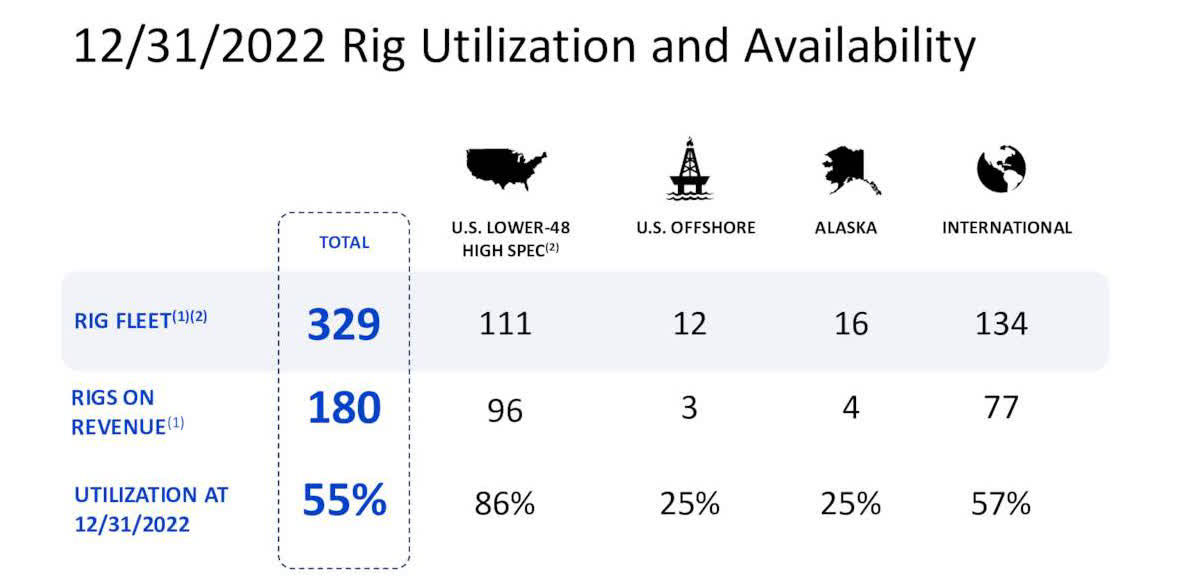
3.1.2 – Helmerich & Payne
HP Rig count (HP Presentation)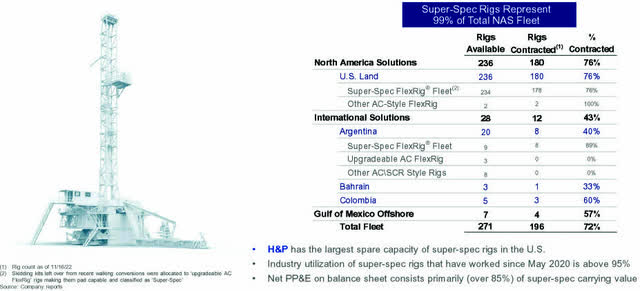
H&P had 196 rigs contracted in the U.S. (including 4 offshore rigs in the Gulf of Mexico) but had much fewer rigs contracted in its International segment (12), making H&P more oriented and sensitive to the U.S. market.
Nabors Industries – Balance Sheet History ending 4Q22: The Raw Numbers
| Nabors Industries | 4Q21 | 1Q22 | 2Q22 | 3Q22 | 4Q22 |
| Total Revenues and other income in $ Million | 543.54 | 568.64 | 630.94 | 694.14 | 760.15 |
| Net income in $ Million | -113.68 | -184.50 | -82.92 | -13.78 | -69.07 |
| EBITDA $ Million | 121.64 | 50.27 | 144.33 | 221.59 | 12.25 |
| EPS diluted in $/share | -14.60 | -22.51 | -9.41 | -1.80 | -7.87 |
| Operating cash flow in $ Million | 102.29 | 41.35 | 120.80 | 138.95 | 199.99 |
| CapEx in $ Million | 54.14 | 84.26 | 76.63 | 111.19 | 98.68* |
| Free Cash Flow in $ Million | 48.16 | -42.90 | 44.16 | 27.76 | 101.31* |
| Total cash $ Million | 991.49 | 394.04 | 417.98 | 425.07 | 452.32 |
| Long-term debt in $ Million | 3,262.8 | 2,610.1 | 2601.5 | 2,585.5 | 2,537.5 |
| Shares outstanding (Basic) in Million | 7.95 | 8.31 | 9.08 | 9.10 | 9.10 |
Courtesy: NBR PR.
*Estimated by Fun Trading for the release, which has indicated CFO and CapEx before the 10Q release. It could change a little after the 10Q release.
Balance Sheet Snapshot
1 – Revenues and other income were $760.15 million in 4Q22
NBR Quarterly Revenues history (Fun Trading)
Note: Operating income plus investment income was $760.34 million.
Nabors Industries reported fourth quarter 2022 operating revenues totaling $760.15 million, up from $543.54 million in the same quarter last year (please look at the chart above).
Adjusted free cash flow totaled $101 million in the fourth quarter, primarily driven by higher financial results across all segments, strong collections, and disciplined capital spending.
The fourth quarter adjusted EBITDA was $230.02 million compared to $131.656 million in the fourth quarter of 2021.
Conversely, Helmerich & Payne’s revenues were $719.64 million, with a quarter’s net income of $97.15 million or $0.91 per share.
HP Revenue history (Fun Trading)
We can see that the revenues increased faster for HP compared with NBR.
1.1 – NBR and H&P revenues per segment
1.1.1 – NBR revenues per segment
NBR 4Q22 revenues per segment (Fun Trading)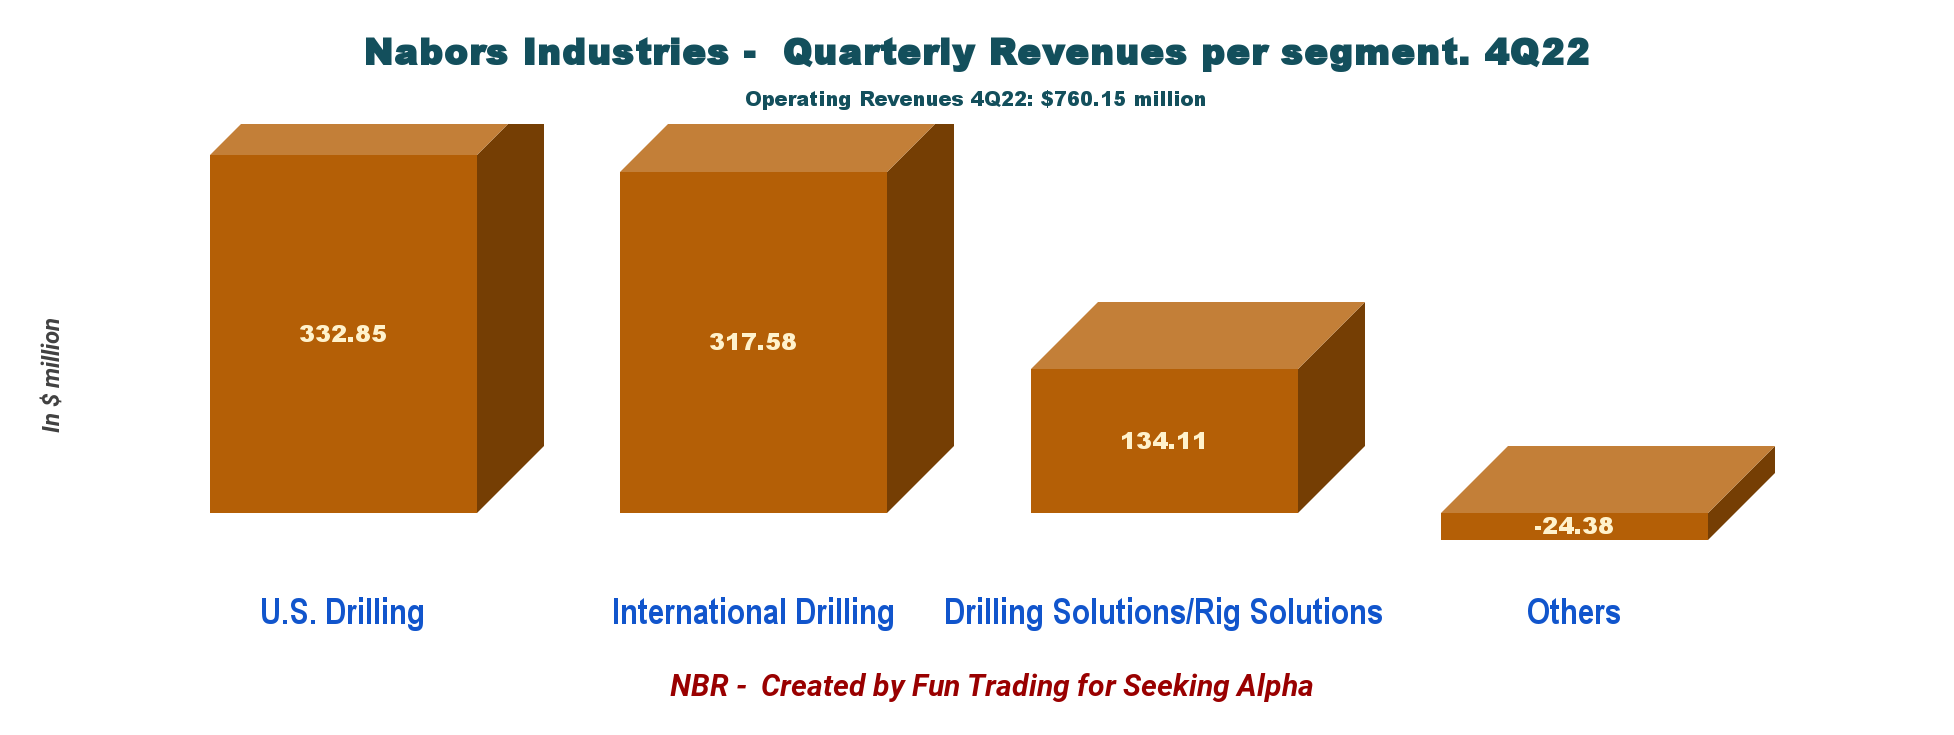
As we can see, U.S. drilling and International Drilling represent the same percentage of the total output.
1.1.2 – Helmerich & Payne revenues per segment
HP Revenues per segment (Fun Trading)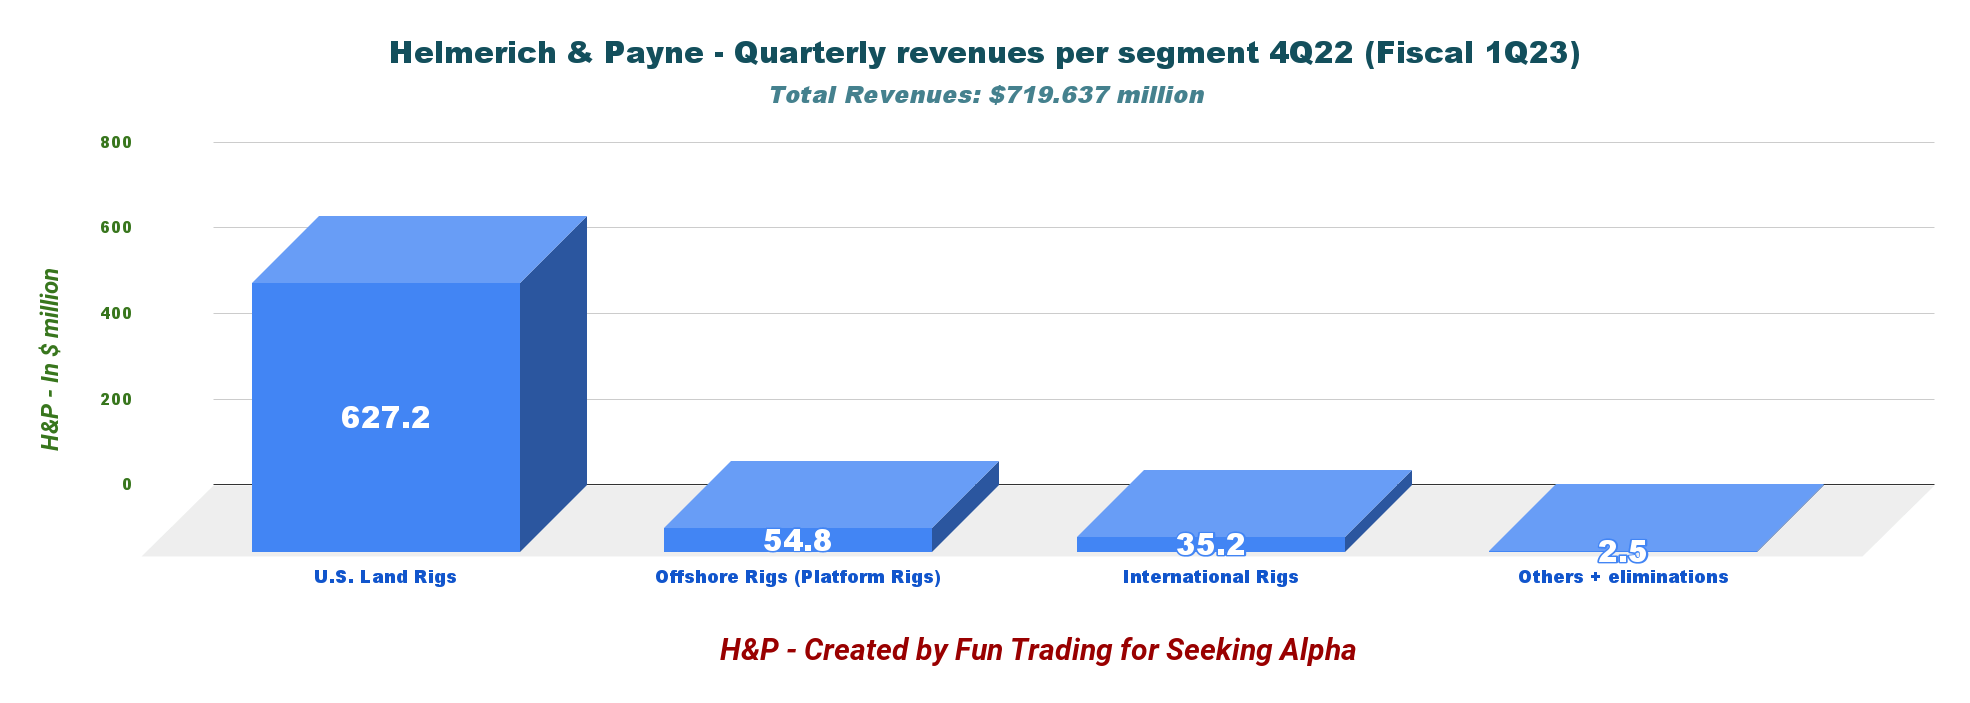
As we can see above, Helmerich & Payne’s U.S. revenues are more significant and generate a regular net income.
2 – Free cash flow was estimated at $101.3 million in 4Q22
NBR Quarterly Free cash flow history (Fun Trading)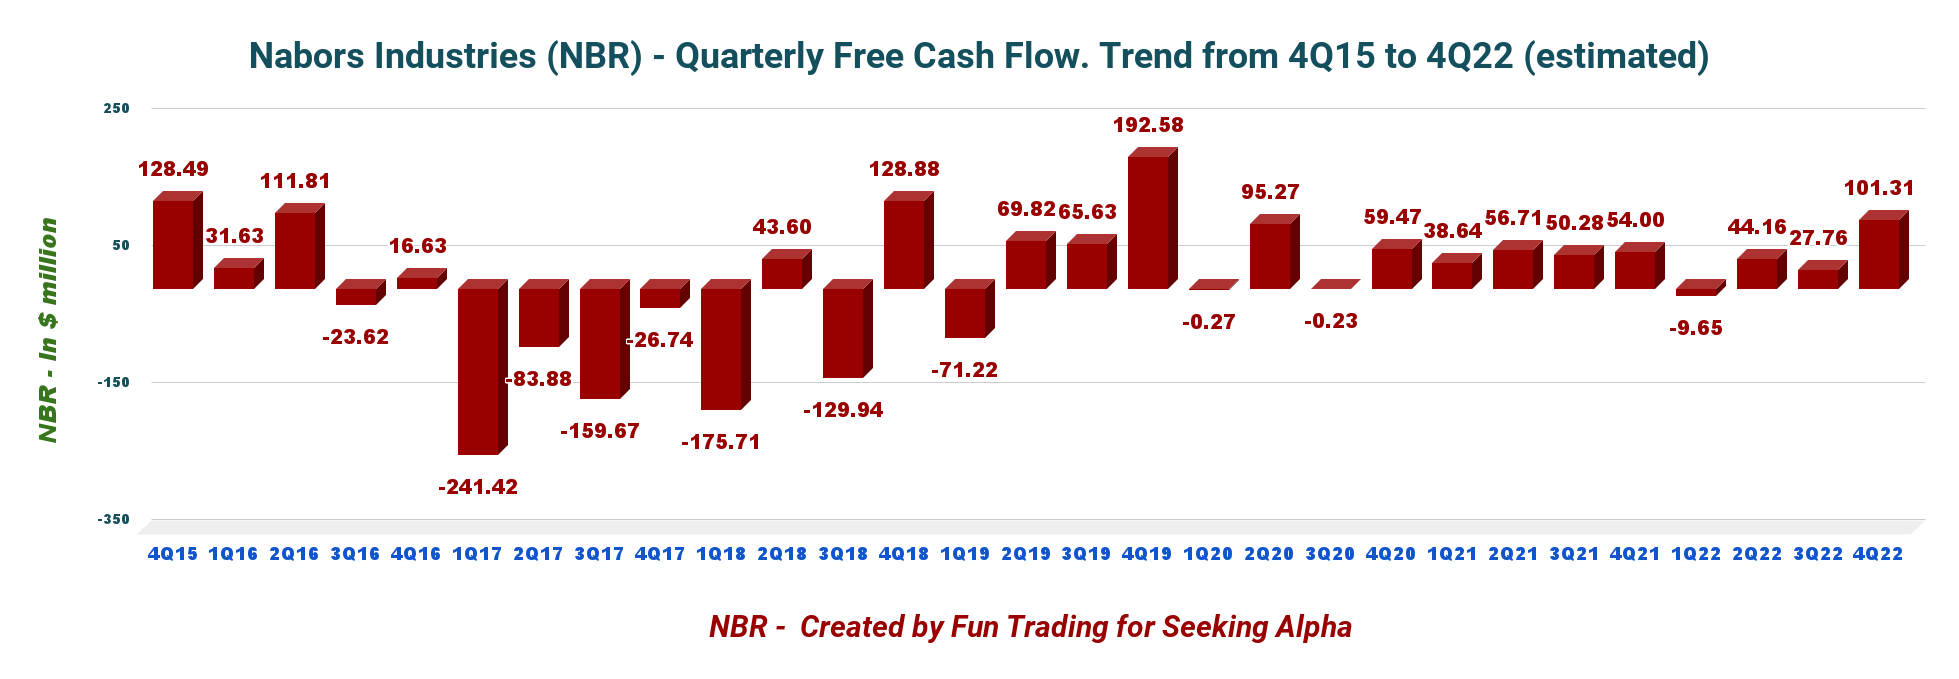
Note: The Generic free cash flow is cash from operations minus CapEx.
NBR’s trailing 12-month free cash flow was $130.33 million, with $101.31 million in 4Q22. The company is not paying a dividend.
Conversely, Helmerich & Payne recorded a trailing 12-month FCF of $102.33 million. The free cash flow for the fiscal first quarter was estimated at $89.35 million.
HP Quarterly Free cash flow history (Fun Trading)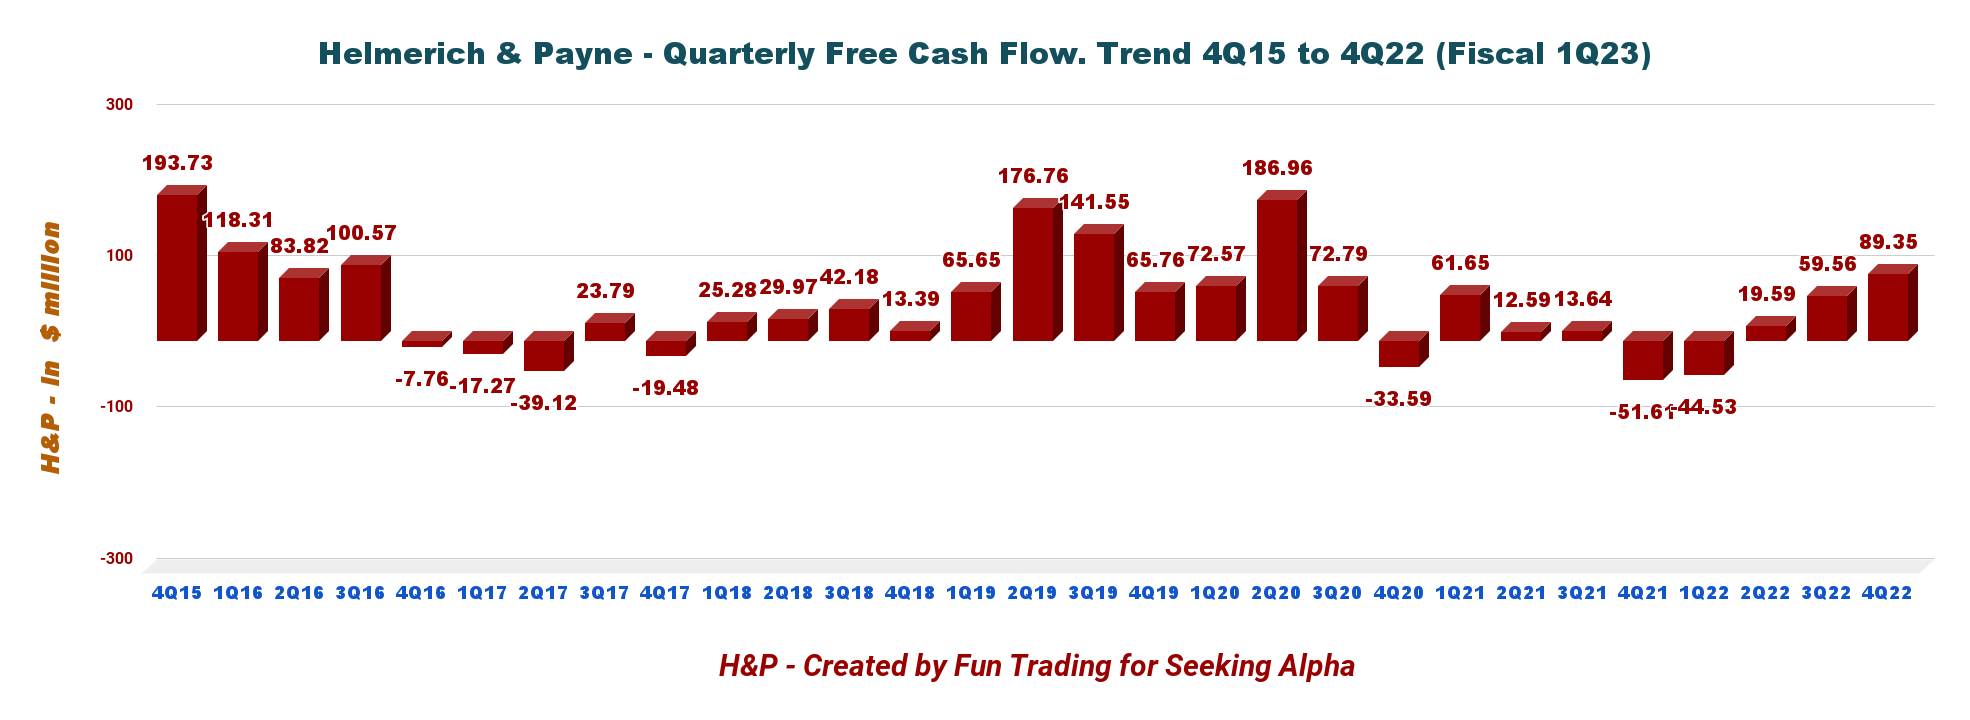
The crucial difference between Nabors Industries Ltd. and H&P from an investor’s point of view is that H&P pays a dividend with a yield of 2.15%, while NBR does not currently pay any dividend. I said in my recent H&P article:
On December 9, 2022, the Board of Directors of the Company declared a quarterly base cash dividend of $0.25 per share and a supplemental cash dividend of $0.235 per share; both dividends are payable on February 28, 2023, to stockholders of record at the close of business on February 14, 2023.
3 – Net debt is now down to $2.09 billion at the end of 4Q22
NBR Quarterly Cash versus Debt history (Fun Trading)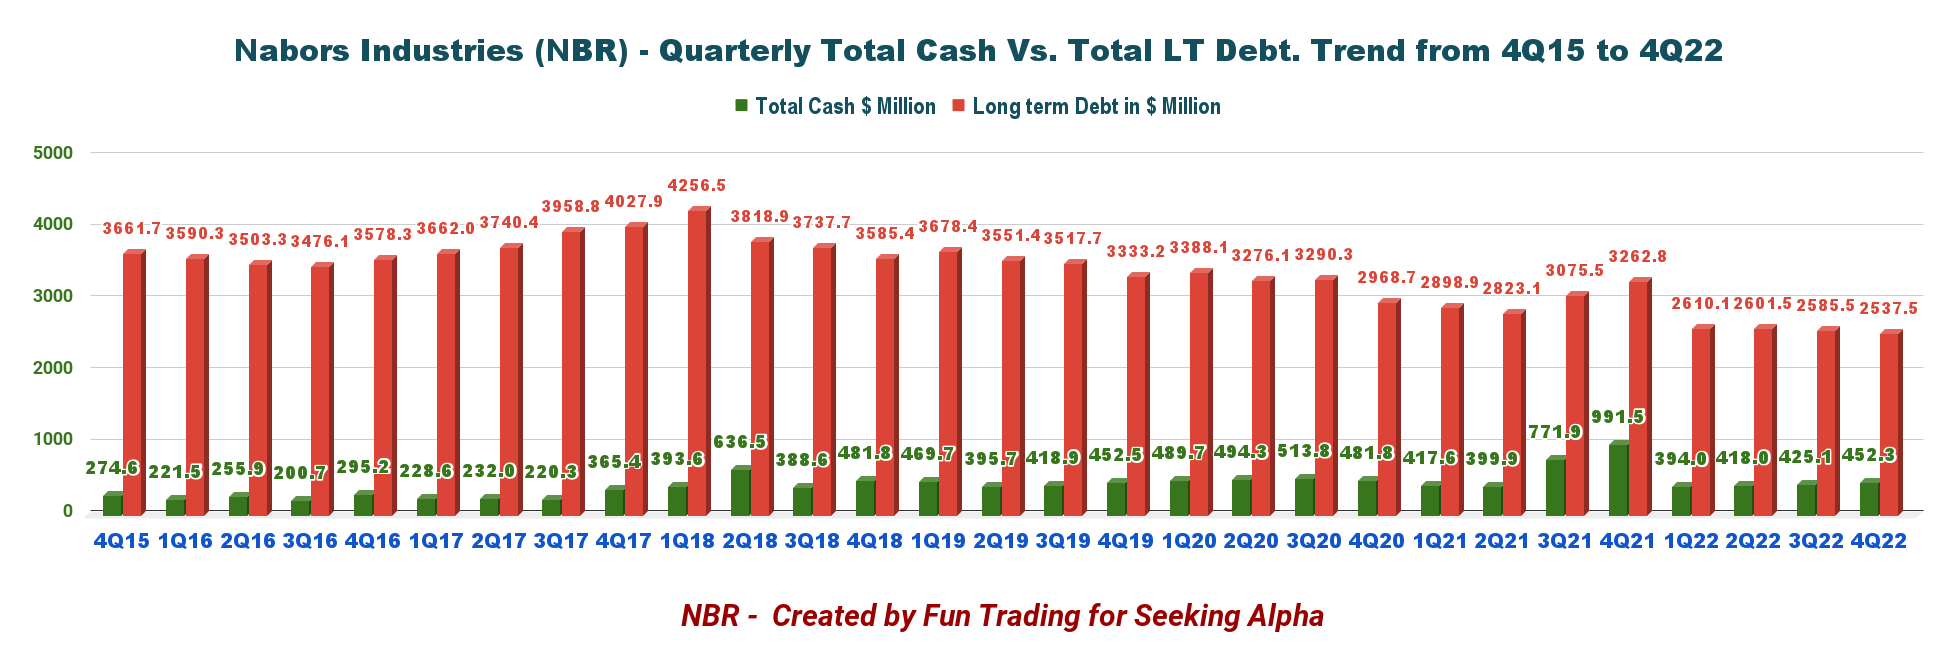
As we can see in the chart above, money has been used to reduce debt. Total debt in the fourth quarter was $2,537.5 million. The total cash was $452.32 million.
In the fourth quarter, we again reduced net debt. Our net debt stands below $2.1 billion. I am pleased to report we again made progress on our five keys to excellence…
In 2022, we reduced net debt by $186 million. This improvement was driven primarily by excellent free cashflow resulting from the strong profitability of our operations, excellent working capital performance, and disciplined capital spending. We expect even greater improvement in 2023.
However, H&P has a much better debt position. CEO Thomas Petrello said in the conference call:
H&P had $347.64 million in cash and short-term investments, plus $750 million of availability under its committed revolver. Debt was $542.93 million in fiscal 1Q23. The company shows a net debt of $195.29 million with a debt-to-capitalization of 16%. Total liquidity was roughly $1.1 billion on December 31, 2022.
Technical Analysis (Short Term) and Commentary
NBR TA Chart short-term (Fun Trading StockCharts)
NBR forms an ascending wedge pattern, with resistance at $180 and support at $175.
The ascending wedge pattern is a bearish chart pattern that signals an imminent breakout to the downside.
Thus, I suggest selling over 50% of your position between $180 and $183, with possible higher resistance at $185, and waiting for a retracement between $175 and $159.4 to accumulate again, with potential lower support at $143.7.
It is crucial to watch oil prices like a hawk.
Warning: The TA chart must be updated frequently to be relevant. It is what I am doing in my stock tracker. The chart above has a possible validity of about a week. Remember, the TA chart is a tool only to help you adopt the right strategy. It is not a way to foresee the future. No one and nothing can.
Author’s note: If you find value in this article and would like to encourage such continued efforts, please click the “Like” button below as a vote of support. Thanks!
Be the first to comment