studentofgann.com.au
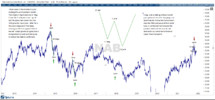
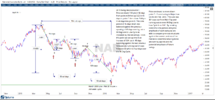
The 2017 Swing ran down 60 days into point B which is a very similar time period to the current projection . There are two different scenarios that could present as outlined earlier . We could continue to move higher making counter trend Top into the 7th June and if this occurs we could be down till the 16th June where Main Low is indicated which measures 55 days peak to trough which is fairly close to the 60 day time period in 2017 . The second scenario that could present is a Low into the 7th June then up till the 16th June so as we approach the first signal date 7th June we should be able to determine if we are setting up for Top into this date in which case I will look to buy a 3 month put option and hold it down till the 16th May and then reverse position if the 16th comes in as Low .


Be the first to comment