


Hispanolistic/E+ via Getty Images
We continue the “My Top 10 Dividend Payers” series with our September 2022 edition. This series is dedicated to exploring stocks that offer attractive dividends and are worth further examination. An attractive dividend does not guarantee that a company is poised to perform well, but as we will learn, companies that perform well often offer attractive dividends.
Today, I’m going to review my top 10 dividend payers for September and take a closer look at a new pick this month: Medical Properties Trust, Inc. (MPW).
Dividend Recap
There’s something rewarding about dividends. Receiving that dividend payment in the mail or in your brokerage account reinforces the intention behind investing by manifesting the outcome. It says, “Your capital has been hard at work, here’s your reward.”
Dividends offer investors several advantages. Dividends provide direct income without the need to liquidate positions. This income provides investors with return during draw downs in share price. Dividend stocks tend to perform better during bear markets. For these reasons they can reduce volatility of a portfolio.
The table from Dividend.com demonstrates annualized returns by dividend payer type over 41 years. Dividend growers performed the best with the lowest volatility at an average annualized return of 10.07%. Regular dividend payers were not far behind at 9.28%. Non-dividend paying stocks only averaged 2.34%.
This data from Al Frank Asset Management tracks the total returns of dividend payer types over 80 years. Over the long term the highest payers performed best averaging 11.3% annual returns and non-payers performed worst at an average of 8.6% annual returns.
Data from Nuveen supports the data from dividend.com that dividend growers perform better outright and adjusted for volatility with average annualized returns over 10% and annualized standard deviations under 20. Dividend cutters are by far the worst performers with average annualized returns less than 0% and annualized standard deviation over 25.
Data from Fidelity shows that the 70th thru 90th percentile of dividend yield payers have the optimum risk-adjusted returns over the last 50 years. Notably, the 50th percentile is also attractive. Further data from Nuveen demonstrates that the payout ratio correlates with overall performance. Dividend payers with medium and medium-high payout ratios perform the best. High payout ratios perform the worst followed by low and medium-low payout ratios.
Dividend Reinvesting
One reason that dividend investing is so powerful is the compounding effect of dividend reinvestment. By reinvesting dividends investors can achieve outsized returns for long term investments. Since 1980, 75% of the returns of the S&P 500 came from dividends when reinvested, demonstrating the importance of considering your dividend strategy.
There are major implications for retirees who cannot reinvest the dividends they need for income. For this example, we will model two identical companies with different payout ratios and dividend rates. In this case the retiree investor is not reinvesting dividends and will sell equity of the 3.3% dividend paying stock to produce the same amount of income as the 7.5% dividend paying stock. After 15 years the investment in the 3.3% dividend payer has returned a higher total return than the 7.5% dividend payer when Return on Assets is 10%. In this case the retiree is better to invest in the 3.3% dividend stock.
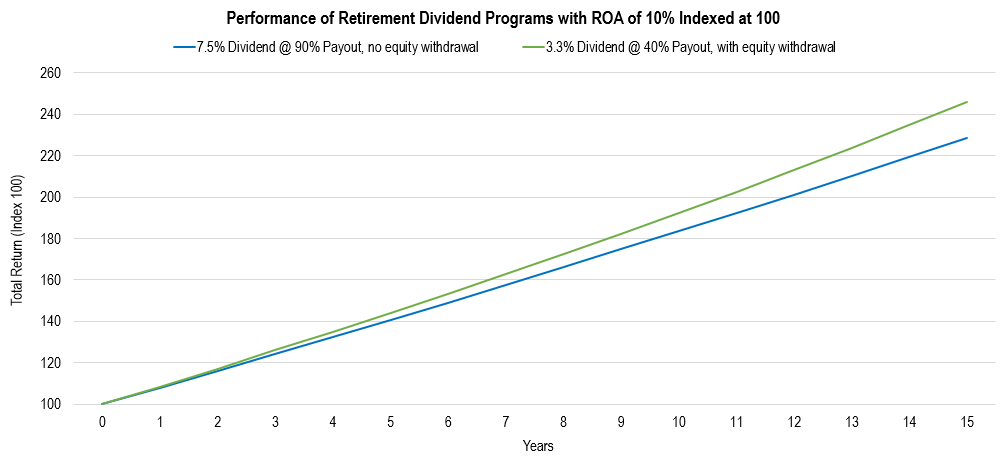
Chart by author
When we reduce the ROA from 10% to 7%, we can see that the 3.3% paying stock no longer produces a higher total return. The selling of equity for income cannot be overcome with growth. The return from the 3.3% payer is decelerating and approaching a limit. This is because if the retiree lives long enough, they will one day sell their last share of stock for income. In this case the retiree is better off investing in the 7.5% payer stock.
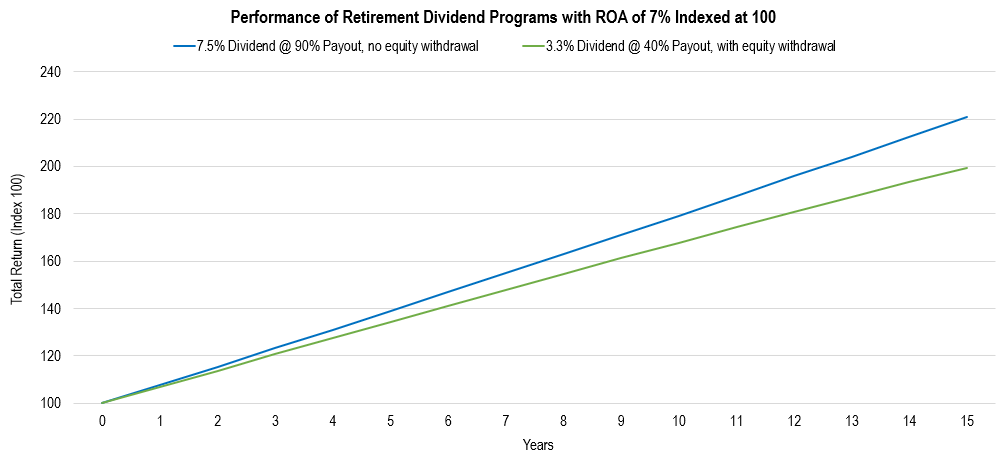
Chart by author
Dividend Payer Evaluation
Dividend attractiveness is not simply a function of yield. High dividend yields often serve as a warning that the market expects a company to struggle which may lead to future dividend cuts. This evaluation aims to assess dividend strength and does not analyze overall investment suitability and is not an assessment of risk.
Based on this information, I have formulated four dividend payer goals to drive my dividend evaluation:
- Maximize total return
- Deliver a meaningful yield
- Experience strong dividend growth
- Provide a margin of safety against dividend cuts
Screening
The evaluation begins with a stock screening which eliminates attributes which compromise my goals. I use the Seeking Alpha Stock Screener to sort equities based on the following metrics. I implement substitutions to the data for REITs and MLPs.
| Metric | Screen |
| Dividend Yield FWD | >2% |
| Payout Ratio | <150% |
| 5Y Dividend Growth | >2% |
| Years of Dividend Growth | >5 |
| EPS FWD | >-3.0% |
| Cash From Operations | >-200M |
| Return on Assets | >3% |
| Debt to Equity | <500% |
| Debt to FCF | >-10% |
Ranking
The contenders are then ranked using a formula that assigns priority to each of the following metrics:
| Metric | Reinvestment Strategy Priority | Retirement Strategy Priority |
| Dividend Yield FWD | Medium | High |
| Payout Ratio | High | Low |
| 5Y Dividend Growth | Low | Medium |
| Years of Growth | Medium | Medium |
| Revenue Growth FWD | Medium | Medium |
| EPS Growth FWD | High | Medium |
| Return on Assets | Medium |
Medium |
Below are my top ten lists of dividend payers for dividend reinvestment and retirement.
Top 10 Dividend Payers for Dividend Reinvestment
| Ticker | Name | Dividend Yield FWD | Score |
| CTRA | Coterra Energy Inc. | 2.02% | 6.0 |
| MED | Medifast, Inc. | 5.21% | 4.9 |
| VFC | V.F. Corporation | 4.61% | 4.8 |
| MMM | 3M Company | 4.84% | 4.7 |
| PG | The Procter & Gamble Company | 2.61% | 4.3 |
| WSO | Watsco, Inc. | 3.08% | 4.0 |
| TXN | Texas Instruments Incorporated | 2.69% | 4.0 |
| ITW | Illinois Tool Works Inc. | 2.54% | 4.0 |
| EPD | Enterprise Products Partners L.P. | 7.12% | 4.0 |
| CNS | Cohen & Steers, Inc. | 2.95% | 3.9 |
Top 10 Dividend Payers for Retirement
| Ticker | Name | Dividend Yield FWD | Score |
| MED | Medifast, Inc. | 5.21% | 5.5 |
| CTRA | Coterra Energy Inc. | 2.02% | 5.4 |
| VFC | V.F. Corporation | 4.61% | 4.2 |
| MMM | 3M Company | 4.84% | 4.1 |
| EPD | Enterprise Products Partners L.P. | 7.12% | 4.1 |
| MMP | Magellan Midstream Partners, L.P. | 8.19% | 4.1 |
| MPW | Medical Properties Trust, Inc. | 7.81% | 3.9 |
| AVGO | Broadcom Inc. | 3.14% | 3.9 |
| LYB | LyondellBasell Industries N.V. | 5.66% | 3.8 |
| SIMO | Silicon Motion Technology Corporation | 2.70% | 3.7 |
Taking a Closer Look at Medical Properties Trust
Our lists this month includes the addition of Medical Properties Trust. The hospital REIT boasts an eye popping 8.4% forward dividend yield at a conservative forward FFO payout ratio of 63.61%. Okay, you have my attention.
It’s not surprising that SA awards MPW an A+ for dividend yield in its dividend grades. With a yield this high I’m predisposed to dismiss the average dividend growth metrics. The company earns an A grade for consistency by paying a dividend for 16 consecutive years including 9 consecutive years of dividend growth.
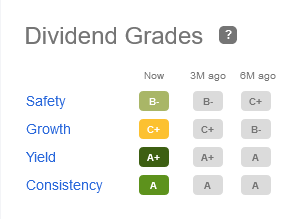
Seeking Alpha
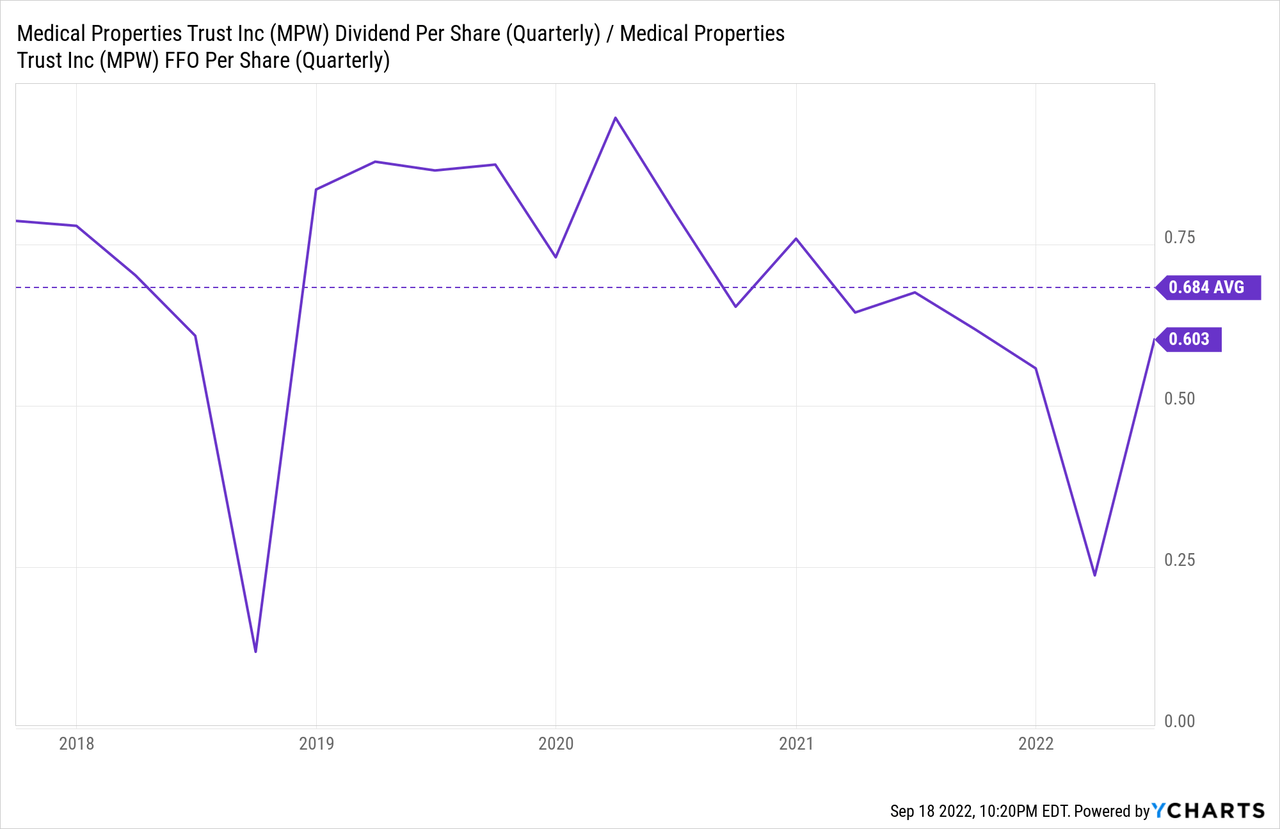
The question is, how safe is that yield? The FFO payout ratio for last quarter was 60.3% which is below the 5-year average of 68.4%. FFO is expected to grow by 1-5.6% next year according to analyst estimates.
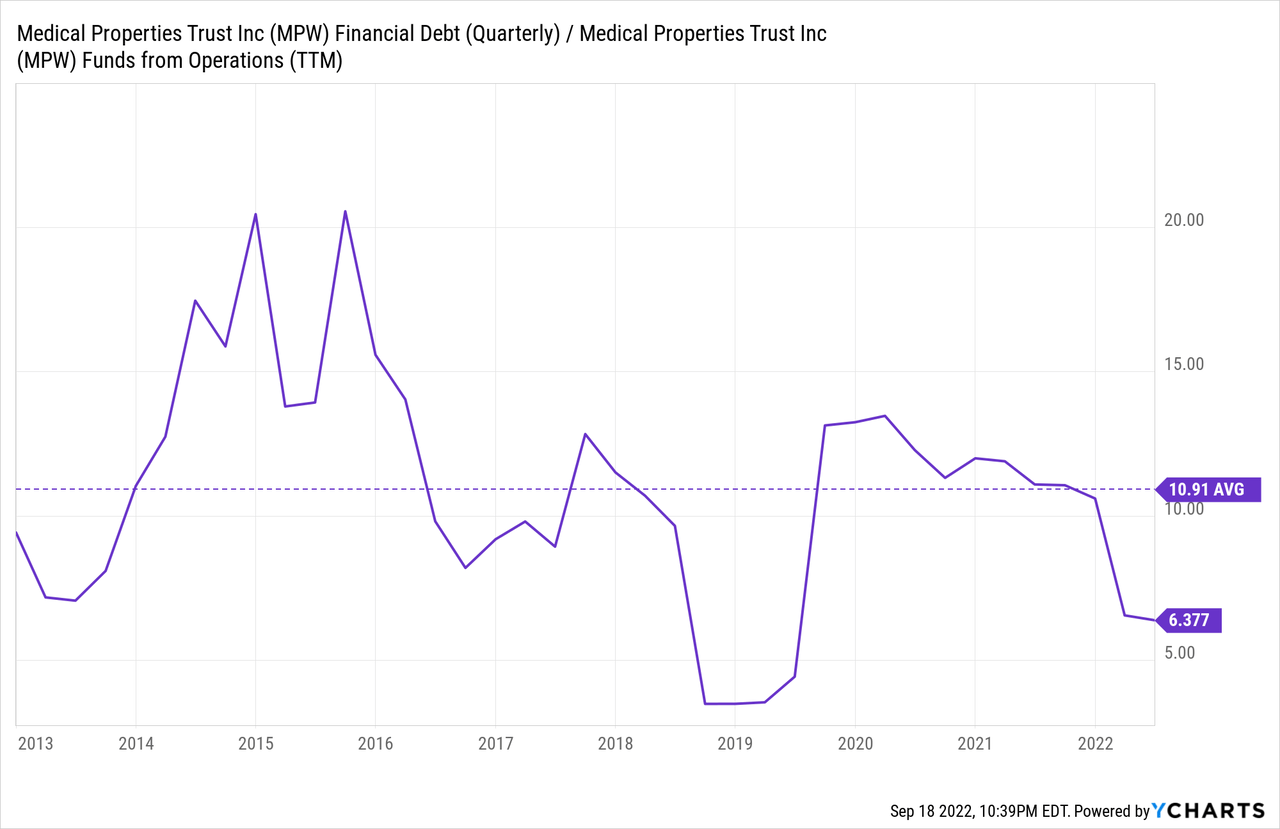
MPW has a BB+ S&P Credit Rating which is below investment grade. Over the last 10 years MPW has had an average debt to FFO ratio of 10.91. That ratio has improved to 6.37 recently. Shares have a book value of $14.80 compared to the last traded price of $13.80.
To continue on the positive note, SA Factor Grades for MPW are mostly excellent with B+ or better for valuation, growth, and profitability. This is partially due to MPW trading at an FFO yield of 12.1% compared to a normal price to FFO of 6.4% and an EBITDA margin of 88.66%.
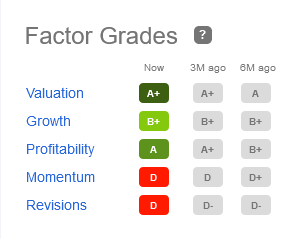
Seeking Alpha
The chart from FAST Graphs below demonstrates how undervalued MPW is compared to its past five years of trading. If growth estimates are correct, a return to its normal P/AFFO multiple of 14.28x by 2024 would result in a total return CAGR of 27.3%.
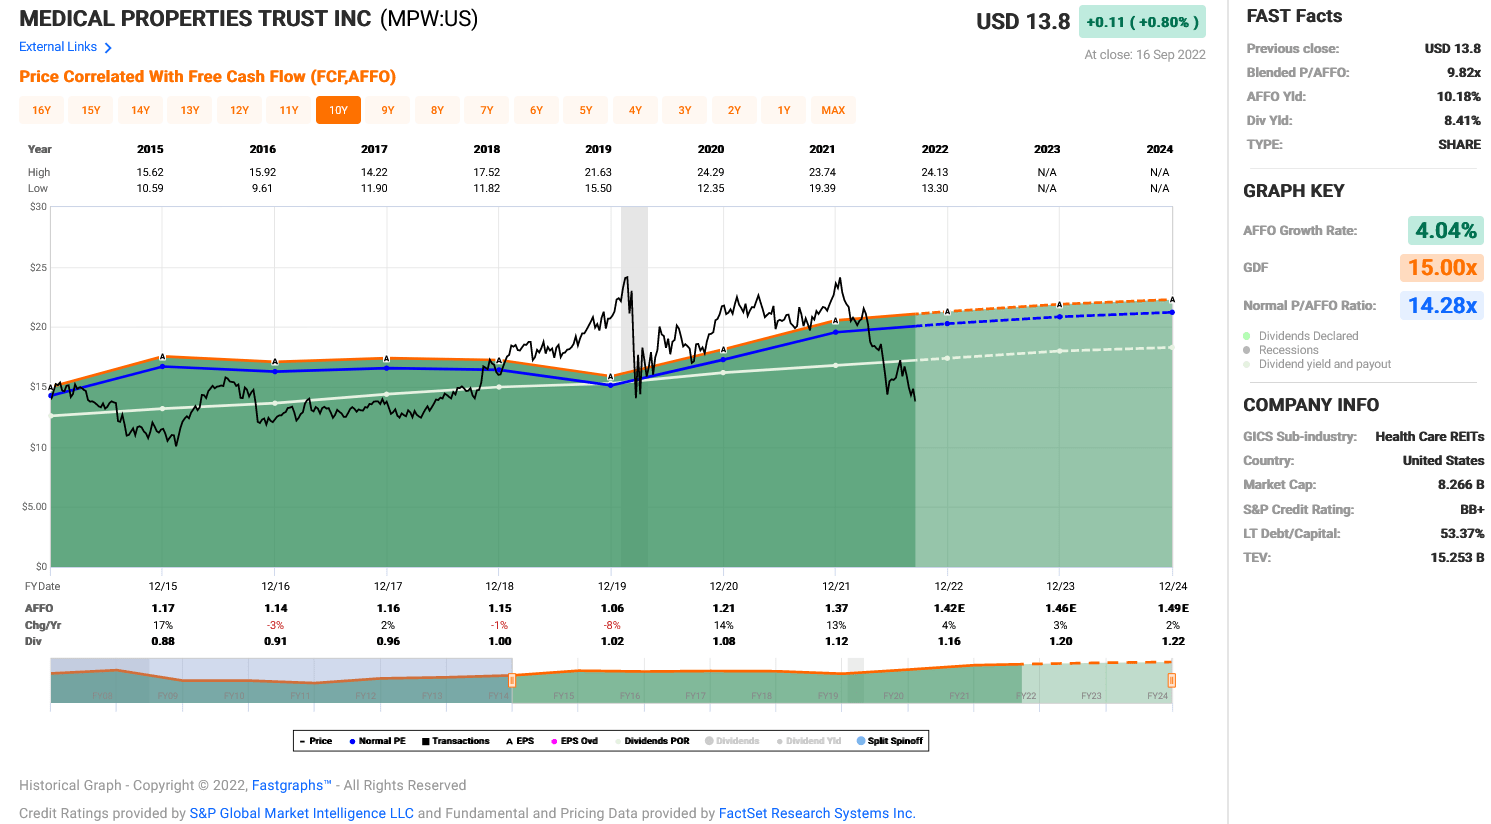
FAST Graphs
What’s the issue, then?
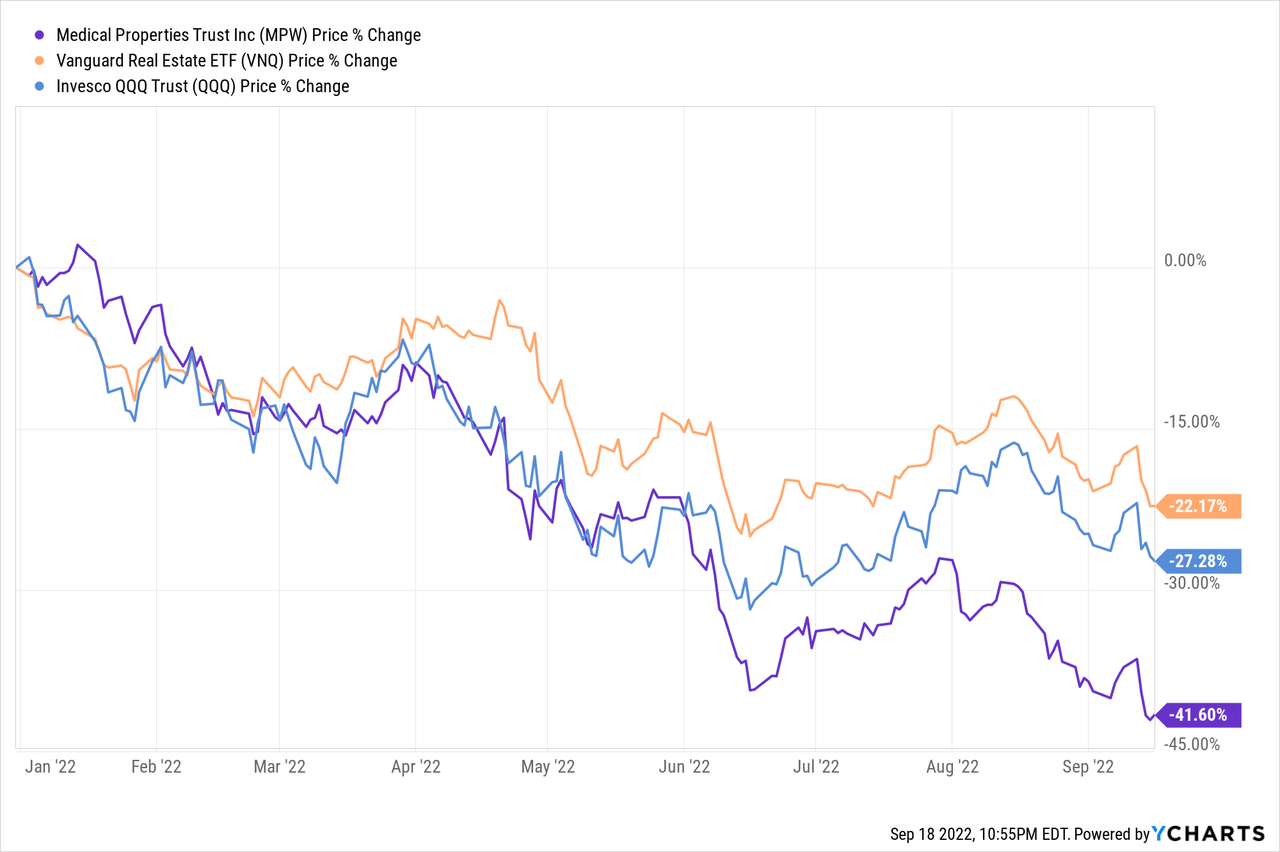
There is a reason why momentum has been in the gutter and share price has declined 41% YTD. To begin, MPW is down because the entire sector is down. Equity markets at large have suffered from the effects of monetary tightening and contracting credit creation since the start of the year, but especially sectors that are interest rate sensitive including the Nasdaq (QQQ) and REITs (VNQ). MPW began to diverge from these broader trends around June.
In July, Credit Suisse cut MPW from outperform to neutral, primarily due to lower growth expectations. This is what analyst Tayo Okusanya said about the move:
…the outlook for hospitals has gotten more challenging with ongoing labor cost pressures, muted admin volume growth and a decline in high margin COVID-19 patient volume.
The combination of inflation, higher rates, and labor issues specific to the healthcare industry are impacting MPW’s future outlook. These issues are contributing to struggles to meet revenue estimates over the past two quarters where revenues surprised to the downside by -0.29% and -0.17%.
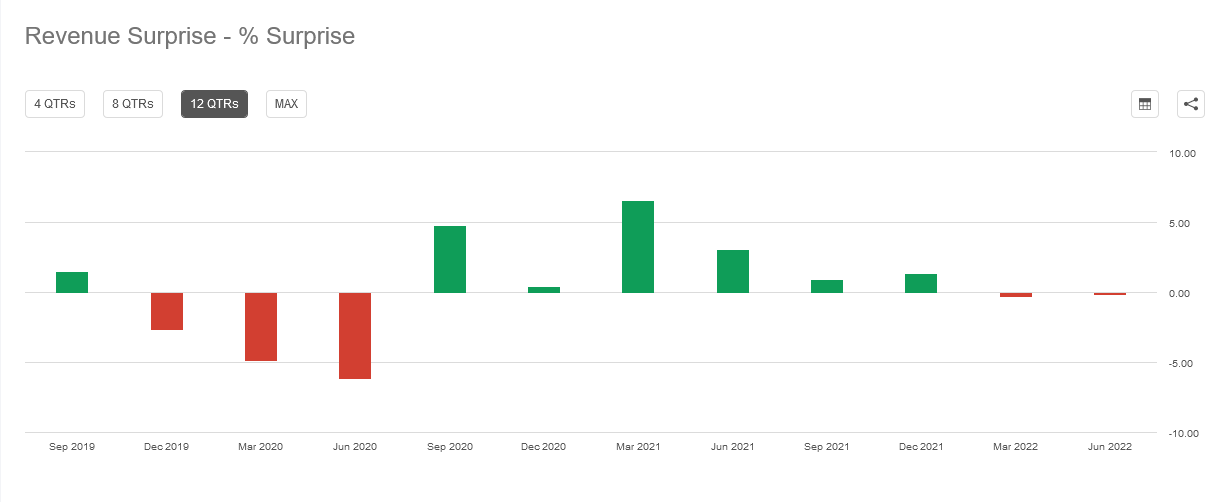
Seeking Alpha
But the real issue is the problems that have risen with their largest tenant Steward Health Care System. Steward represents 20% of MPW’s total leased assets and 27.8% of company revenues in Q2 2022.
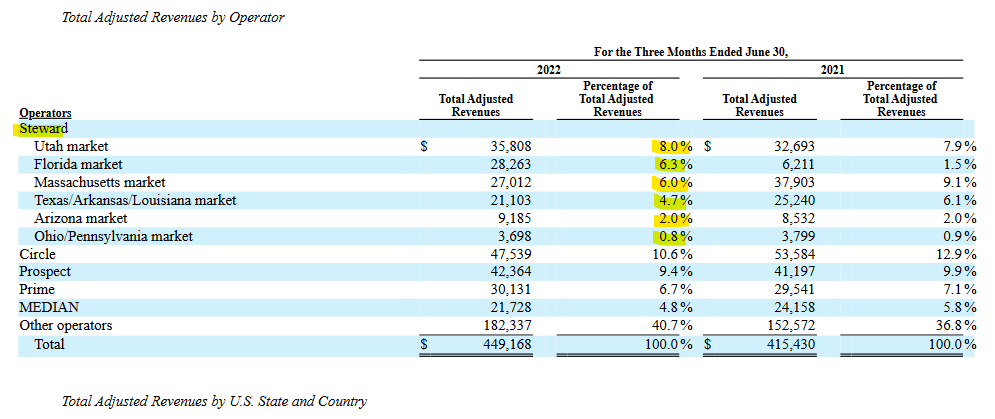
Seeking Alpha (company 10Q filing)
In addition, at the end of the Q1 MPW owned $139 million of equity in Steward and Steward owed MPW secured loans for $363 million. Management announced an additional $150 million credit facility to Steward at the Q2 teleconference.
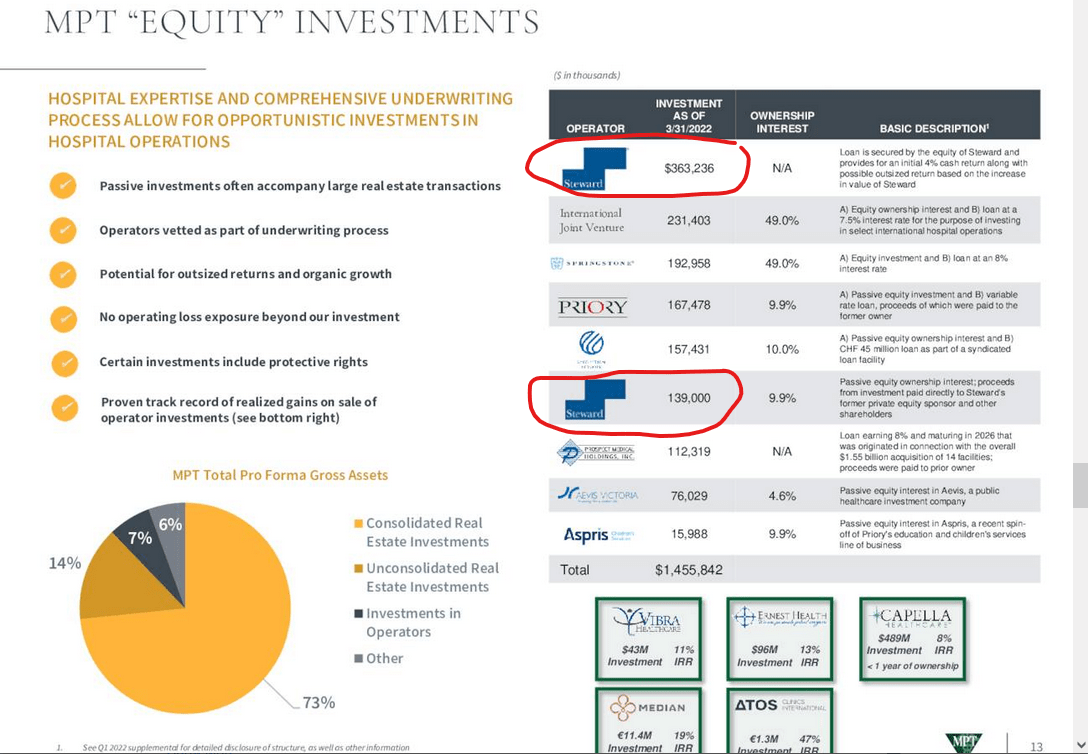
Seeking Alpha (company quarterly earnings presentation)
Unfortunately, the need for this financial support is because Steward has been struggling to perform and is showing signs of financial vulnerability. Steward has been in litigation against Tenet over data services for hospitals that Steward bought from Tenet. In the suit Tenet has alleged that Steward is insolvent. The issues resulted in Hedgeye initiating a short position on MPW.
Management has been pushing back and voicing support of Steward. During the Q2 Earnings Teleconference Call CEO Edward Aldag said this about Steward’s operating status:
Volumes at Steward are up 11% over the volumes in February and up more than 20% than the same time last year. And very importantly, the quality of these volumes is strong. Current labor costs at Steward are currently 9% lower than they were in January.
Later, CFO Steven Hamner stated this:
But we are confident that Steward, especially in its major markets, is a healthy operator and will continue to pay its rent based on very strong long-term coverage ratios. And most importantly, even if Steward is not the lessee, we believe the value and characteristics of our real estate currently leased to Steward, will attract, frankly, as it already has multiple potential replacement operators.
If Steward experiences trouble paying rents or debts there is a strong likelihood that MPW’s dividend is at risk for a cut. Given the risks I would change the dividend safety score from B- to D.
Summary
MPW’s yield is too high, its high because of elevated risk. There is much to consider with Medical Properties Trust that is worthy of further research. If Steward can pull through the challenging environment for hospitals and deliver its share of revenues to MPW then the dividend is superb. If not, there is a wide range of possibilities which will include a dividend cut, at best. I have decided to sell deep OTM October cash covered puts on MPW to achieve the same yield as the dividend.
These are my top ten dividend payers lists for September. If you missed it, go back and read my top ten lists for August. We will chat again next time.
Be the first to comment