

DNY59/E+ via Getty Images
In this month’s article I outline why I will reduce my allocation to the SPDR S&P 500 ETF (NYSEARCA:SPY) in July to 40% with the other 60% of my assets to cash. First let me review my pension plan performance in June. The market, as measured by the S&P 500 index, returned -8.39%. As for my pension plan assets, I outperformed the index by limiting my loss to 3.99% in June. My investment objective of preserving my capital was not met as I did lose money. I did meet my second investment objective which is beating the S&P 500 index. Table 1 below shows my returns and allocations for the month of June and Table 2 below shows my returns for the past 12 months.
I have made changes to Table 2 below after I received a comment from a reader. Table 2 shows new columns to better (more accurately) reflect my investment results. The third column, $100K Hypo, is what my returns would be if I started my account with $100,000 in my first article of this series and followed the allocation recommendations from my articles. The fifth column, $100K SPY, shows the returns of just investing $100,000 and keeping it all allocated to SPY. The percentage returns in the last row show that my strategy returned a negative 7.02% for the last 12 months and simply investing in SPY would have returned a negative 10.06% for the last 12 months. Therefore, I have outperformed SPY for the last 12 months by 3.58%.
Table 1 – Investment Returns for June
Author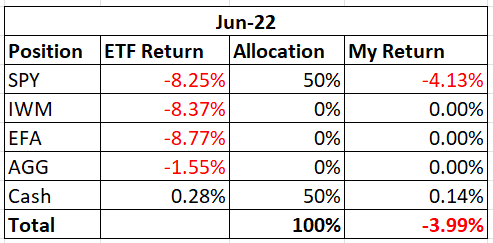
Table 2 – Investment Returns Last 12 Months
Author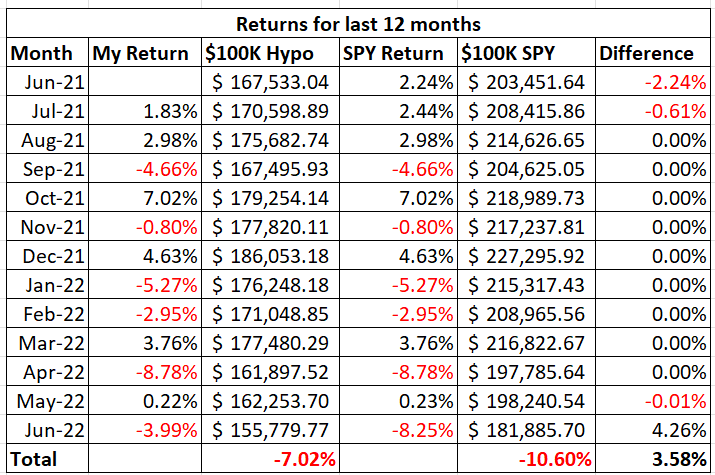
To review the purpose of this series of articles, my retirement account only allows me to buy the following four ETFs: iShares Core U.S. Aggregate Bond ETF (AGG), SPDR S&P 500 ETF (SPY), iShares Russell 2000 ETF (IWM), and iShares MSCI EAFE ETF (EFA). I can also have my money in cash. The question is how to decide where and when to allocate money to these various ETFs.
I use my moving average crossover system combined with relative strength charts to determine how to allocate my pension plan assets. My moving average crossover system uses the 6 month and the 10 month exponential moving averages to identify which of the four ETFs are in a position to be bought. If the 6 month moving average is above the 10 month moving average then the ETF is a buy. I call this setup being in bullish alignment. When the 6 month moving average is below the 10 month moving average the setup is referred to as a bearish alignment. When a bearish alignment happens, I don’t want to hold that asset. See Chart 1 below for a long-term look at the S&P 500 index using my moving average crossover system.
Chart 1 – Monthly SP 500 Index with 6/10 Moving Averages
www.stockcharts.com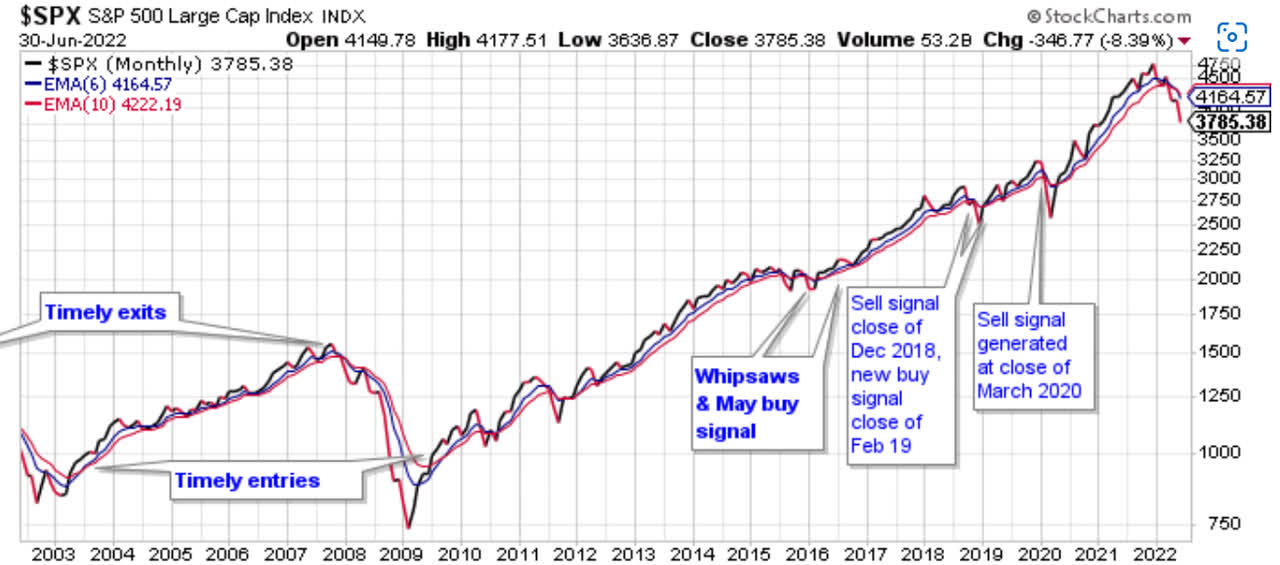
You can see that the moving average crossover system provided some excellent long term buy and sell signals that would have allowed investors to capture long duration moves in the index; while avoiding costly drawdowns. Avoiding these costly drawdowns allows me to meet the objective of capital reservation.
I employ this strategy because I do not want to experience a large drawdown with my pension assets. During the 2008 – 2009 market crash many people didn’t even look at their retirement statements because they were afraid of what they would find. I submit that if those people would have used a market strategy like what I outline in this series of articles, they would have been able to avoid much of the decline during the bear market and consequently would have had less emotional stress during that time period.
The following charts show the current status of the ETFs that I am allowed to buy in my retirement account.
Chart 2 – Monthly SPY with 6/10 Moving Averages
www.stockcharts.com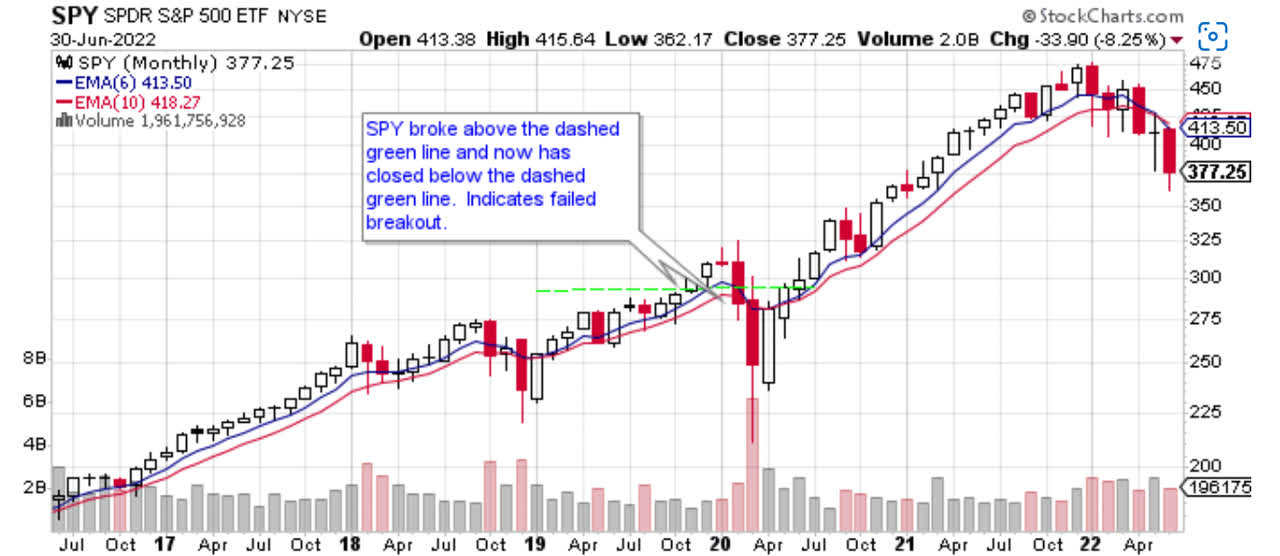
Chart 2 shows that SPY lost 8.25% in June. Perhaps that is no surprise as we are now in the unfavorable season for the stock market which is June thru October. Back to Chart 2, SPY closed below the low of the previous candlestick and is now in bearish alignment. The six month moving average is below the 10 month moving average and both moving averages are trending lower. Therefore, I am reducing my exposure to SPY to 40%. I want to maintain some money in SPY because once the bear market ends, I want to ensure that I have some immediate exposure to the rally once the bottom is made. I will continue to monitor this chart and allocate as needed.
Chart 3 – Monthly IWM with 6/10 Moving Averages
www.stockcharts.com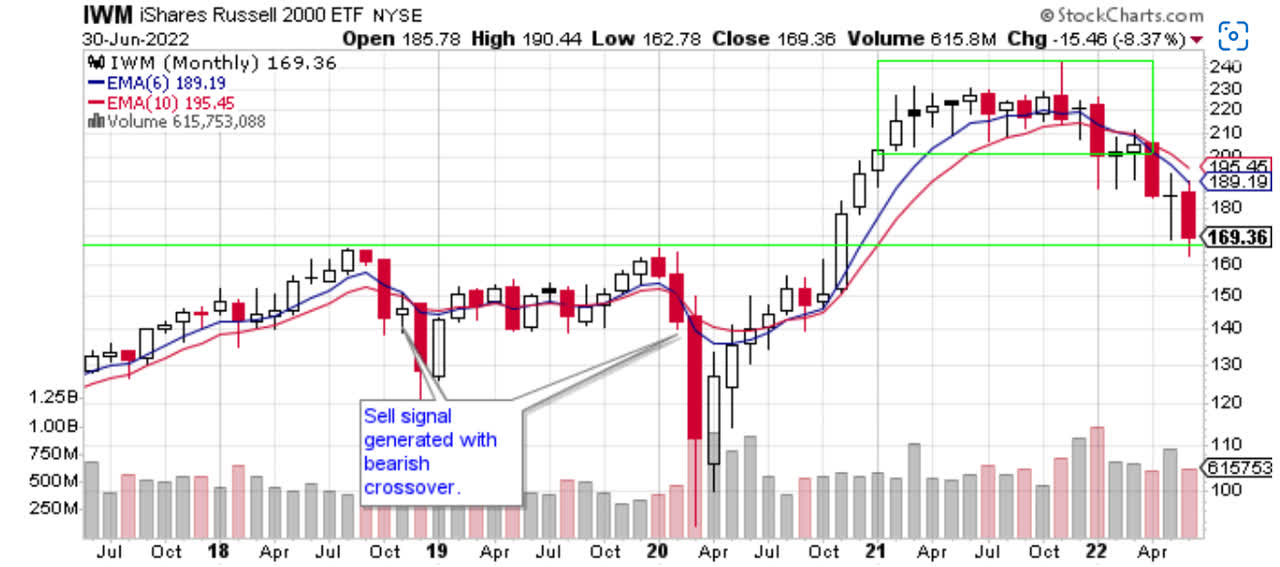
Small cap stocks declined 8.37% in June as shown by Chart 3 above. IWM remains in bearish alignment. A good sign for the bulls is that IWM was able to stay above support as represented by the green line. If IWM can’t stay above the green line, then the next best area of support may be the 145 area.
Chart 4 – Monthly IWM:SPY Relative Strength
www.stockcharts.com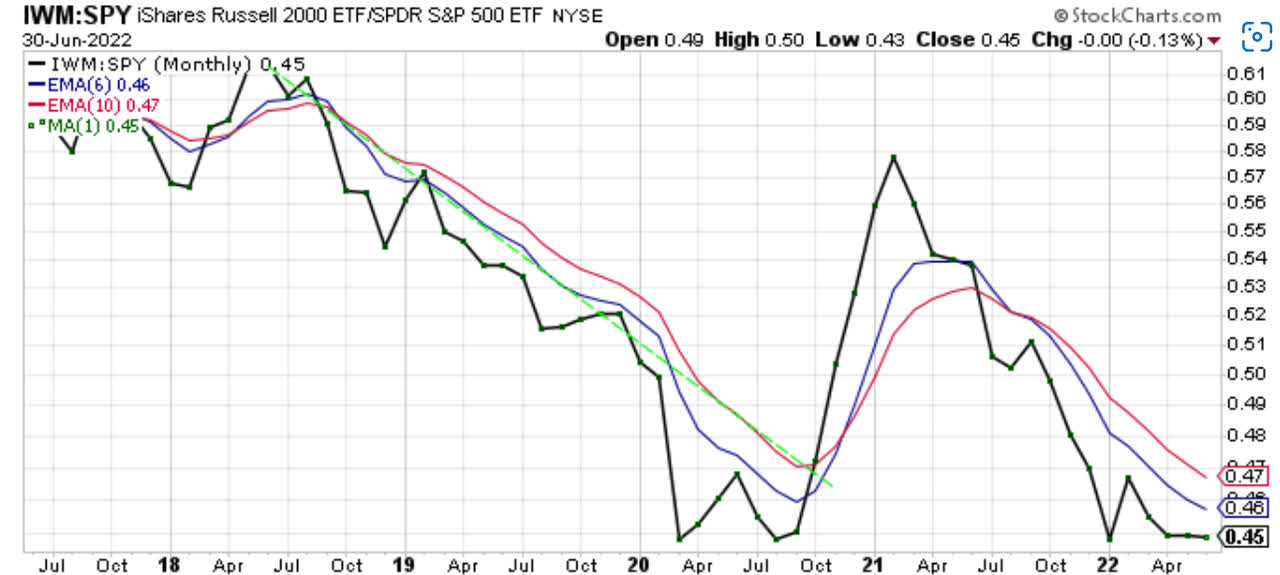
Chart 4 shows that the IWM:SPY ratio is remaining at its lows. In June IWM performed about the same as SPY. It will be interesting to see if these lows hold or if the ratio makes new lows. The ratio remains in bearish alignment. You can also see that the ratio has been making a series of lower highs and lower lows since the beginning of 2021. That is the classic sign of a down trend. Investors still prefer large cap U.S. equities over small cap U.S. equities. I will need the ratio to close above the red 10 month moving average before I consider allocating money to IWM over SPY.
Chart 5 – Monthly EFA with 6/10 Moving Averages
www.stockcharts.com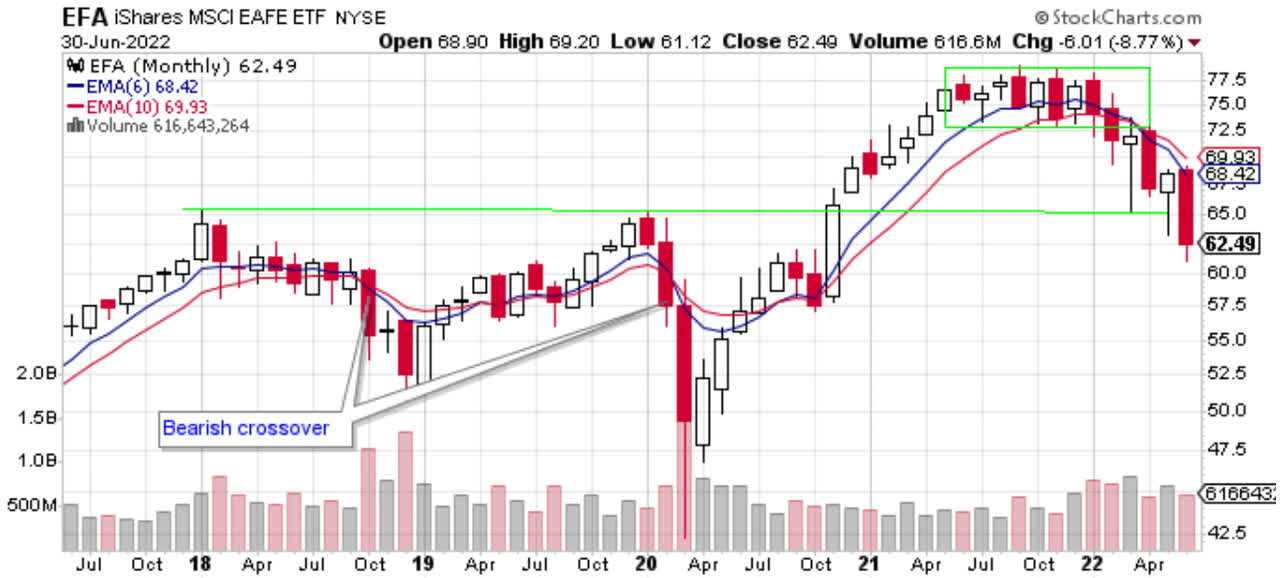
Chart 5 shows that EFA lost 8.77% in June. EFA remains in bearish alignment. Another bad development is that the $67.50 area did not hold price. That price is represented as the green line on the chart. If EFA doesn’t rebound quickly and close back above $67.50, that price level could act as resistance in the future.
Chart 6 – Monthly EFA:SPY Relative Strength
www.stockcharts.com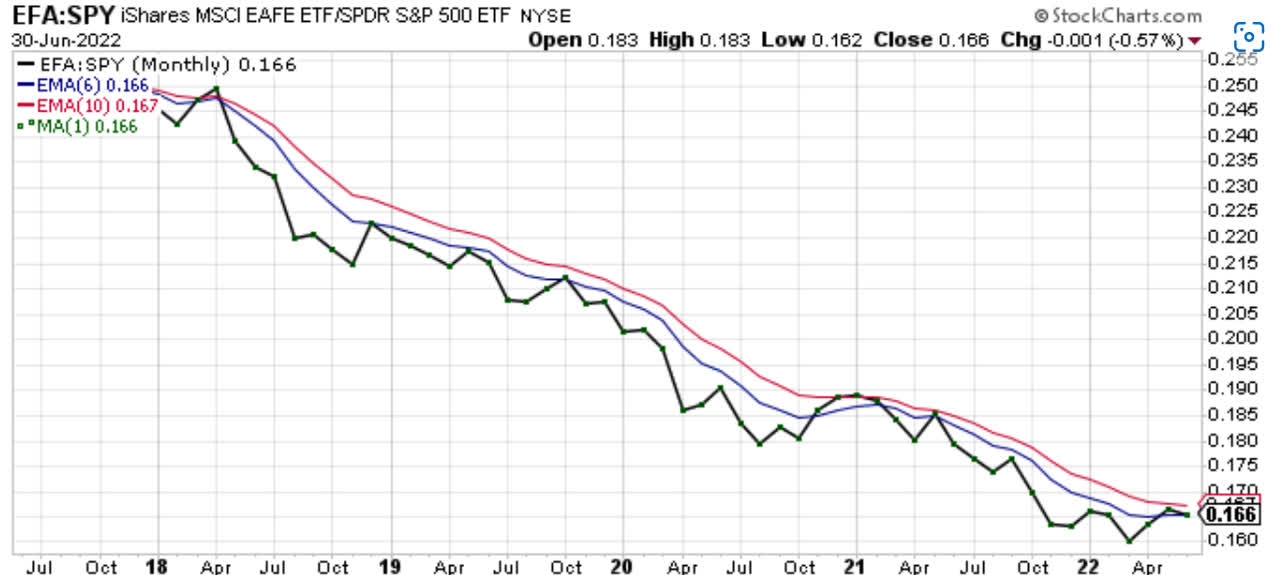
The EFA:SPY ratio showed a slight decline in June. As I wrote last month, this ratio is showing some strength. I need to see this ratio close above the red 10 month moving average before I allocate money to EFA over SPY.
Chart 7 – Monthly EFA:IWM Relative Strength
www.stockcharts.com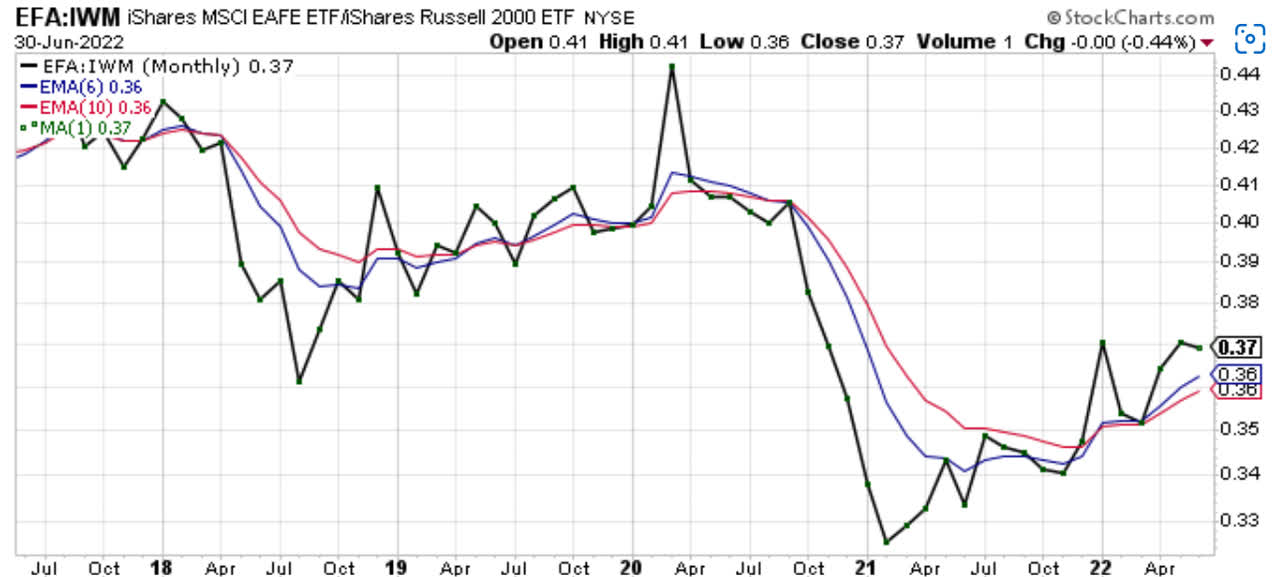
Chart 7 shows that EFA just underperformed IWM in June by 0.44%. The ratio remains in bullish alignment and is the only bullish alignment you will find in this article. The ratio is making a series of higher highs and higher lows while the two moving averages are now trending higher. I will continue to watch this chart to see how events unfold.
Chart 8 – Monthly AGG with 6/10 Moving Averages
www.stockcharts.com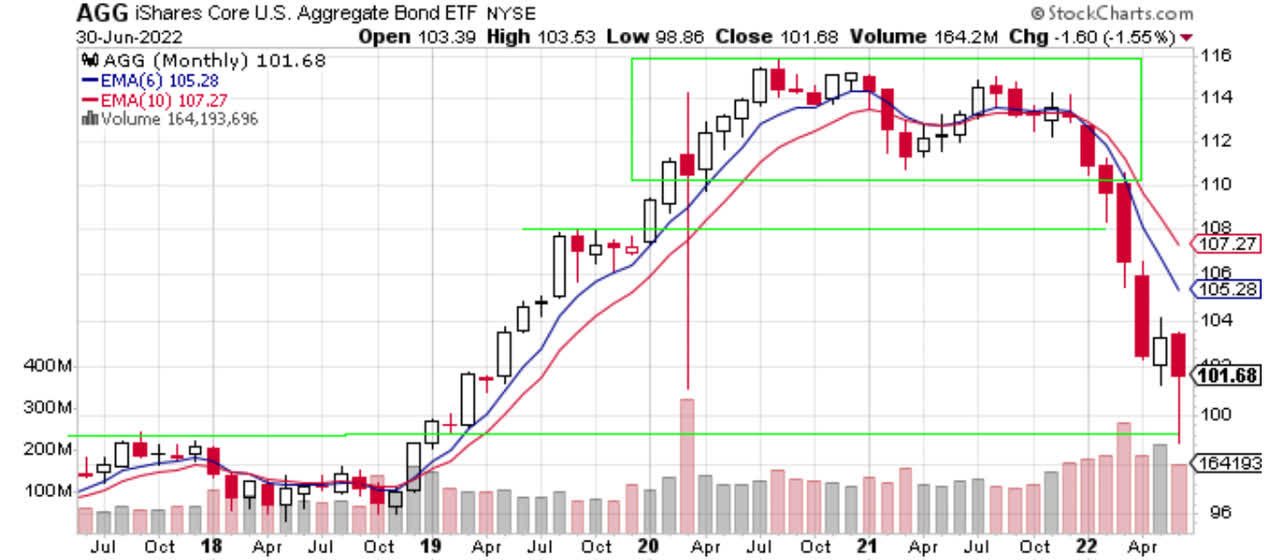
AGG lost 1.55% in June. AGG remains in bearish alignment and the distance between the two moving averages continues to widen. The good news is that so far, the green line has acted like support. AGG bounced off that level and closed above the low of the previous month’s candle. Perhaps this is a bullish development. It’s no surprise that AGG was the best performing ETF in June as bonds are supposed to be a lower risk investment. I will continue to monitor this chart.
Chart 9 – Monthly AGG:SPY Relative Strength
www.stockcharts.com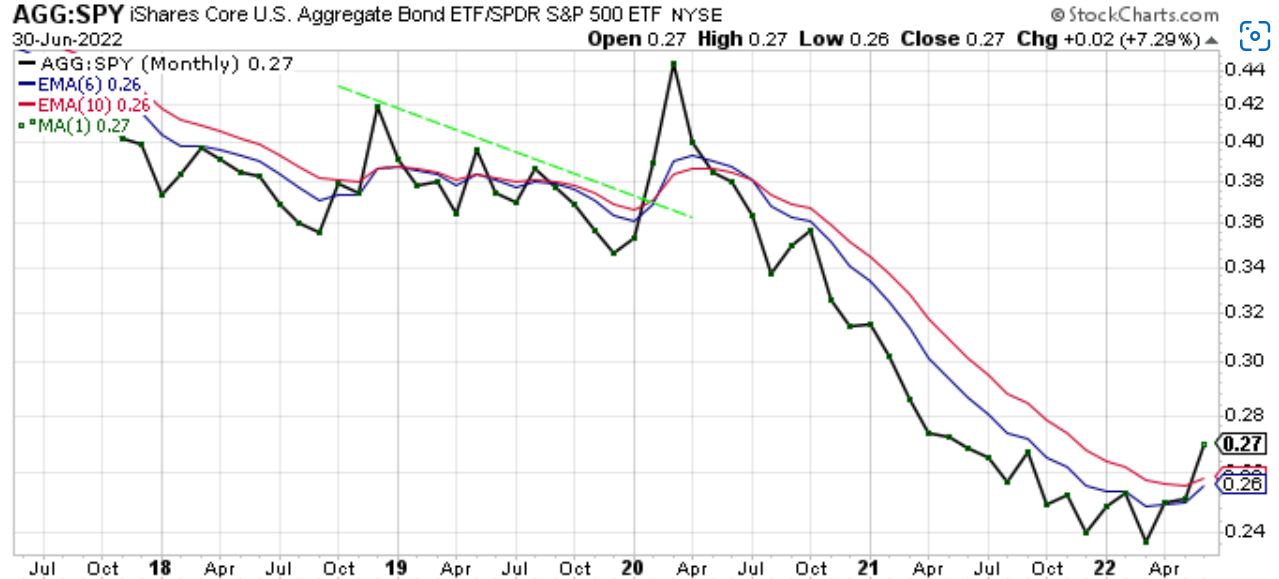
The AGG:SPY ratio in Chart 9 gained a robust 7.29% as AGG outperformed SPY in June. For the first time since April 2020, the ratio closed above the red 10 month moving average. Both moving averages are now trending higher and the AGG:SPY ratio could be in full bullish alignment soon. We will have to wait and see.
In summary, every ETF I covered in this article was lower in the month of June. AGG was the best performing ETF because it managed a small loss of -1.55%. The equity ETFs all lost a little over 8% in June. Because SPY is now in full bearish alignment, I am reducing my exposure to SPY by another 10%. I will have 40% in SPY and 60% in cash for the month of July. I am keeping 40% in SPY in case the bottom is in right now. While I doubt that is true once the market rebounds, whenever that is, I will have immediate exposure to SPY. We are now in the unfavorable months for the stock market; June – October. There is a lot of talk about a bear market, recession, etc. Is the bear market over or is it just beginning? I don’t know. I just try to follow price and the trend. Right now, the trend for equities and bonds remains down. I will monitor the markets for the month of July and then reallocate, if necessary, at the end of the month.
Be the first to comment