aydinmutlu/E+ via Getty Images
Investment Thesis
Murphy USA (NYSE:MUSA) has cyclicality in its cash flow growth that is correlated to crude oil prices. It is not only likely to enter a range-bound period but also prone to pulling back due to higher cost, lower volume, and higher financing expenses. We deem the current price too rich and, instead, give a fair-pricing entry point under assumptions aligned with our analysis and stress-test scenario.
Qualitative Highlights
Company Overview
Murphy USA was called the “Walmart of Gas Stations” when it became public in 2013 because most of its stores were located in close proximity to Walmart (WMT) Supercenter stores. The company strives to provide low-price fuel and daily merchandise to customers in its network of retail convenience stores throughout the country. It looks for the same bargain-hunting consumers who visit Walmart to visit its stores for fuel and other merchandise demands to be met.
Indeed, it has purchased from Walmart the properties underlying many of its stores since 2007. It also markets to unbranded wholesale customers through MUSA-owned and third-party terminals. Its stores carry a broad selection of snacks, beverages, tobacco products, and non-food merchandise, as well as a broader food and beverage offering at its QuickChek locations.
Strength
Firstly, what is the competitive advantage of MUSA in providing low-cost fuel products? According to its 10-K filing, MUSA sources fuel supply from nearly all of the major and large oil companies operating in the U.S. at rates that fluctuate with market prices and generally are reset daily, and its prices to retail consumers are also reset daily. The company keeps a lean inventory on-site at its locations with a once-a-day turnover.
From what it summarizes, it seems the company has two strategies to ensure low fuel prices. First is to have multiple alternative suppliers for most locations to take advantage of the price competition among them and to avoid product outages. Furthermore, the product is distributed through a few terminals that are wholly owned and operated by the company. It is also distributed through terminals owned by others, with exchange agreements with those terminals.
Half of the fuel they sourced is from marine transportation, and the rest is from pipelines. Diversification of the supply chain allows it to maintain continuity, while direct ownership lowers costs. Understanding this helps to show that MUSA is well-embedded in the fuel buying network and operating environment. That allows it to execute effectively and boost its margins. That explains, in part, why the company was able to navigate the supply chain bottleneck in the past three years, as its fuel margin increased by 3-7 CPG (cents per gallon) while its volume remained the same.
MUSA Fuel Margin &Volume (MUSA Presentation Mar 2022)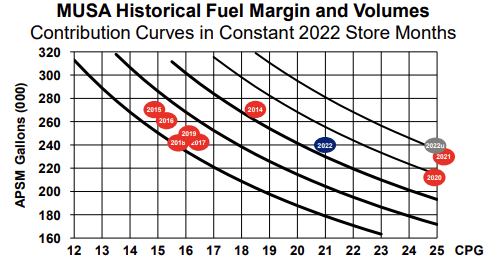
Besides retail fuel, the MUSA stores also carry daily merchandise that helps to retain customer loyalty and brand recognition as a convenience store chain. The breakdown of the revenue contribution of the segments is as follows:
MUSA Operating Revenue by Segments (Chart Created by Authored with data from MUSA 10-Q June 2022)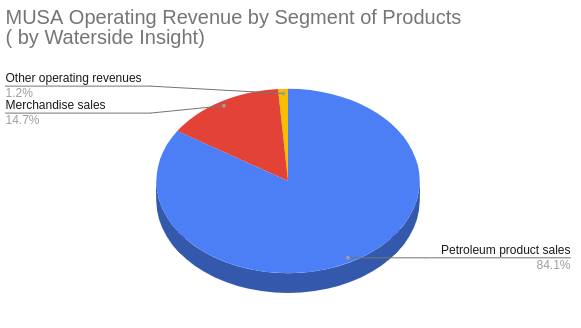
If we look at its merchandise business, which accounts for 14.7% of its overall revenue as of Q2 2022, MUSA stated that it sources almost 70% of its merchandise from a single vendor, Core-Mark, with a 5-year contract renewed in January 2021. 134-year-old Core-Mark is one of the largest distributors of fresh, chilled, and frozen merchandise, mainly to convenience stores in the U.S. Performance Food Group (PFG) (PFGC) acquired Core-Mark in May 2021.
So now MUSA’s merchandise sourcing has more extensive network support. MUSA also acquired QuickChek to improve the margins of the merchandise business. In addition to its similar business model to MUSA, QuickChek serves quick fresh food in a restaurant-style setting. The company hopes QuickChek’s higher-margin fresh food offering will help counter the other low-margin lines of business. We will come back to this later. Overall, MUSA is actively improving its merchandise business.
Last but not least, management has a history of delivering shareholder value through share repurchases. As it pledged in its Q3 earnings call, “additional free cash flow will be returned to shareholders via share repurchases.” This sums up one of the key aspects of its management style, which is always placing returning cash flow to shareholders as a priority. See the chart presented by MUSA of its cumulative shareholder returns over the years.
MUSA Shareholder Returns (MUSA Presentation Mar 2022)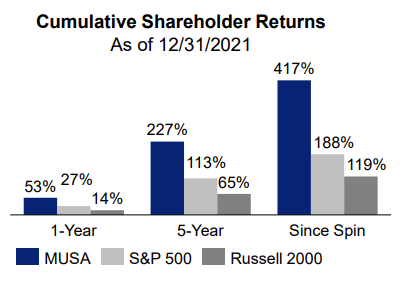
Weakness/Risk
There are several factors that could constrain MUSA’s near-term growth. The company has a razor-thin liquidity margin. To understand this, we can look at the difference between its Account Receivables and Account Payables; see the chart below. It has fluctuated between a positive $150 million and a negative $100 million per quarter since 2014. While free cash flow increased in the past two years due to increased income and efficient management execution, it fluctuated within a similarly narrow range.
MUSA Liquidity Analysis (Chart Created by Author with data from MUSA)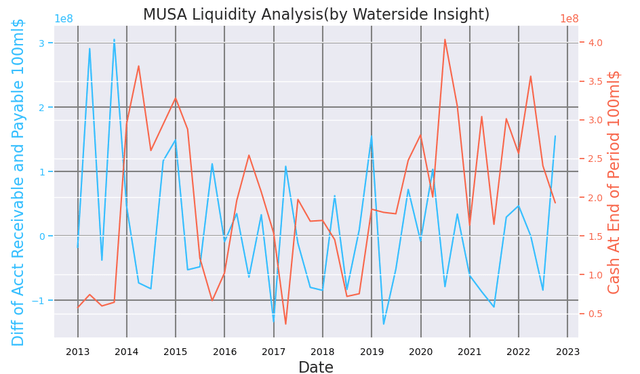
For the same reason that MUSA is highly embedded in the system, the exposure to the larger network will also make it vulnerable to macro headwinds. This is true even given the inelasticity of consumer staples demand. To see this, we plot the company’s net cash flow change vs. the average refinery margin quarterly.
MUSA FreeCashFlow vs Refining Margin (MUSA, Nasdaq Data Link, Waterside Insight)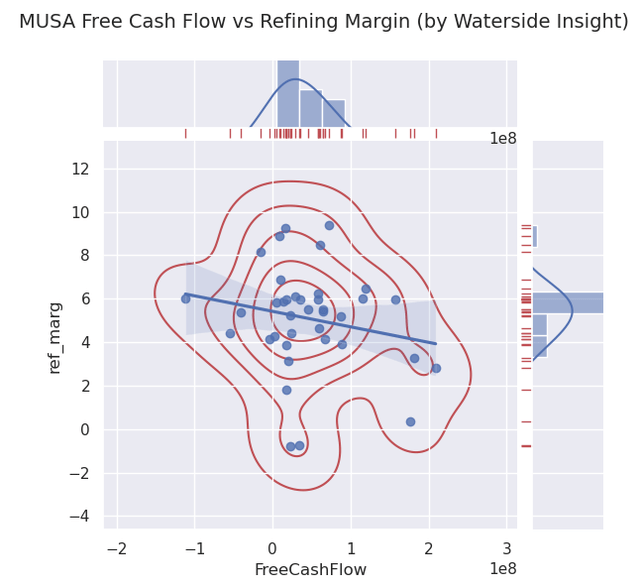
The average refining margin is currently around $6.3, its Q3 free cash flow is at $144.9 million. We see that with similar levels of refining margin at around $4-$6, MUSA’s quarterly net cash flow is in a wide range from positive $150 mil to negative $100 mil while clustering around 0 to $100 million. The higher fuel margin we saw in the earlier chart could not be directly translated into consistently higher net cash flow.
The high volatility can be attributed to many factors, as the company highlighted in its 10-Q, such as higher store operating expenses, higher payment fees, higher depreciation and amortization expenses, higher acquisition and transaction-related expenses, and lower retail fuel sales volumes, and lower merchandise contribution, lower all-in fuel contribution, and last but not least, higher interest rate expenses. Indeed, even though its revenue remains at a historical height, its gross profit decreased by almost half in Q2-Q3 2022. The question is where that trend will lead from here.
MUSA Profitability Analysis (Chart Created by Author with data from MUSA)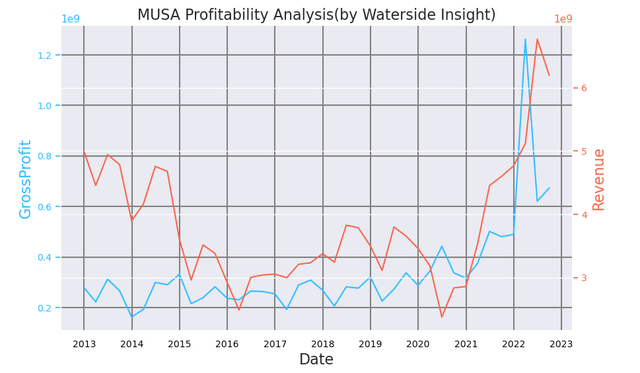
As we can see from a correlation study, at the current crude oil price range of $75 – $98 MUSA’s quarterly net cash flow is primarily clustered in the negative territory. Perhaps an extraordinarily high crude price will give MUSA’s retail price a boost, while an extremely low crude price could help MUSA control costs. When the crude price is right in the middle, it can eat into the margin and make it more difficult to cut costs, affecting cash flow. This explanation is only an inference, and we did not have all the operational data to verify this hypothesis. Nonetheless, it raises the possibility that the same pattern of negative cash flow could repeat under the current environment.
MUSA Net Cash Flow change vs WTI Crude Price (Chart Created by Author with data from MUSA, EIA)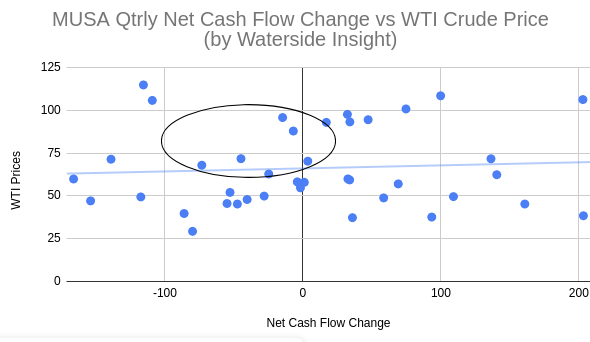
In the meantime, its debt has also shot up. Currently, its total liabilities are at the highest level since its IPO (insert chart). Due to the highest debt level and a rising interest rate, MUSA chose to accelerate stock repurchases instead of paying down some of the outstanding balance. The difference between debt repayment and common stock repurchases was particularly pronounced in Q3. See the chart below – note that common stocks repurchased and debt repayment are reported as negative numbers.
MUSA Debt Repayment vs Stock Repurchase Compared w/ Total Debt (Chart Created by Author with data from MUSA)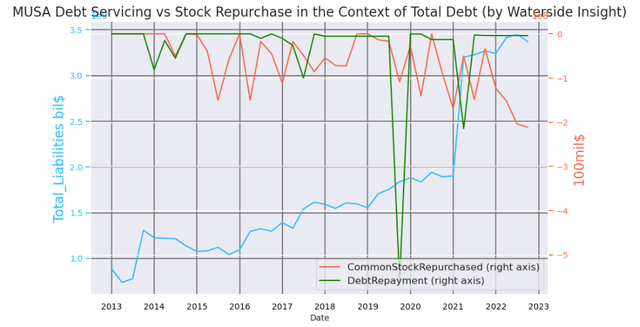
As the company explained in the earnings call, it is “well ahead of schedule” to complete the five-year $1 billion stock repurchase program the Board approved in 2021. It repurchased its stock at an average of $276 per share in Q3 for $212 million. To put it in context, $276 is only within 10% of its stock price’s all-time high. We are not sure it is a wise way to spend its cash pile while its debt burden is elevated. In addition, looking at its debt repayment history, it has always been at a minimal level, except for a period in 2019 and 2021. Liquidity-wise, it has kept its quick Ratio below one most of the time for the past eight years. But in Q3, this ratio almost dropped to one of its lowest levels at 0.639. See the chart below.
MUSA Quick Ratio (Chart Created by Author with data from MUSA)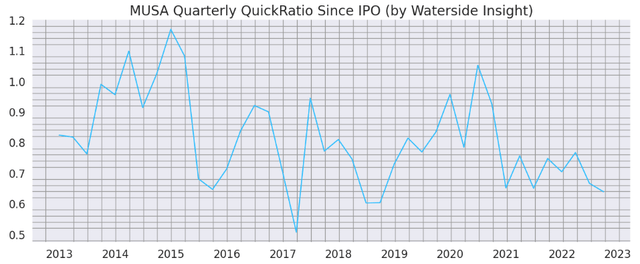
The question is, will it fall even lower? And in a rising interest rate environment, how much longer can the company continue operating with a sub-one quick ratio while still rewarding its free cash flow to shareholders as a priority? Yes, it has a $350 million revolving credit facility available. This low quick ratio won’t put it in any serious financial distress in the short term. But it’s nonetheless a concern.
The period since its IPO until early this year has been characterized by an ultra-low interest rate environment, which is not likely to repeat any time soon. It has bought back over 25% of its shares in the past three years. And it wants to buy back another 25% by 2026. As a result of its thin profit margin, when debt servicing costs increase due to higher interest rates, stock repurchases will inevitably, or perhaps, wisely, slow down. Share buyback program for long-term investors referred to in the earnings call could face some challenges if it is to achieve “long-term enduring value.”
Using its quarterly data since 2012, we can also do a clustering study of its total liabilities versus its EBITDA. What we found is that at its current level of liability, its EBITDA is likely to revert to around $100 mil per quarter, which occurred during the past low-interest-rate environment. With higher interest rates ahead, reverting to a lower EBITDA scenario is more likely than in the past. (change the x, y label to add billion and 100 million)
MUSA Total Debt vs EBITDA (Chart Created by Author with data from MUSA)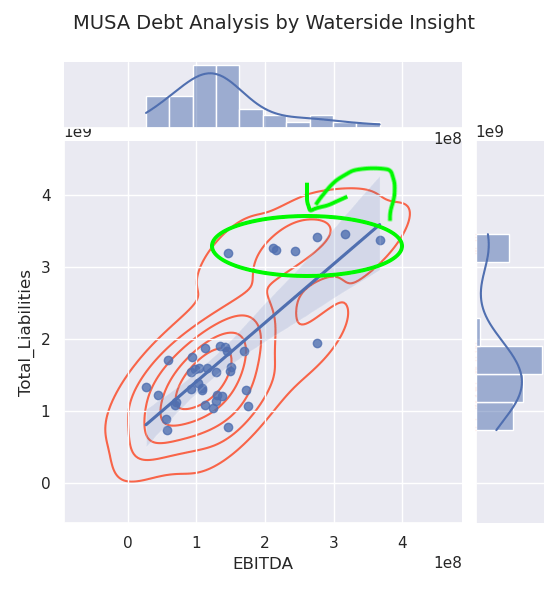
And how much would the recent acquisition of QuickChek help with margins? Let’s take a look at its store locations by state.
MUSA No. of Stores by State (Chart Created by Author with data from MUSA)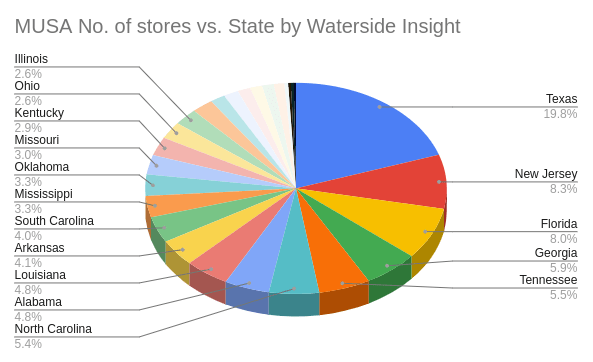
QuickChek stores are primarily located in New Jersey and some in New York. As New Jersey stores accounted for 8.3% of MUSA’s total number of stores, and recall we outline that its merchandise/other operating revenue accounted for about 16% of the total revenue, then we can infer that the underlying business will see a boost from QuickChek acquisition would be about 16% x 8.3% = 1.3%. It is not anticipated to change its margin-generating dynamics fundamentally.
Overall, we see reduced earning momentum ahead for MUSA when facing macro headwinds and an increased debt load in a higher interest rate environment. It is not entirely due to the mismanagement of the company but rather the cyclicality of the business as both the economic cycle and commodity cycle coincide. By no means is the company in any financial distress, as its current ratio remains above 1. However, management would probably have to adapt to the new environment to create more sustainable growth.
Quantitative Highlights
Financial Overview
MUSA reported robust revenue and earnings in Q2 2022, with revenue at $6.2 billion and earnings at $183.3 million. In 2021, its revenue was $19.1 billion, and earnings were $548.5 million. Record breaking for the annual and quarterly data, respectively. However, its net change in cash in the last quarter was negative $115.8 million, reversing the $99.8 million gain in Q1. Its total liabilities increased by $41 million from Q1 to Q2 to $3.455 billion. However, this is the highest level since its IPO, almost doubling its value in 2012.
Earnings per share in Q3 continued to increase steadily and reached their highest level since 2012, at $9.46. Its Twelve-Month-Trailing gross margin is at 6.92%, while its Net Profit Margin is at 2.91%. Its Debt-to-Equity ratio is 296.9%. Overall, its earnings and profitability have kept a stable pace compared with the previous quarter and on a YoY basis, while its debt burden is also at some of its highest levels.
MUSA Overview (Chart Created/Calculated by Author with data from MUSA, Seeking Alpha, Yahoo! Finance)
MUSA Valuation
Long-Term Trends
To project its cash flow over the next ten years, we need to pay attention to the long-term trend of gasoline demand and nicotine consumption. The U.S.’s total gasoline consumption is perhaps at the same level as ten years ago while slightly declining compared with twenty years ago. It is a gradual but declining trend in the long term.
U.S. Gasoline Sales (Advisor Perspectives)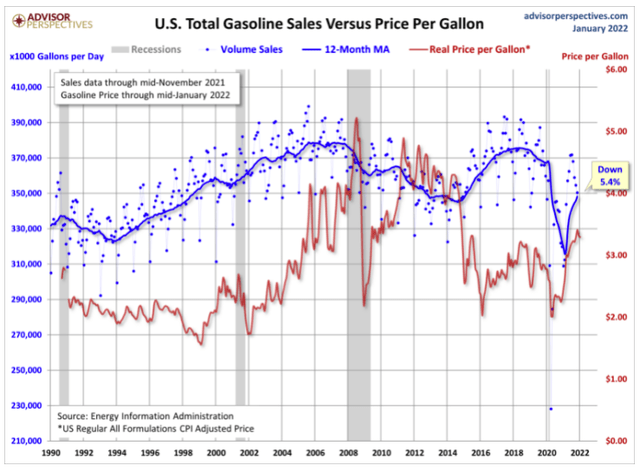
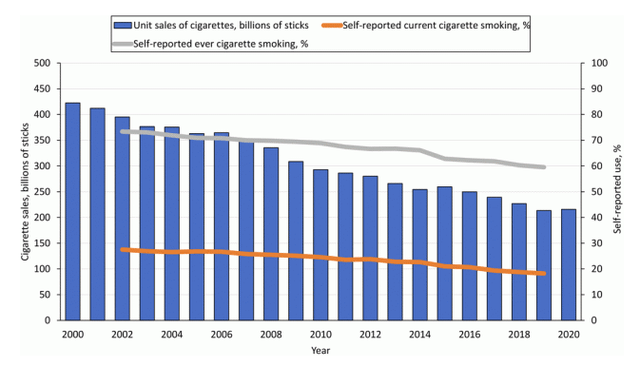
Throughout the past 10 years, nicotine consumption has steadily declined by about 50%, as the chart below shows. If the trend continues, it will be halved again in the next ten years.
Valuation
Incorporating all the long-term trends with our company-specific analysis above, we use our proprietary models to evaluate MUSA’s current price. We calculated 6.95% as the Cost of Equity, 6.46% as the WACC, the cost of debt as 7.2%, and the corporate tax rate as 24% given by its income statement. As a result of the cyclical nature of crude oil and gasoline prices, we also applied a layer of cyclicality and exogenous shocks to the future ten years of MUSA’s free cash flow projection to feed into the Discount Cash Flow analysis.
In our best-case scenario, where more growth upfront in the ten-year period and it focuses on paying down debt, the stock is priced at $332. Under the riskiest scenario, the company keeps returning cash to shareholders as a priority while keeping its debt high until it must take action; the stock is priced at $160. In that scenario, the price could fall even lower as it might need to raise cash by issuing stocks. In our base case, where the company starts paying down its debt while maintaining healthy cash flow, the stock is valued at $225.
Stress-Test Scenario:
Here we also present a very simple stress test to account for the hit from recession risk alone: MUSA wasn’t publicly listed in the Great Recession period of 2008-2009. To hypothetically stress test MUSA’s stock price, however, due to its close relationship with WMT, we can look at how Walmart behaved during that stressful period. Since the company’s stores are located close to Walmart stores, if foot traffic to Walmart stores is reduced, its volume will inevitably be impacted even margin is unchanged.
Walmart was down about 26.32% from the height of 2008 to the low in 2009, proving that consumer staples cannot wholly escape the economic blow brought by the recession either. If we assume MUSA could reel in its retail fuel business as a cushion and be blunted only by 75% of that downside risk, it is still signaling a 19.5% drop from its high, which is at $256.
Conclusion
Murphy USA has experienced management and effective execution that helped the company navigate the significant uncertainty caused by the pandemic and supply constraints in the past three years. As a result, shareholder values were high. At this point, though, Murphy USA has exhausted its upward momentum in the near term. It is not in immediate financial distress.
However, with recession risk mounting, a higher interest rate environment, and the company’s bias of spending its free cash flow on paying back to shareholders, even at near-all-time high stock prices, instead of taking care of its highest debt load since it became public, the company is risking slipping into a lower-earning prospect and with less support for its current high price and valuation.
We would not recommend buying at these levels. Investors who have enjoyed the ride over the past three years may want to take profits for more diversification. For long-term investors, a better entry point should be between $225 to $256 or lower. The company represents some of the best executions in the retail fuel/convenience store category. We remain constructive on its growth and look to participate with fairer valuation.


Be the first to comment