

shapecharge/iStock via Getty Images
This article was first released to Systematic Income subscribers and free trials on Apr. 5
The price action of the municipal tax-exempt CEF sector has come like a punch in the gut for many income investors. In this article we discuss the recent moves, the overall valuation picture, our allocation stance as well as a number of funds we like.
We closed out last year in a very cautious stance on the tax-exempt sector on valuation grounds but have recently turned more upbeat for a number of reasons. First, the price action of the last few months has completely changed the sector’s valuation – in terms of underlying municipal bond yields, their relative valuation to Treasuries and in terms of tax-exempt CEF discounts.
Secondly, the recent yield curve inversion is historically a bullish indicator for longer-duration bonds. Bear flattening during periods of Fed policy hikes (i.e., when short-term rates rise faster than longer-term rates) tends to lead to a rally in the long-end of the yield curve (i.e., longer-end yields fall) as the curve inverts even more.
Thirdly, the recent curve flattening can allow fund managers to shorten up duration of their holdings without losing much yield. And finally, the recent 2023 fiscal budget proposal is muni-friendly, if approved.
Back To Reality
As we closed out last year we highlighted three key things for investors in the municipal CEF sector to consider. First, was the fact that muni CEF discounts were trading at unusually tight levels, leaving little margin of safety for investors.
Specifically, we wrote:
CEFs tend to see periodic bouts of discount widening on the order of 5-10% which can be quite painful for investors. It is also worth noting that current discount valuation is fairly elevated and the next 5% move in discounts is much more likely to be lower (i.e., wider) than higher (i.e., tighter).
Since then, we have seen the average sector discount widen about 5% – bringing tax-exempt discounts to a relatively attractive level.
Systematic Income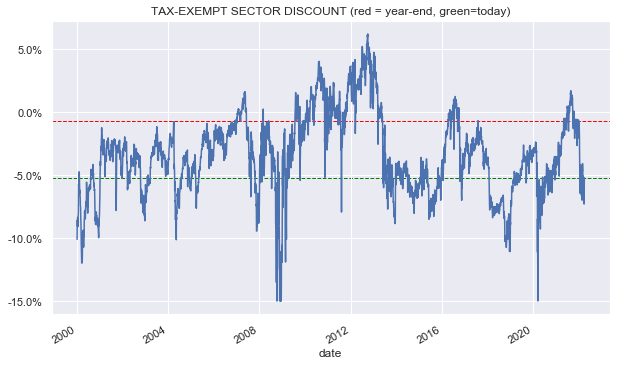
Second, we highlighted the basic fact that overall municipal yields were very low (a result of both low Treasury yields and expensive muni valuations) and longer-term yields were unlikely to keep falling at the same pace as they did over the previous decade. This combination meant that future muni returns, particularly in investment-grade bonds, were likely to disappoint investors.
Specifically, we wrote:
In short, the returns over the next 5 years, at least for the high-quality muni CEF space, are much more likely to be closer to 1% than they are to be closer to the 6% per annum that we saw over the last 5 years.
The municipal market yield picture and valuation looks much more sensible now. Municipal yields have moved off their historic lows as the following chart shows.
S&P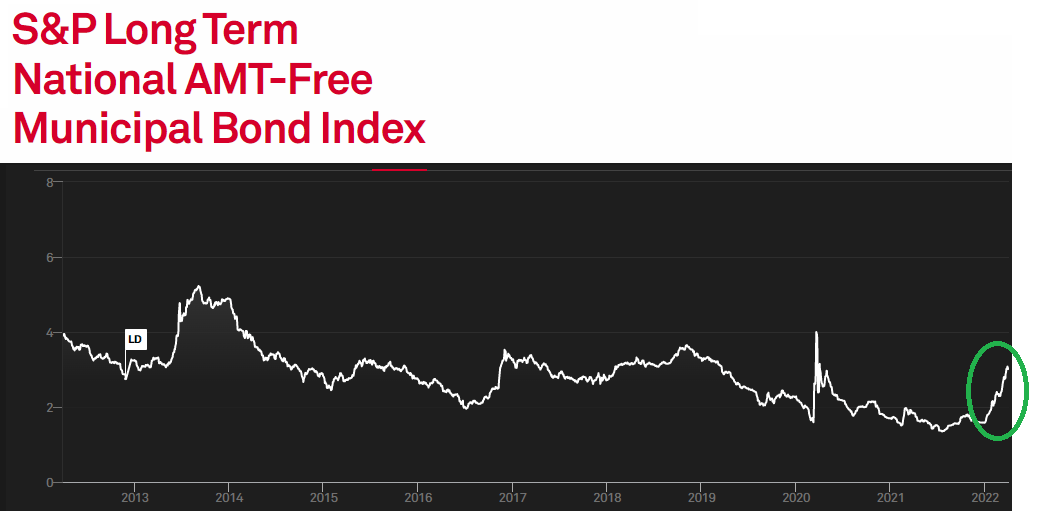
And valuations relative to Treasuries have improved significantly as the following chart and table show.
AB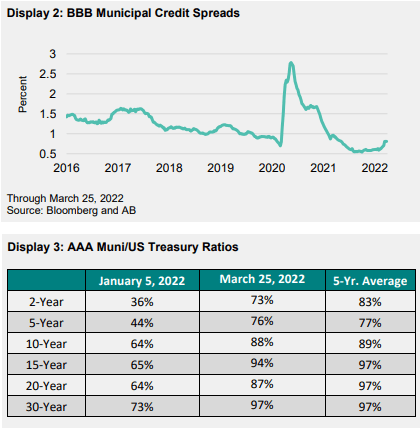
The reversion in yields and valuation has generated a return of about -10% for the sector in total NAV terms over Q1. And while we don’t expect the same negative over the coming quarters, this hole will take time to cover with distributions – something that could, very well, take a few years to get investors back to flat.
Third, last year we worried that the coming rise in short-term rates was going to reduce municipal CEF net income due to higher leverage costs and would likely lead to distribution cuts.
Specifically, we wrote:
It also means that investors should be prepared for municipal fund distribution cuts, some of which are likely to occur preemptively – perhaps as soon as the Fed begins its hiking cycle which could happen as early as March.
From recent announcements it certainly looks like sector distribution cuts have finally arrived. April announcements have seen 7 Invesco municipal funds and a dozen Nuveen funds make cuts in their distributions. These are not the only houses with cuts to their funds – AllianceBernstein and Eaton Vance have made a number of cuts as well – but they were the most noticeable.
A quick look across BlackRock, Nuveen, Eaton Vance and Invesco funds, which cover more than half the tax-exempt space, shows the following trend (negative numbers mean net cuts; a positive number would show net hikes).
Systematic Income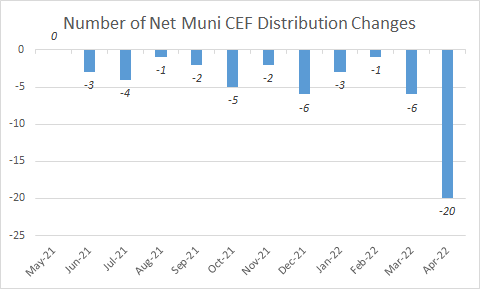
Although the word “wave” might be overstating it, we do expect a steady drip of above-average monthly distribution cuts over the coming months.
Thinking About Positioning
The key question for investors is what to do with municipal allocations right now. Our general approach to income allocation is to respond to valuation which means acting counter-cyclically. Specifically, as the valuation on a particular type of assets becomes expensive, we would look to reduce our allocation to that asset, all else equal and vice-versa.
What this means is that the ideal situation for income investors is to now be in position to deploy some dry powder to tax-exempt CEFs given their much more attractive valuation. This dry powder would be sourced from a previous rotation away from the sector into more resilient / lower-duration assets, whether term or unleveraged municipal CEFs or open-end funds or even lower-beta taxable securities such as preferreds.
Obviously, not all investors are in this favorable position as many likely maintained their allocations through the recent drawdown. There are different ways to run portfolios and maintaining allocations through-the-cycle is not necessarily wrong.
However, an income investment style that is unlikely to be successful is one that is pro-cyclical or momentum-based. For example, many income investors feel tempted to buy the stuff that has rallied the most and sell the stuff that has dropped the most. While this can work in a few individual cases (particularly in idiosyncratic assets that eventually go to zero), it doesn’t tend to work very well on an asset classes level and / or over the longer term for the simple reason that income markets are pretty mean-reverting.
This means expensive assets (e.g. tax-exempt bonds in this case) get back to fair-value or become cheap and cheap assets will eventually become expensive again. There is practically an entire field in finance devoted to showing how individual investors underperform the broader market and buying low / selling high is one reason for this.
Overall, there are three key allocation questions for investors to consider – how much of an allocation to maintain 1) between drier-powder tax-exempt holdings such as open-end funds / term CEFs and perpetual CEFs, 2) between high-yield and investment-grade tax-exempt CEFs and 3) between tax-exempt and taxable allocations.
There are no hard-and-fast rules that are appropriate to all investors and we have made our own choices in our suite of Income Portfolios. We have recently reduced our allocation to drier-powder muni securities when municipal yields moved higher and CEF discounts moved out to high single-digit and double-digit levels in a number of funds, taking advantage of a more attractive environment.
We also currently carry a significant allocation to tax-exempt funds with high-yield / unrated bonds which has a number of benefits. First, and most obviously, they tend to carry higher yields (without a commensurate rise in risk, at least in historic terms) than investment grade counterparts as the following chart shows where the blue line is the yield of the S&P Municipal Bond High Yield ex Puerto Rico Index and the orange line is the S&P broader long-term S&P Municipal Index.
Systematic Income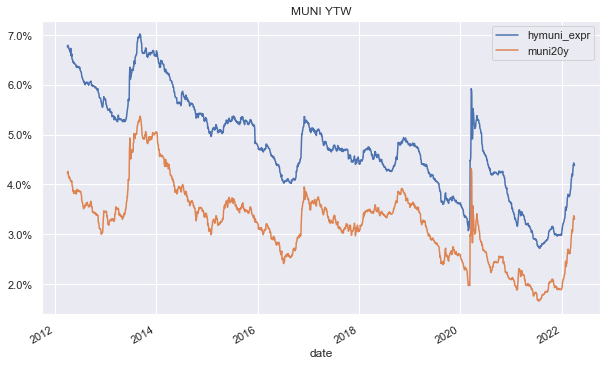
We are often asked what is the point of holding funds with high-yield muni bonds since these funds have pretty much the same yields as those funds that hold primarily investment-grade bonds. The key point here is that CEF distribution rates and net investment income figures don’t reflect true underlying yields because they only show current yields (i.e. coupon / price) and don’t reflect the correct yield-to-call or yield-to-maturity.
For example, the table below shows that looking at a current yield we see only a 0.23% differential between “average” long-term investment-grade and high-yield muni bonds whereas in reality their yields-to-call are 1.07% apart.
Systematic Income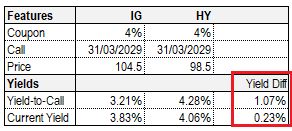
The second advantage of high-yield bonds is that they tend to carry a lower duration profile than investment-grade bonds (and an even lower empirical duration profile due to their ability to offset rising Treasury yields with wider credit spreads).
The third advantage of high-yield bonds is that they will create a smaller NAV drag on the CEF over time (because of their higher yields). This will put less pressure on the fund’s leverage making the fund less liable to a steady deleveraging and larger distribution cuts.
At the moment high-yield munis don’t look particularly cheap to us given the yield differential to investment-grade bonds is near historic lows.
Systematic Income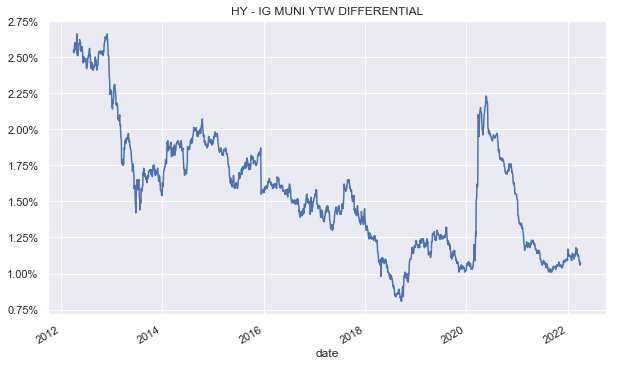
The same is true if we look at the two sub-sectors in terms of yield ratios.
Systematic Income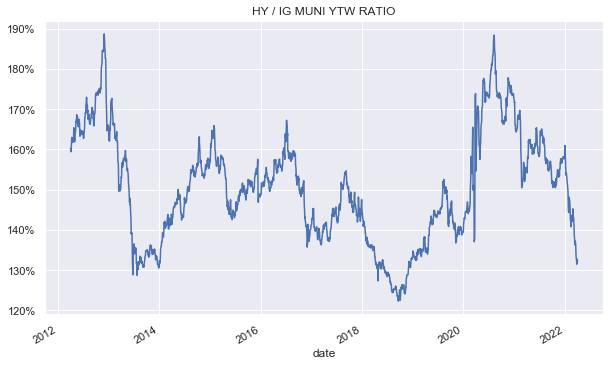
At the moment we are not making changes to our investment-grade vs. high-yield allocation stance though we might tilt to investment-grade bonds if the high-yield valuation compresses further.
Tactically, we would also be cautious going all-in on the tax-exempt sector for two reasons. First, it makes sense to see some consolidation in Treasury yields from the recent sharp rise to avoid catching a falling knife. And two, the continued wave of distribution cuts in the sector will likely provide even better discount valuation opportunities since discounts tend to widen on cuts as disappointed pro-cyclical investors flee. In short, we would add on dips rather than chase rallies.
Overall, we like having a barbell portfolio that contains both longer-duration, higher-quality assets (such as tax-exempt munis) as well as lower-duration floating-rate higher-yielding credit assets. Absent a crystal ball of where interest rates, credit spreads and the broader economy will go in the medium term, we think it makes sense to hold exposure to assets that can perform in different market environments.
Current Tax-Exempt Ideas
It should be said that it is a particularly fast-moving market in the tax-exempt CEF sector. At the moment the following funds look attractive.
The Eaton Vance Municipal Income Trust (EVN) is trading at a 8.2% discount and a 4.9% current yield. In terms of allocation, its top sectors are GO bonds, Transportation and Hospital sectors. EVN has a typical credit-quality profile for the sector at around 80% in investment-grade bonds. The fund has a relatively modest duration for the sector of 7.7.
EVN has outperformed the sector over the last 3 and 5 years in total NAV terms.
Systematic Income CEF Tool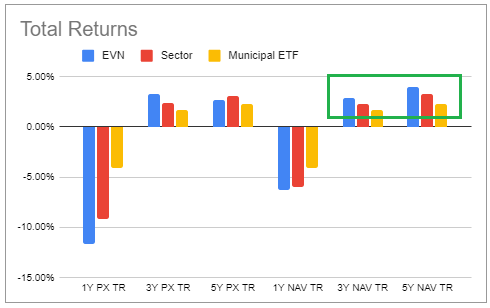
Its current yield is right at the sector average, its covered yield (i.e. net investment income on price) is well above the sector average, giving it some margin of safety.
Systematic Income CEF Tool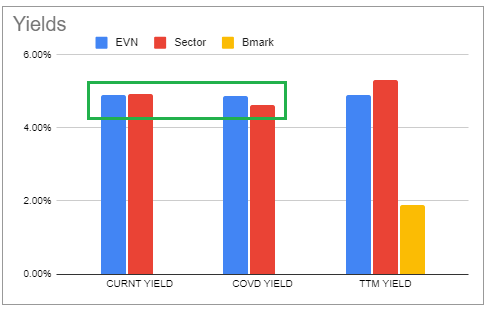
The fund has tended to trade at a discount wider to the sector average and it is 2.6% wider of the average as of this writing.
Systematic Income CEF Tool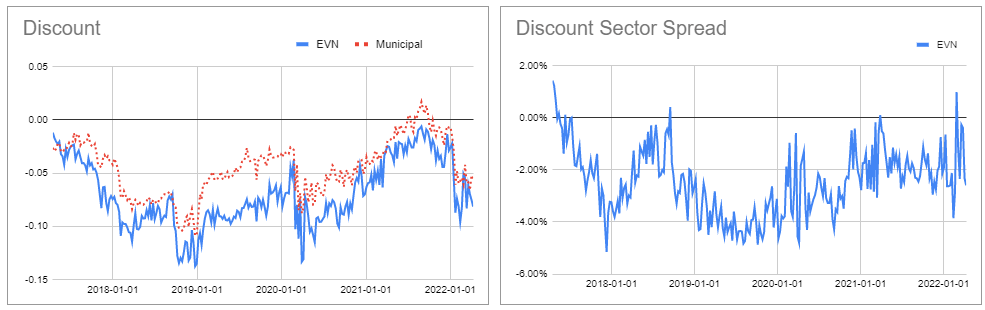
Coverage has been stable over the last few months and UNII is positive.
Systematic Income CEF Tool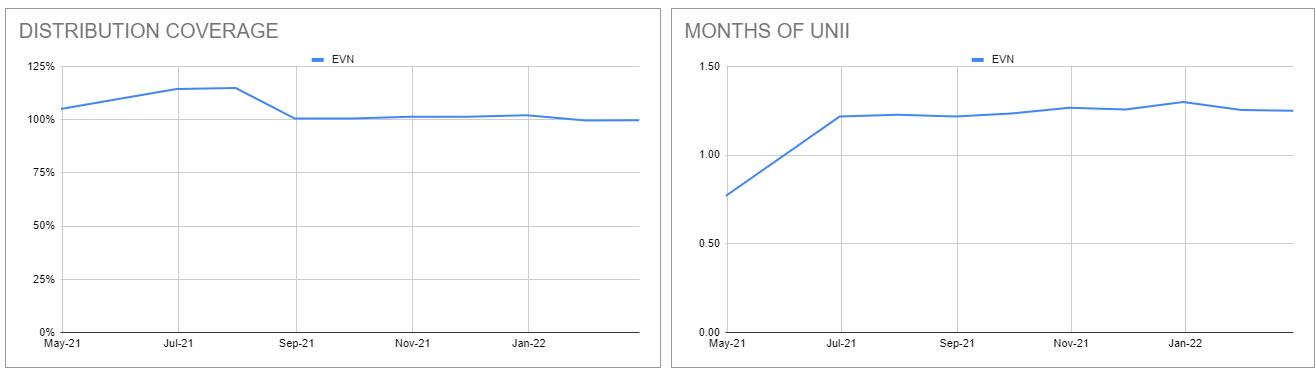
A fund with a higher high-yield / unrated bond allocation is the BNY Mellon Strategic Municipals (LEO), trading at a 8.2% discount and a 5% current yield. The fund has distribution coverage of 111%, going by its last shareholder report. About 40% of the fund is allocated to unrated or sub investment-grade bonds with top sectors being Education, Healthcare and Transportation.
The fund’s current and covered yields are both above the sector average.
Systematic Income CEF Tool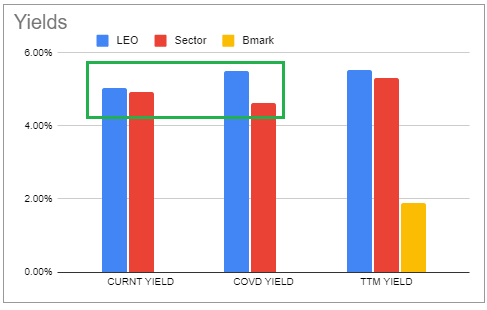
The fund has also bested the sector average over various time horizons in total NAV terms.
The fund currently trades at a discount of around 2.6% wider of the sector average discount which is fairly unusual for it as it has tended to trade at a premium historically.
Systematic Income CEF Tool
Apart from these two funds, we are also watching the MainStay MacKay DefinedTerm Municipal Opportunities Fund (MMD) which has generated exceptional historic returns (1.6% above the sector average in 5Y total NAV terms) and is trading at a 3% discount not far from the sector average of 5.6% which is cheap for its own history. The fund’s term structure provides a very attractive risk/reward in our view – a 3% discount tightening to zero in 2024 (in case of termination) or a 2.6% widening to the sector average. The 2.6% downside is very unlikely in our view even if the fund turns into a perpetual one without giving shareholders an exit, given its strong historic performance.
We are also watching the Nuveen Municipal Credit Income Fund (NZF) which has occasionally popped out to a high single-digit discount at which point it would be very attractive. The fund has about 40% in high-yield / unrated bonds and has very strong historic returns (1.8% above the sector average in 5Y total NAV terms).
Be the first to comment