

Portfolio on life support? Don’t give up yet. The time for giving up was late last year. Now you might as well see it through. Povozniuk
Get ready for charts, images, and tables because they are better than words. The ratings and outlooks we highlight here come after Scott Kennedy’s weekly updates in the REIT Forum. Your continued feedback is greatly appreciated, so please leave a comment with suggestions.
Want to hear something amazing?
I’m actually turning bullish on some of the mortgage REITs we were constantly bearish on.
Remember how I kept trashing Annaly Capital Management (NLY) as being terribly overvalued for a stupid premium to book value? How about all the shots at Two Harbors (TWO) for trading right around book value?
I got bearish on AGNC Investment Corp. (AGNC) a time or two as well.
Those ratings have turned around. I’m not saying NLY’s 21% dividend yield is safe. However, shares are trading around a 15% discount to our estimate for the current book value. Scott Kennedy recently posted his calculations. That one is available to anyone with Seeking Alpha Premium or with free articles left. Obviously, it is also available to all REIT Forum members.
That’s vastly better than trading at a 7% premium. But it wasn’t just the share price falling. The spreads between MBS and Treasuries continued to increase. That reduced book value, but the price just plunged.
Seeking Alpha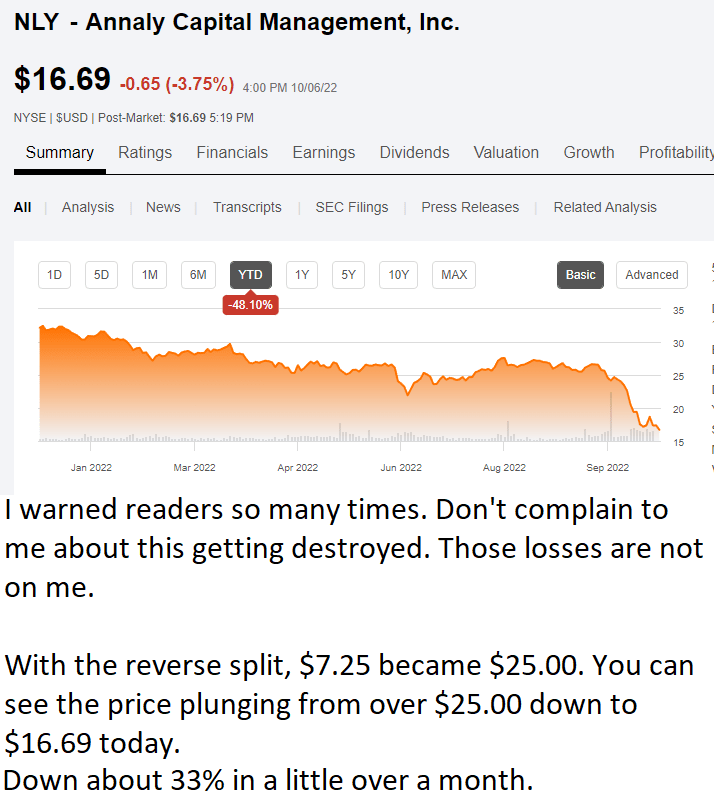
I said the price was too high. The price was too high. Shocker. What happened? The price plunged. That can happen to any stock. It happens even more when the price started too high.
However, the magnitude of the decline in the share price is enough to warrant an upgrade. There’s still plenty of risk, but now the spreads between MBS and hedges are far more attractive. Getting to these spreads involved a big drop in book value. How could you protect yourself from that? Don’t buy a mortgage REIT at a premium (especially a big premium) to book value. Brilliant!
Let’s recap:
We’ve switched over to bullish on NLY, AGNC, and TWO. We’re also bullish on Dynex Capital (DX), but that was the case earlier.
Preferred Shares
Remember when my articles were mostly pounding out the idea that preferred shares were safer?
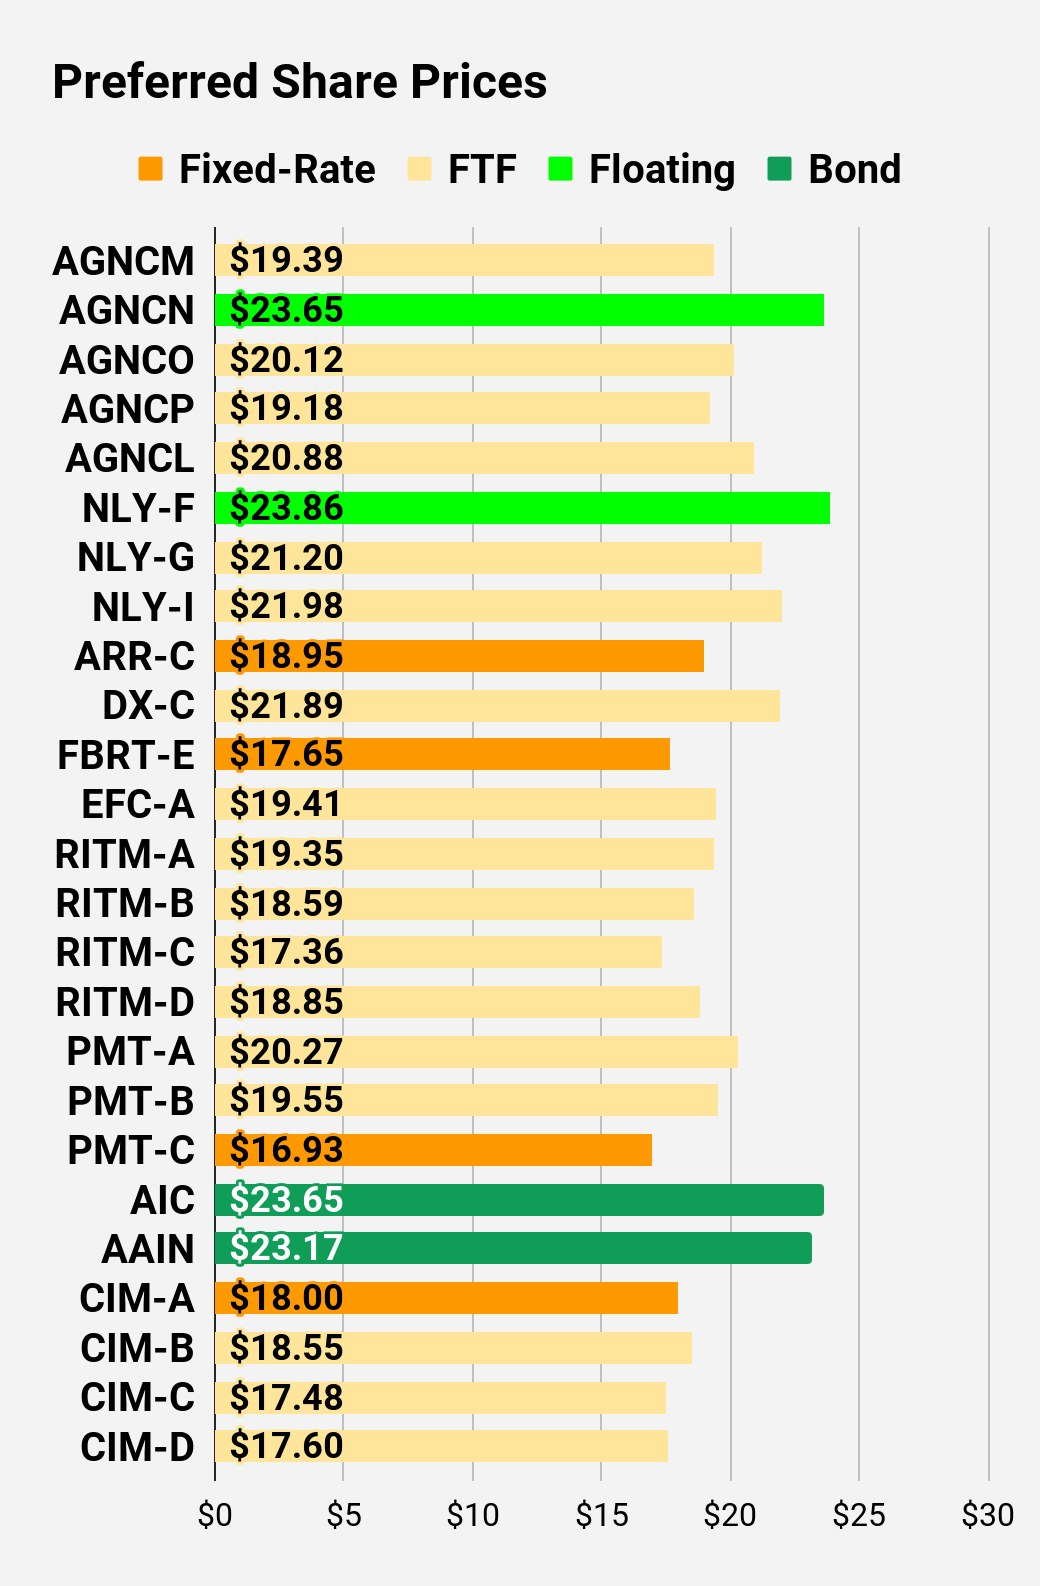
NLY-F (NLY.PF) trades at $23.86. Below call value? Sure. Way below call value? No. Is NLY-F facing a dividend cut? No. Is it a great deal today? Depends on how we measure it. If we compare NLY-F to NLY-I (NLY.PI), AGNCM (AGNCM), AGNCO (AGNCO), AGNCP (AGNCP), or AGNCL (AGNCL), then NLY-F isn’t so amazing.
NLY is down around 48% year-to-date. Most preferred shares fell by less than half of that.
While NLY and most other mortgage REITs saw a huge beating on their book value, guess what happened to their preferred share book value? It didn’t change. It doesn’t change. That’s how the preferred shares work.
Hate book value? Alright, let’s try this image:
Seeking Alpha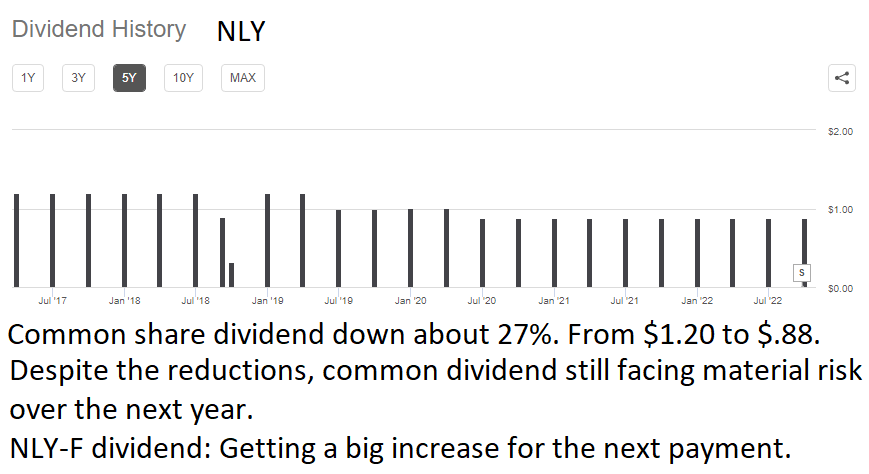
Common dividend down. The preferred dividend is ready to increase because NLY-F was a “fixed-to-floating” share and the “floating” part just started.
Buy and Hold Investors
Over and over I tell investors that the common shares are for trading against people who don’t know what they are buying or selling. Yet investors often proclaim that they are smarter because they focus on the income.
Well, which strategy worked better for investors in NLY? Was it common shares or preferred shares? We can look at how much an investor needed to invest on any prior day (with dividend reinvestment) to reach $100k today. Let’s have a look.
The REIT Forum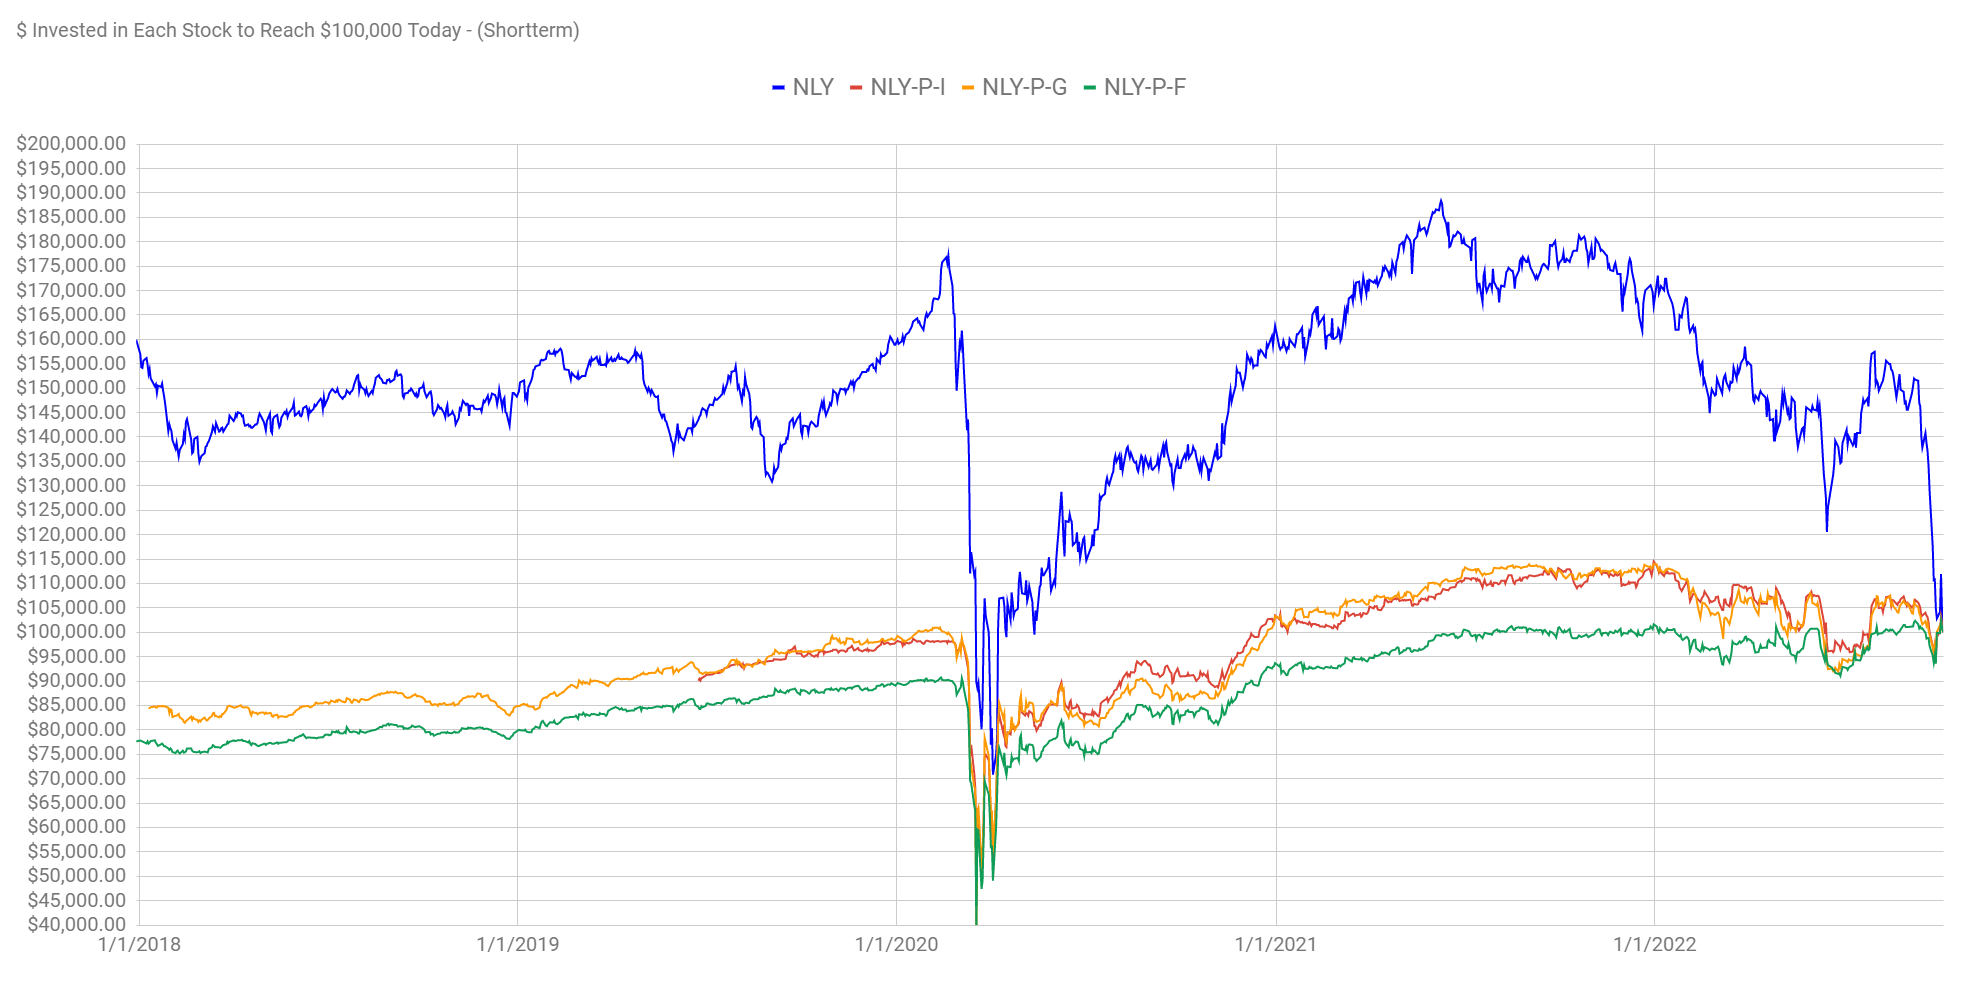
How about that? The preferred shares only win based on every day in recorded history. However, perhaps in unrecorded history such as an alternate timeline, events might be different.
Of course, the risk/reward has improved significantly for NLY. For investors willing to trade shares instead of saying they will ignore the price (and scream bloody murder about the dividend cuts), there’s a nice opportunity for a bounce here.
Does that mean today is the bottom? No. It could still fall further. So what’s special about today? The risk/reward has shifted far enough that the expected value for investing is much better. What we’re doing is essentially the equivalent of counting cards. It’s perfectly legal. We don’t need or have any insider information. We simply understand how to model for each card that has been played much better than the other guy. That’s it. Nice and simple. We did our math homework.
What About Yield?
Investors who bought NLY 5 years ago would have a cost basis of around $48.50 per share. The yield they’re getting on that initial cost is now only 7.25%. I’m not one of the “yield on cost” guys, but I need to reach them. Income investors need to recognize the impact of dividend reductions.
Even if the current dividend for NLY is maintained, investors who bought $10,000 of NLY 5 years ago are getting a smaller amount of dividends for their investment than investors who bought $10,000 of NLY-F at the same time.
NLY-F share price is down about 5% to 8% over that period. NLY share price is down over 65% for that period.
Now that NLY is no longer overpriced, those same investors are going to yell:
- NLY is garbage!
- I’m getting out when it gets back to my cost basis!
Stop telling me it is all about yield. That’s why investors get wrecked. They go into this for the yield, close their eyes, and start yelling when someone corrects them.
Here you go. NLY is finally trading at a bargain price. Now which of the bagholders are going to double down with an actual bargain (not a steal, but a bargain) and which ones only wanted shares when they were overpriced?
Not Our Fault
Don’t blame me or Scott Kennedy if you lost money in NLY. The chart below only goes back to September 2021 and catches articles with NLY as the primary ticker (most of my articles have no primary). However, it’s still a pretty good indication:
Seeking Alpha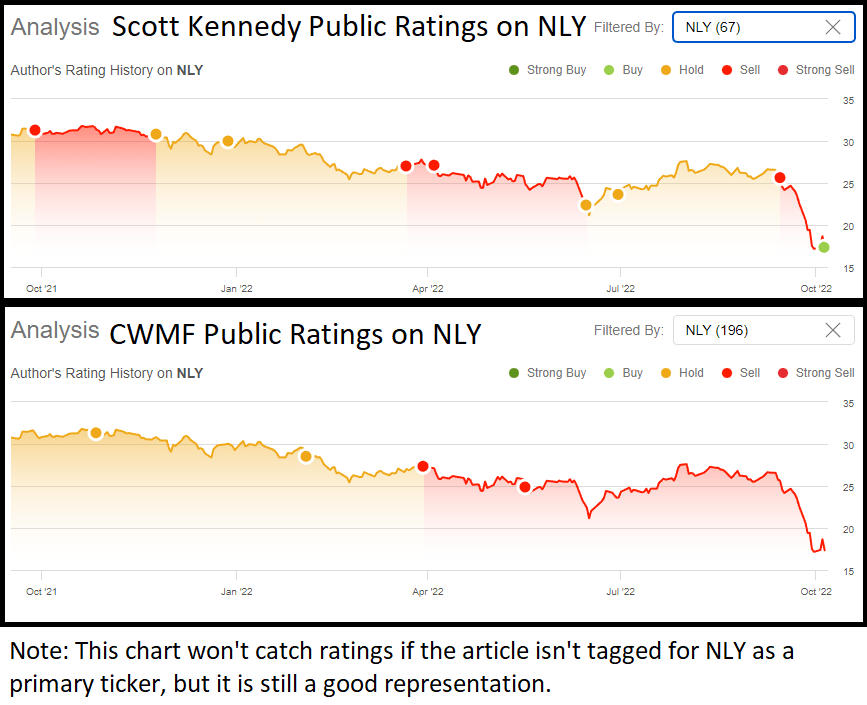
The vast majority of the decline occurred during periods when we had clearly labeled our bearish views. The chart only updates when a new article is published. I’m sharing the history for myself and for Scott since we work together to provide The REIT Forum. Just as you see Scott posting an upgrade for NLY (early this morning), you’re seeing an upgrade in my article as well.
That’s pretty good for the public article history, especially since we want to get our research to our members first. Despite the delays, that’s a solid rating history.
Best Deal?
Is NLY the best deal in the sector? No. Definitely no. However, it was time for an update for the many readers who want to hear about it. We haven’t been able to provide a bullish rating on NLY in a long time.
There are some better deals available in the common shares and there are some preferred shares that still offer an excellent yield and huge upside to call value. Several of those shares switch over to a floating rate within two years. Unless rates fall dramatically, those shares will either see a materially larger dividend or be called (or both). We aren’t expecting any of them to go to $0, but there is still a material difference in the risk level between the shares.
The rest of the charts in this article may be self-explanatory to some investors. However, if you’d like to know more about them, you’re encouraged to see our notes for the series. The part below is reproduced in each article to provide investors with easy access to the updated charts. It is my gift to readers.
Stock Table
We will close out the rest of the article with the tables and charts we provide for readers to help them track the sector for both common shares and preferred shares.
We’re including a quick table for the common shares that will be shown in our tables:
Let the images begin!
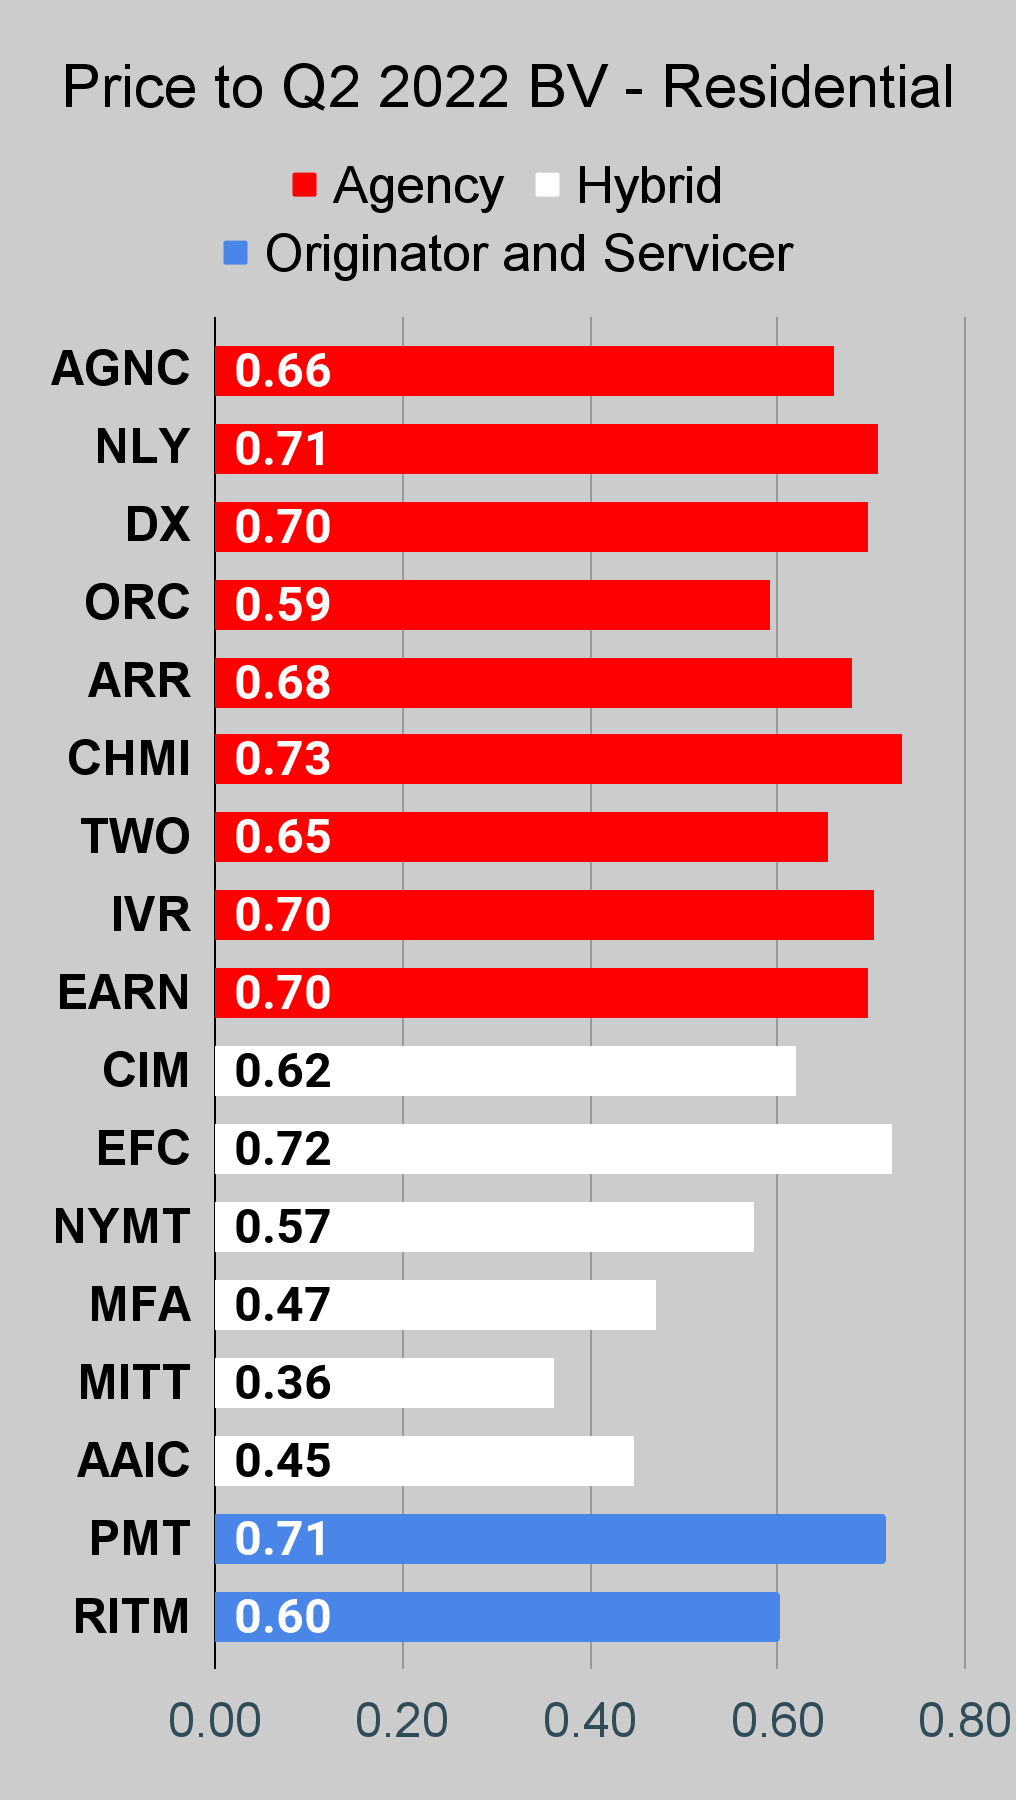
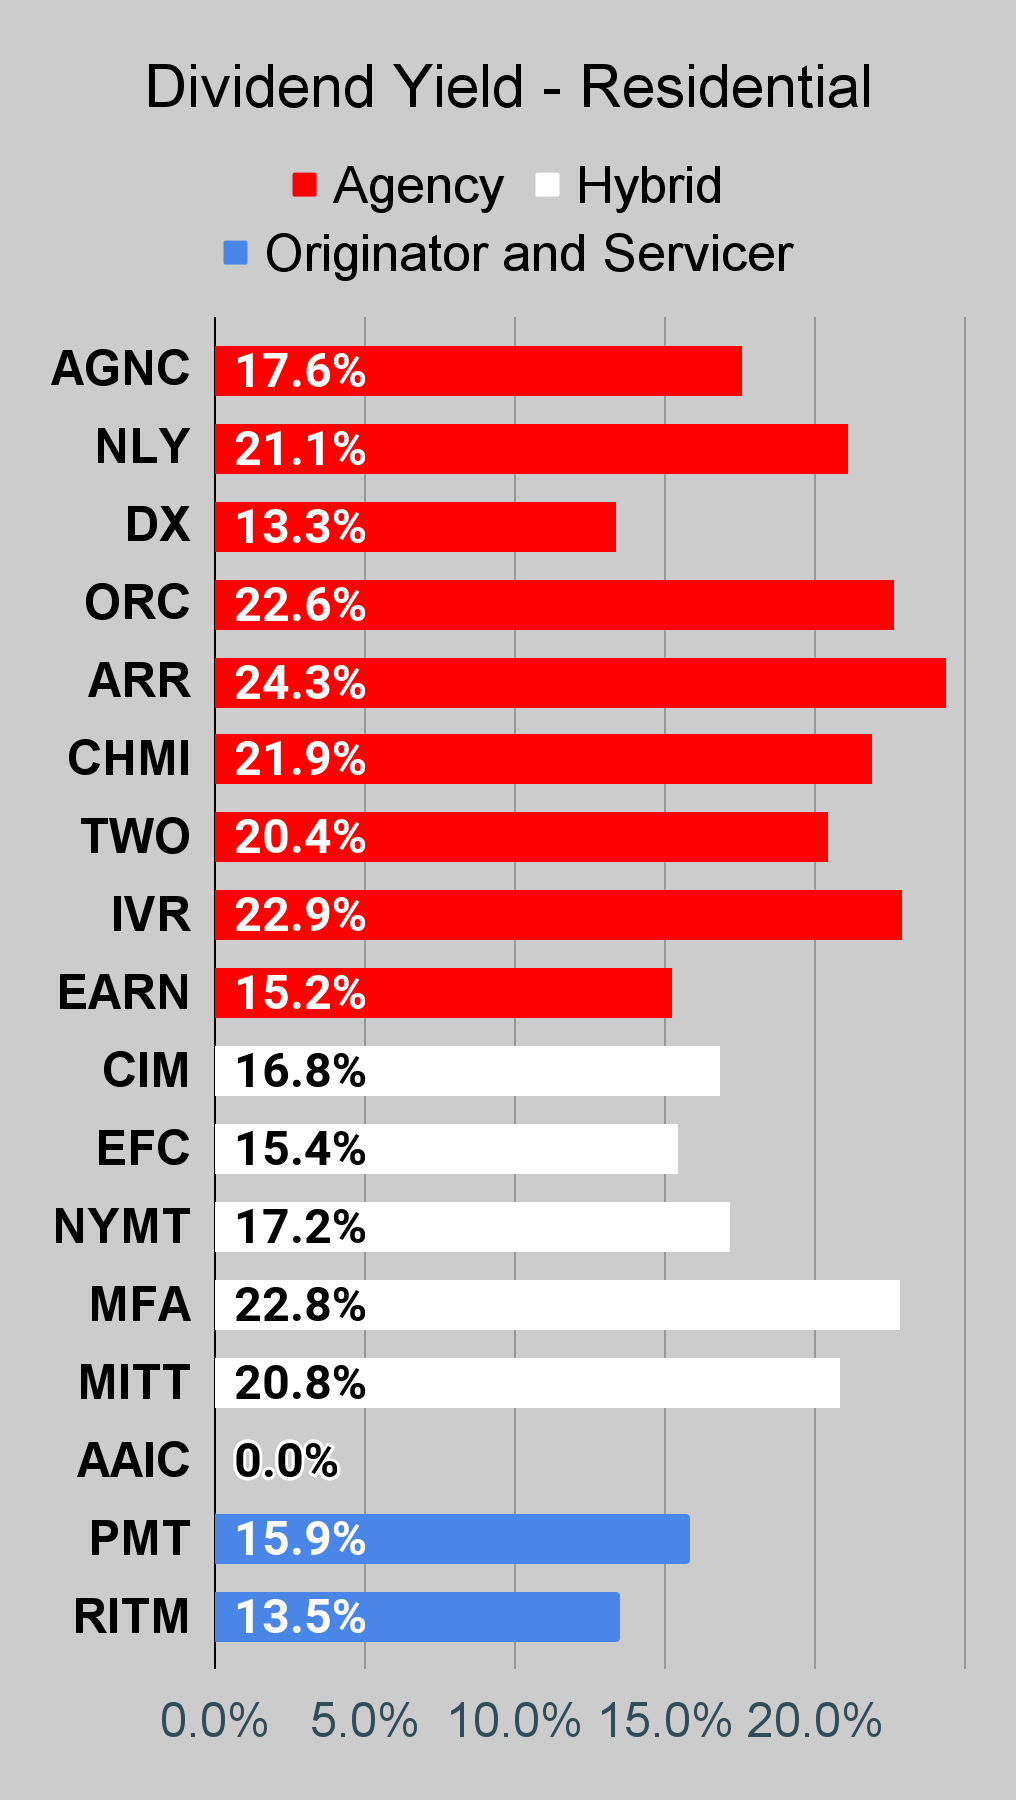
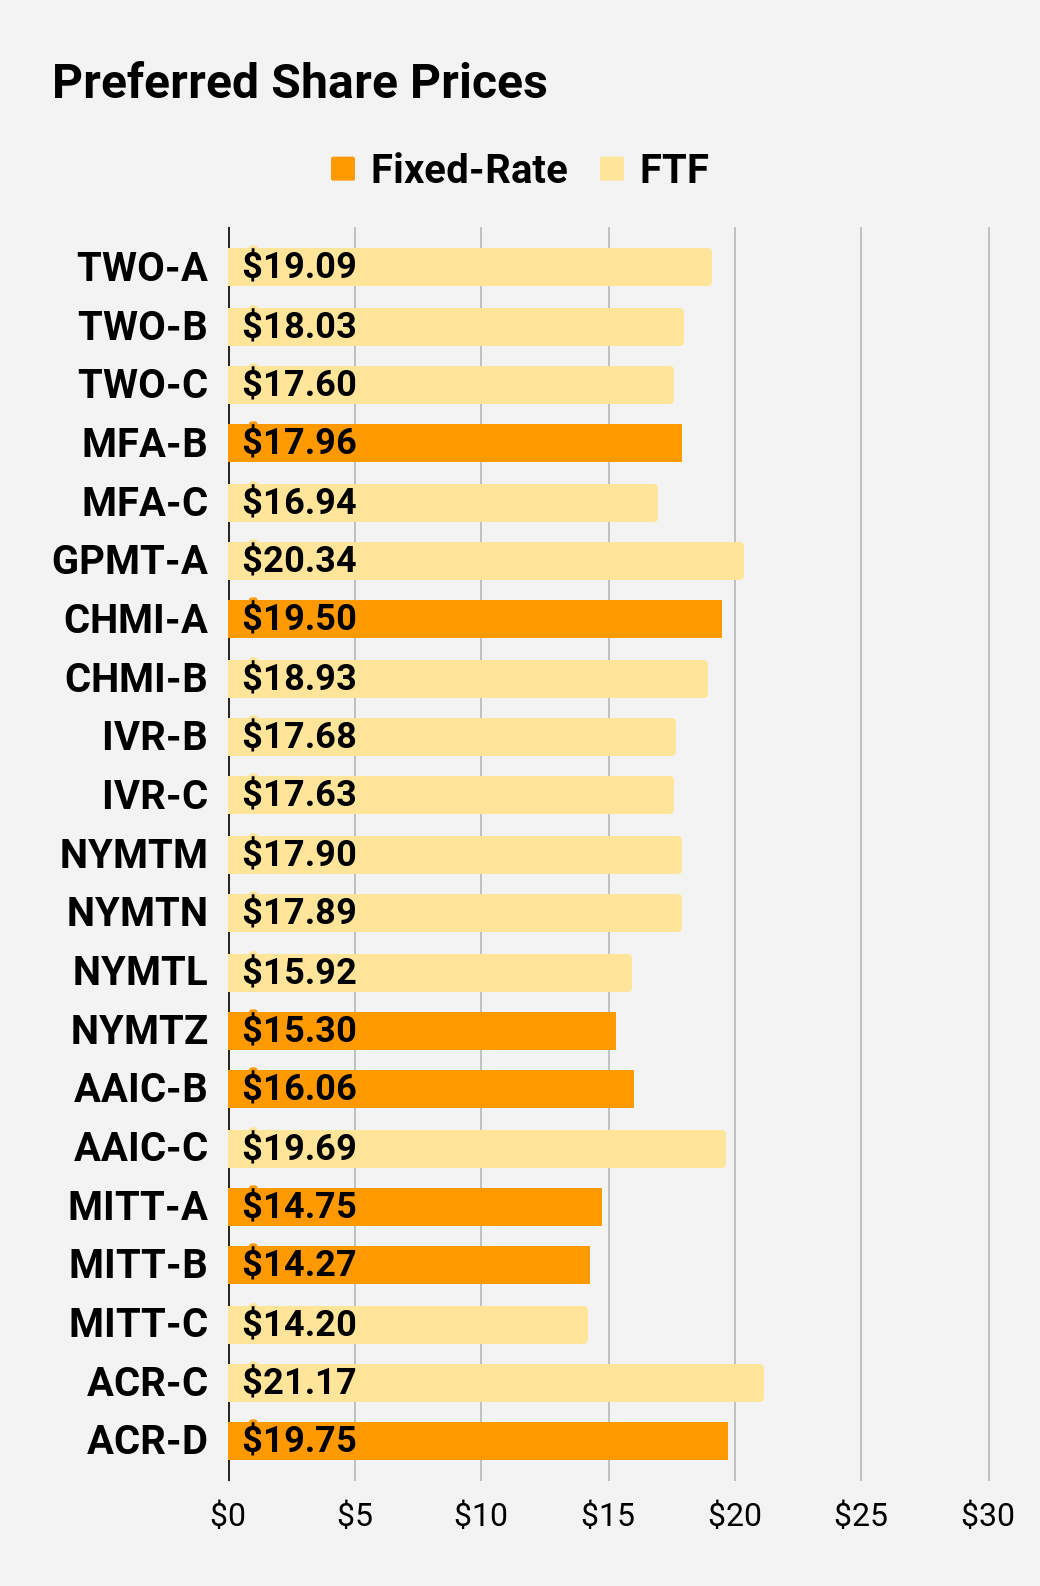
Residential Mortgage REIT Charts
Note: The chart for our public articles uses the book value per share from the latest earnings release. The current estimated book value per share is used in reaching our targets and trading decisions. It is available in our service, but those estimates are not included in the charts below. PMT and NYMT are shown with an earnings yield based on consensus estimates. However, neither REIT actually provides a quarterly “Core EPS” metric.
 The REIT Forum |
 The REIT Forum |
 The REIT Forum |
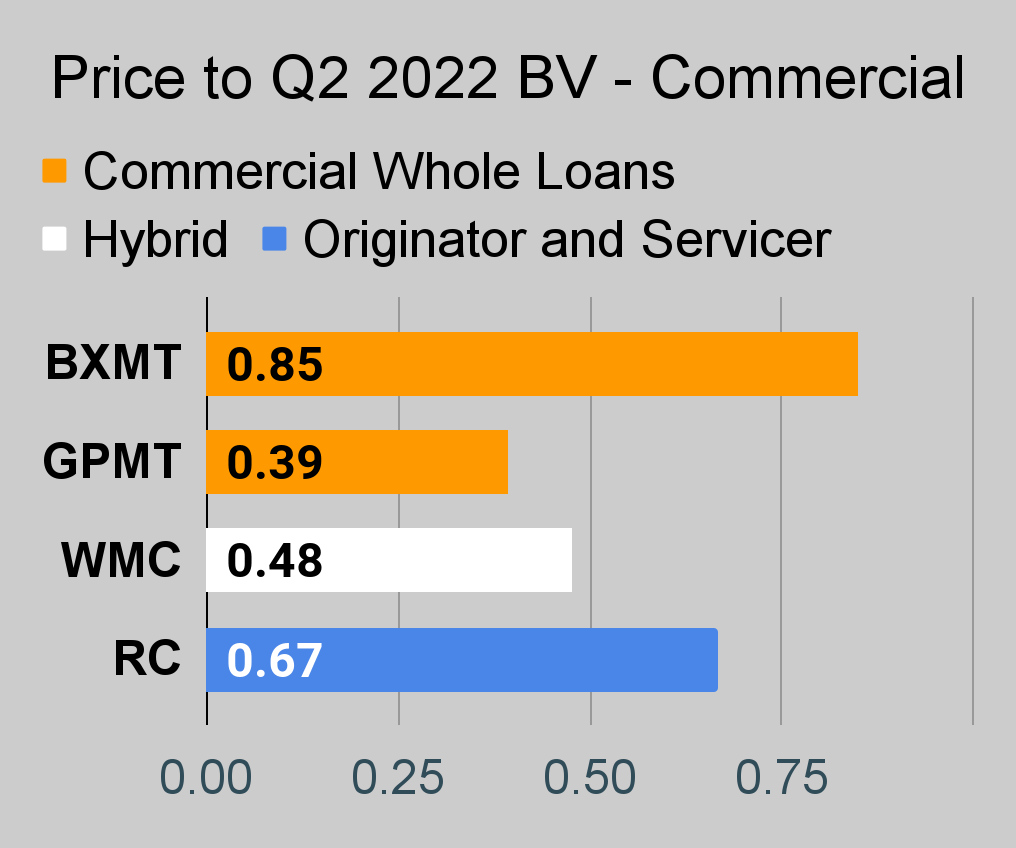
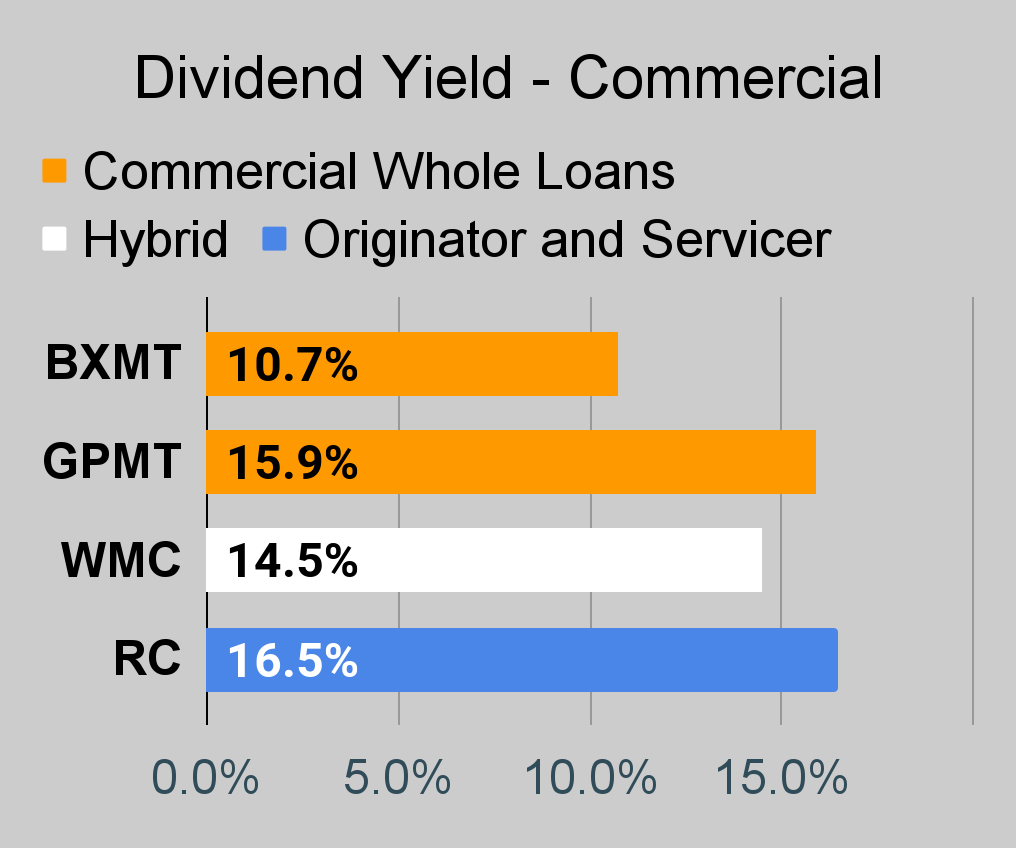
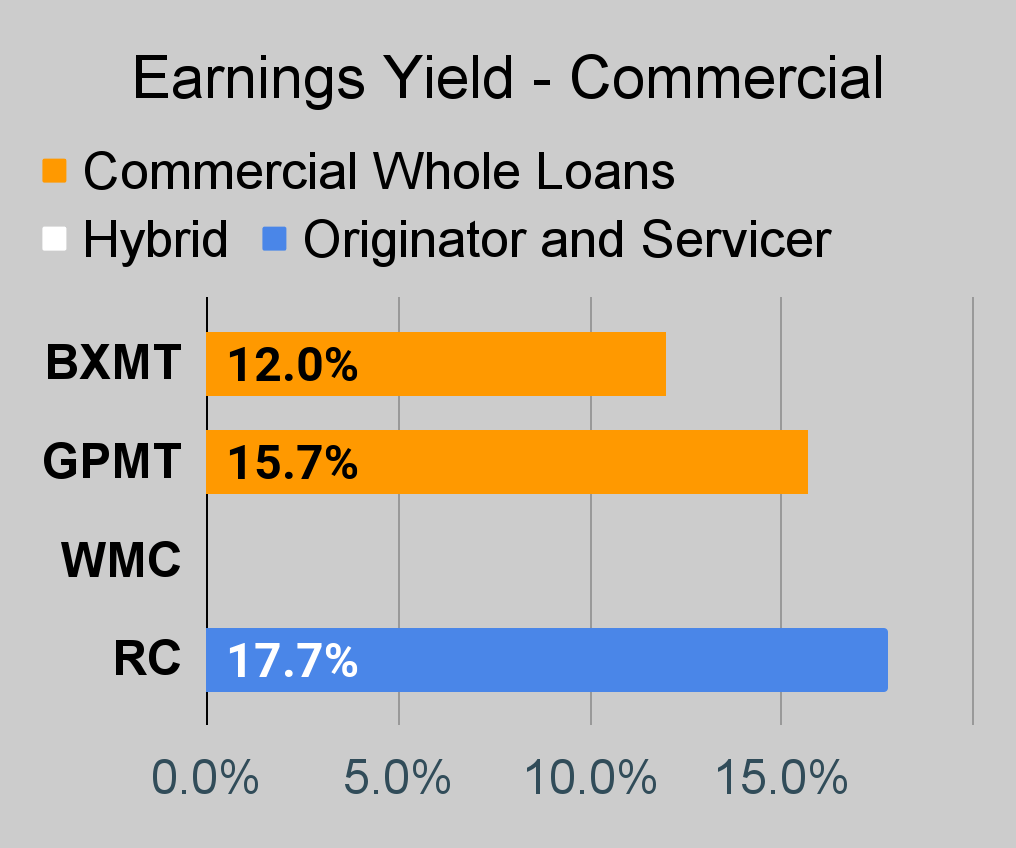
Commercial Mortgage REIT Charts
 The REIT Forum |
 The REIT Forum |
 The REIT Forum |
BDC Charts
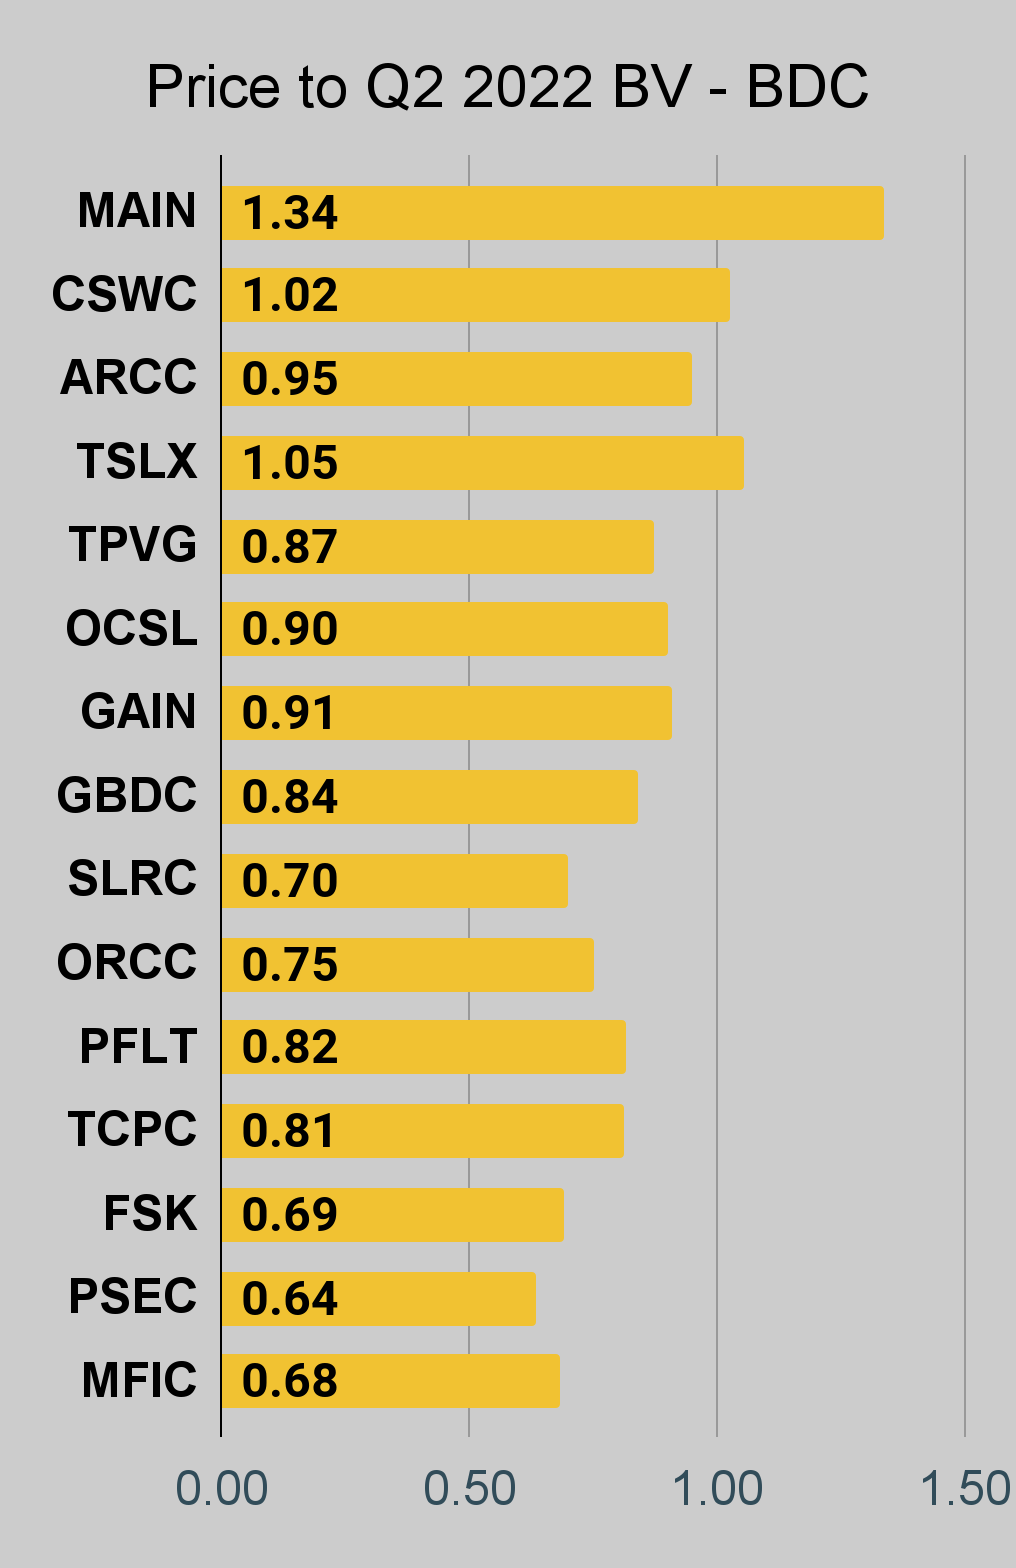 The REIT Forum |
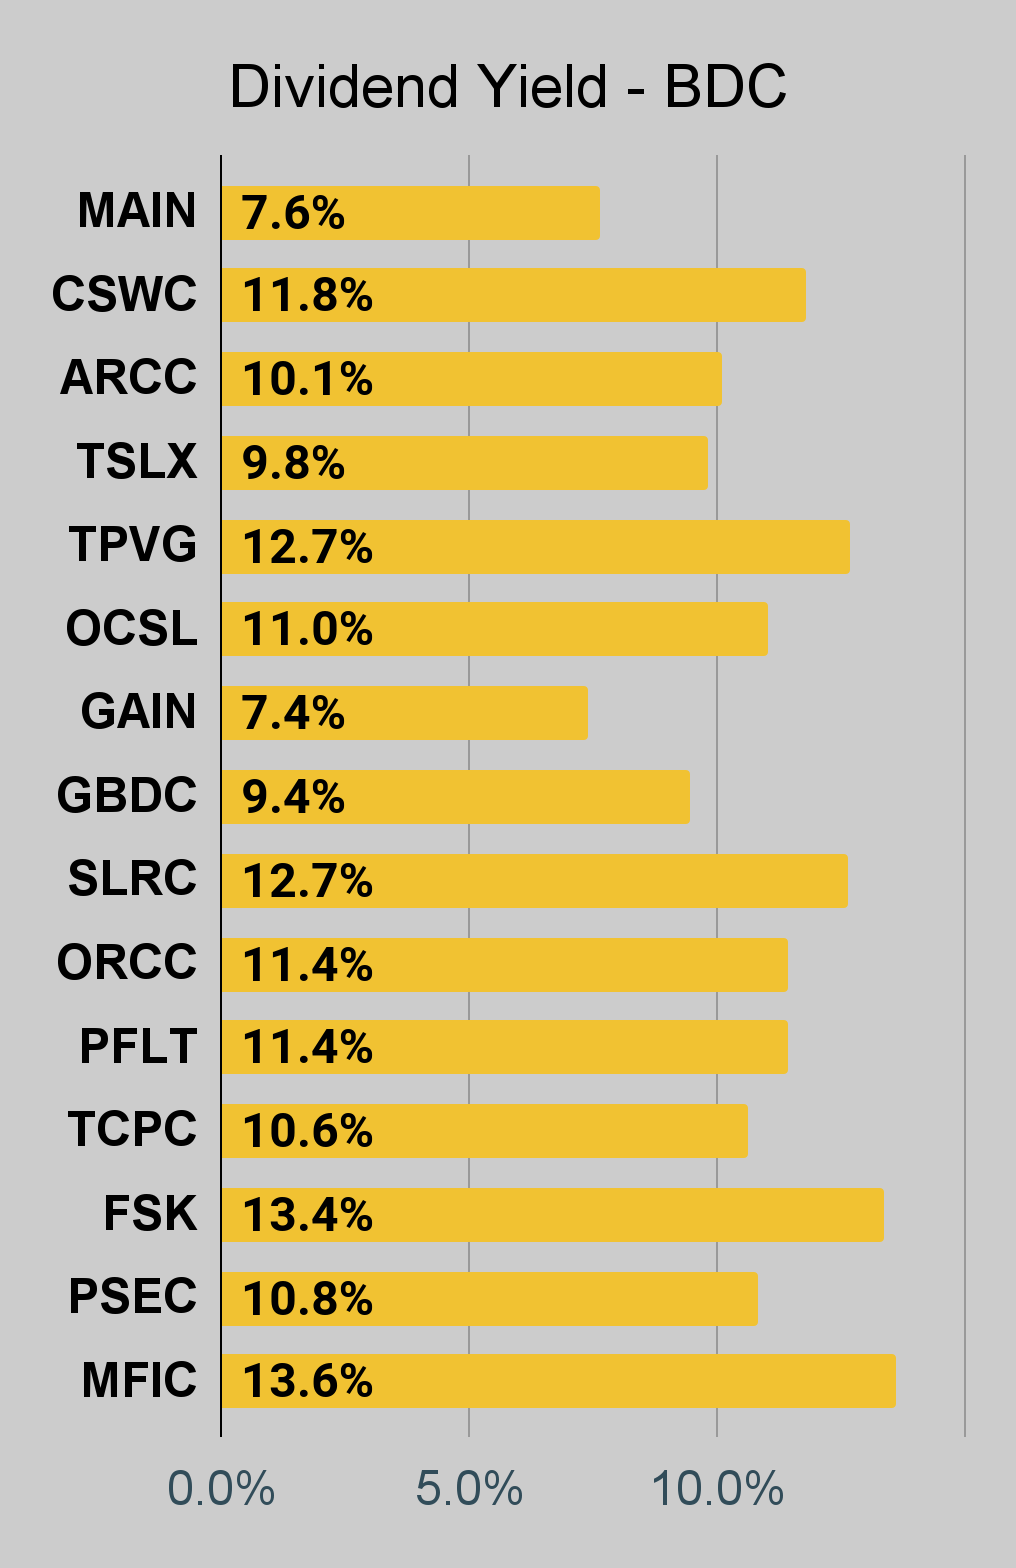 The REIT Forum |
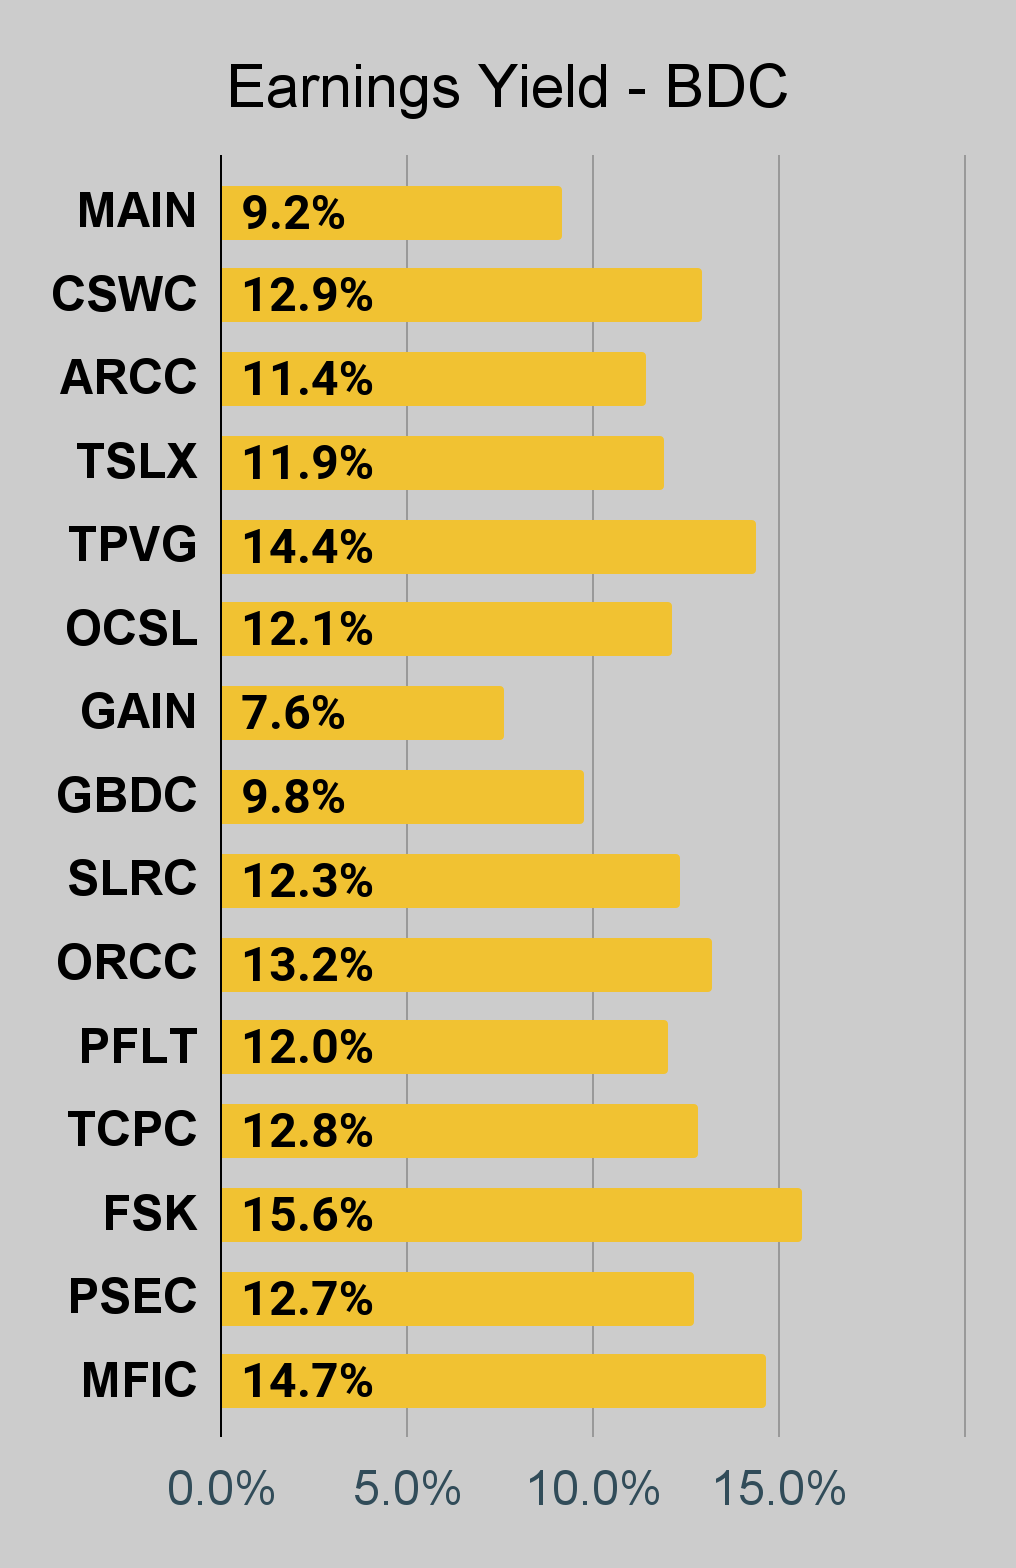 The REIT Forum |
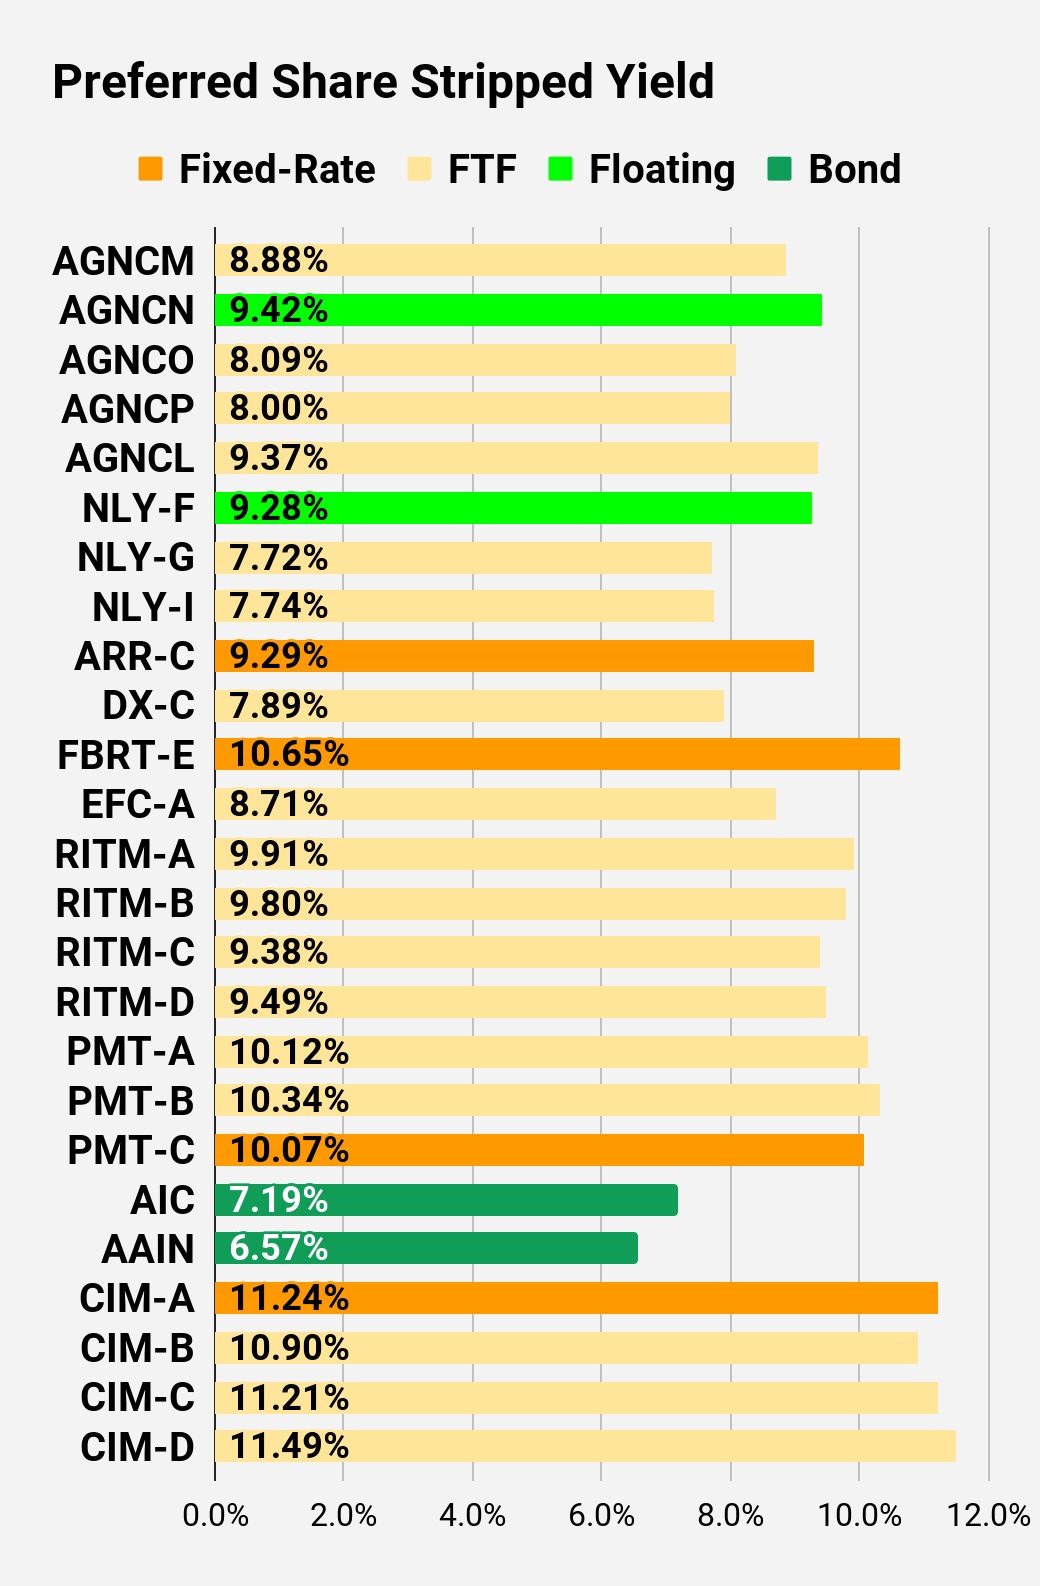
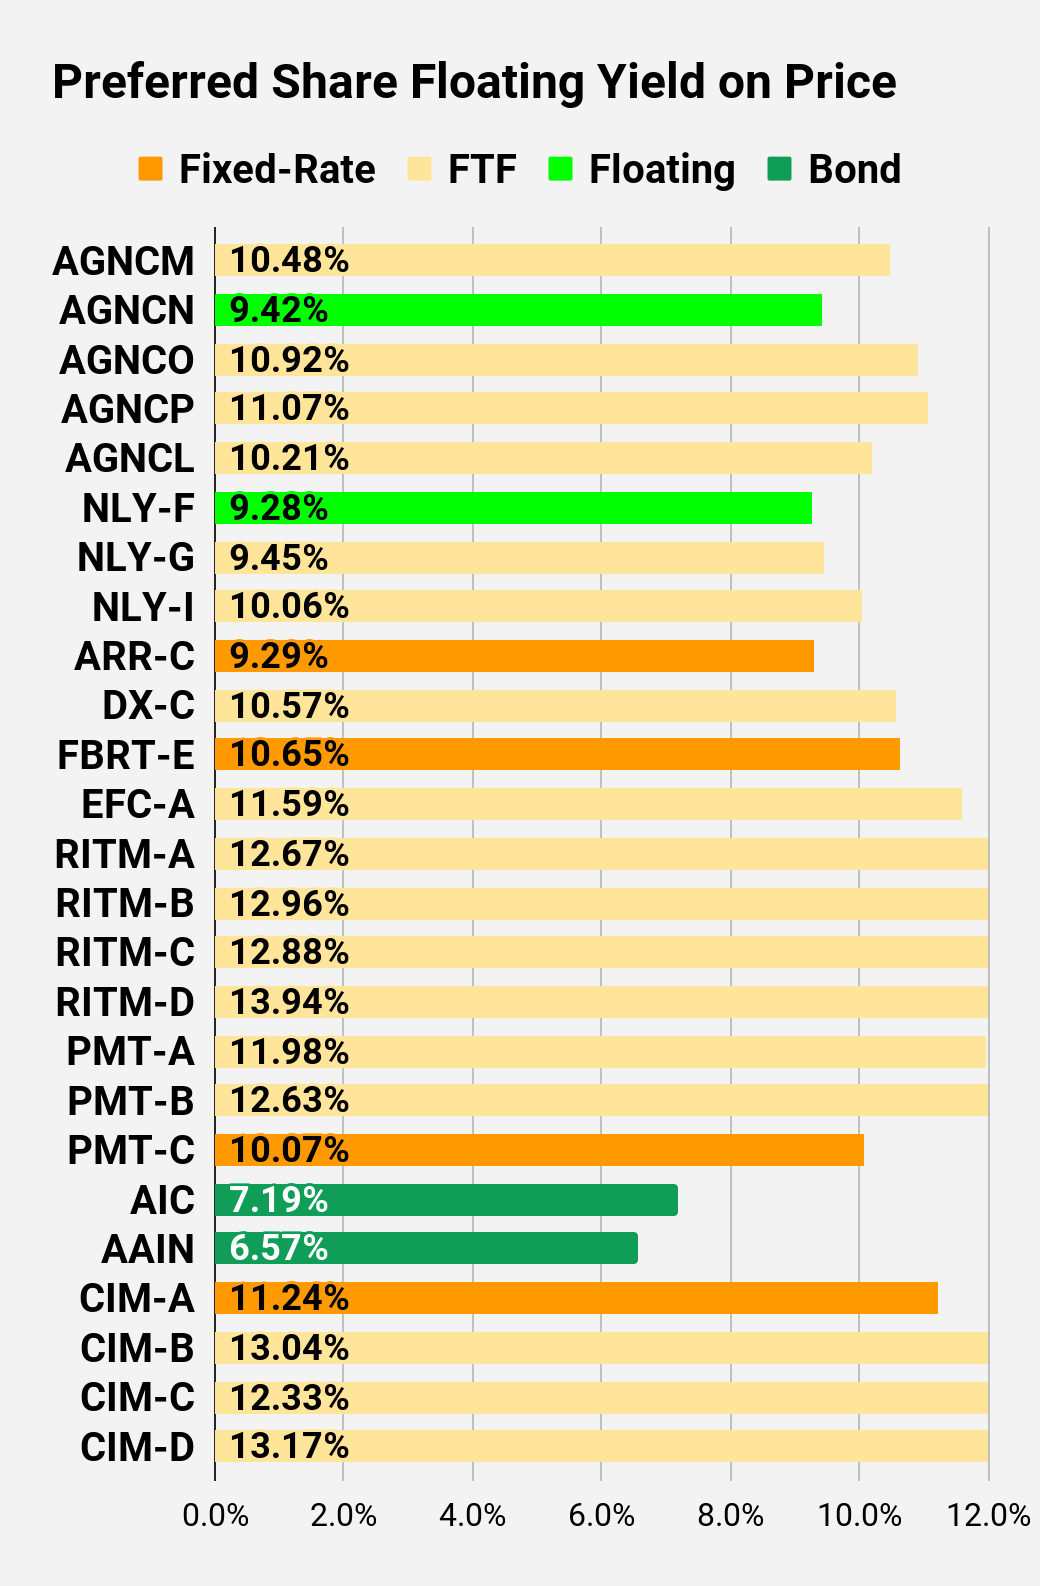
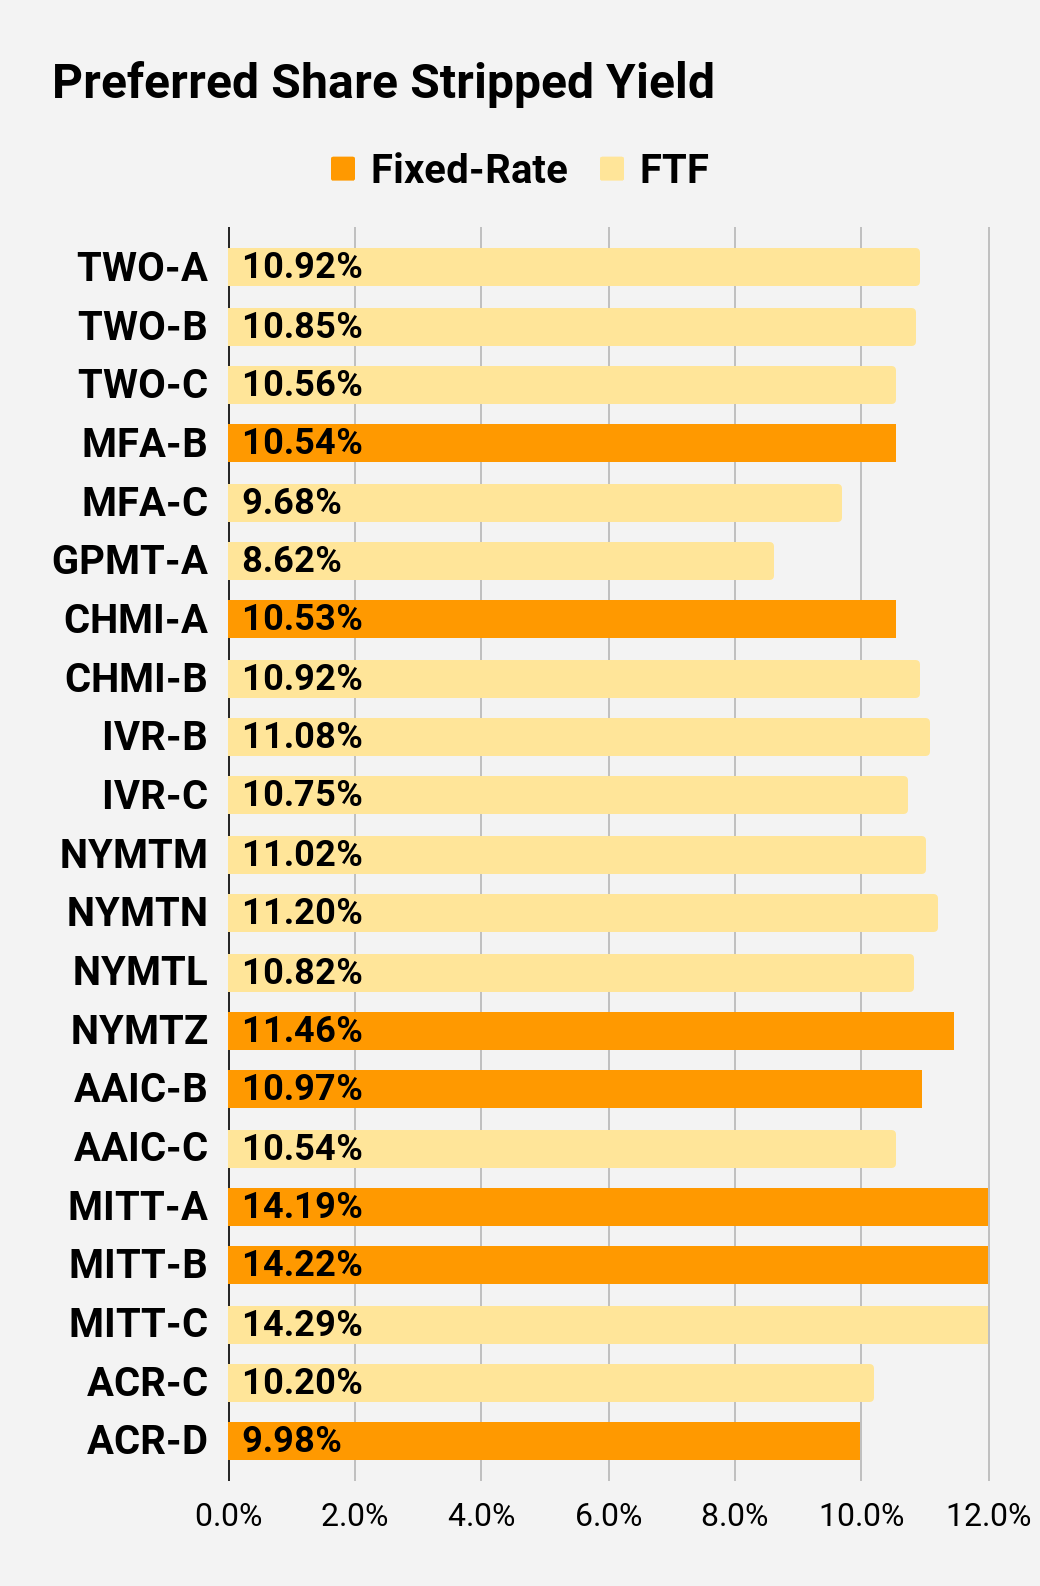
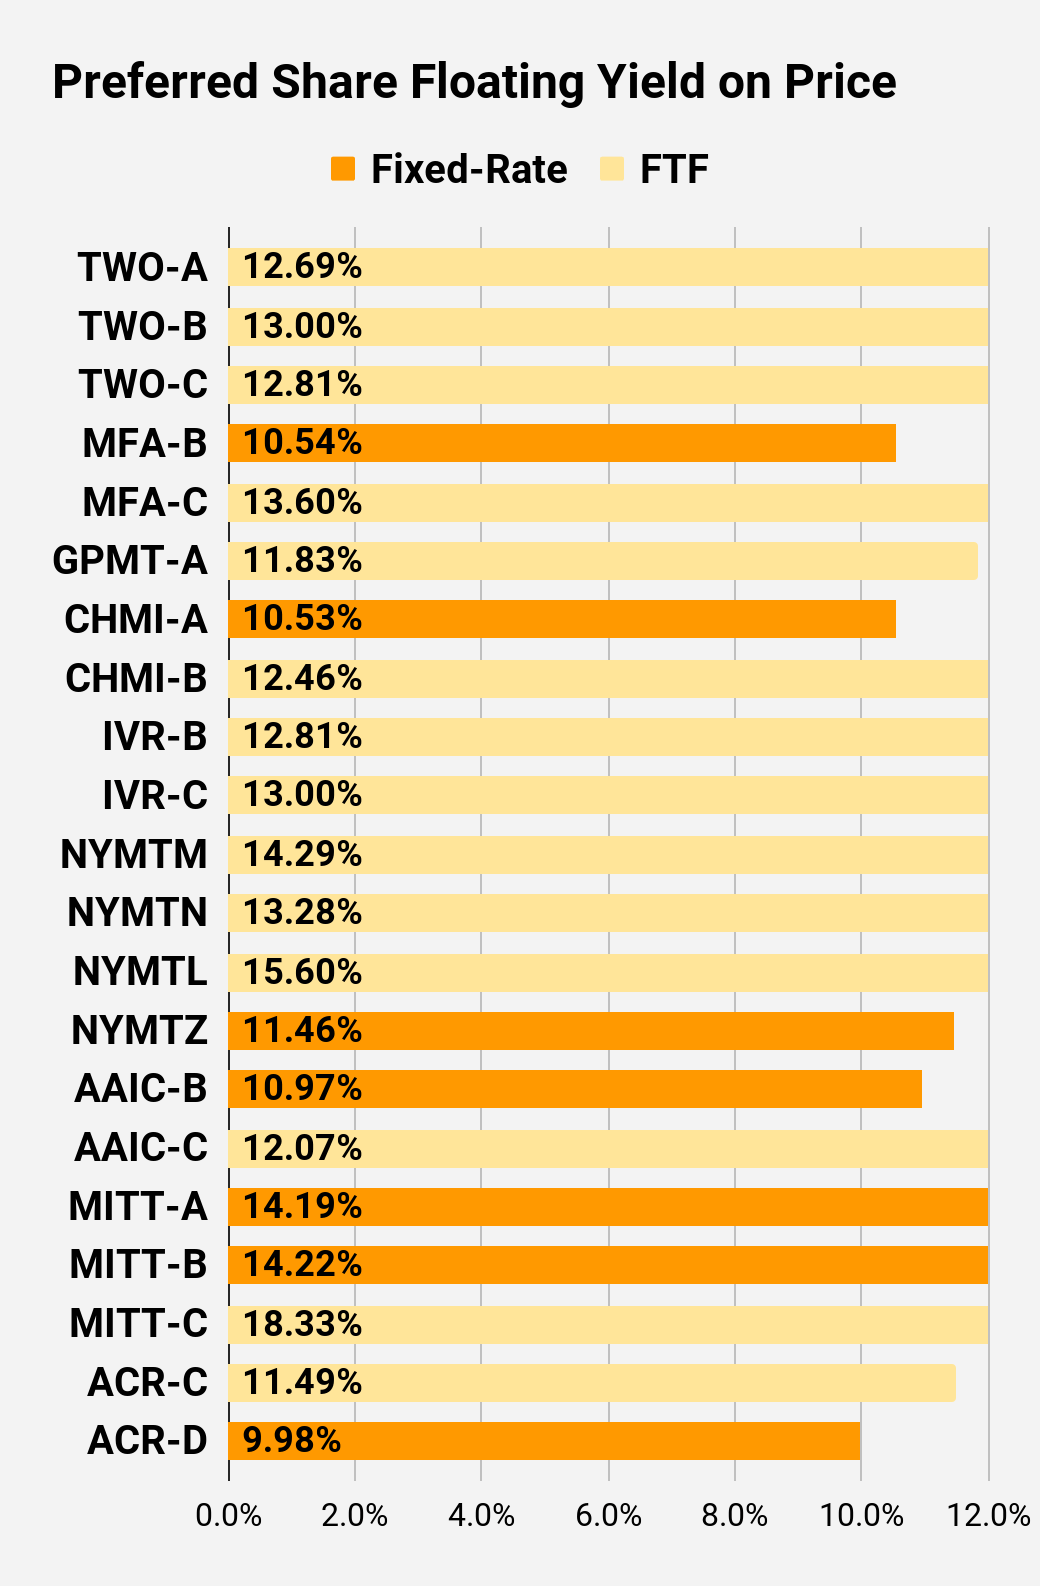
Preferred Share Charts
I changed the coloring a bit. We needed to adjust to include that the first fixed-to-floating shares have transitioned over to floating rates.
 The REIT Forum |
 The REIT Forum |
 The REIT Forum |
 The REIT Forum |
 The REIT Forum |
 The REIT Forum |
Preferred Share Data
Beyond the charts, we’re also providing our readers with access to several other metrics for the preferred shares.
After testing out a series on preferred shares, we decided to try merging it into the series on common shares. After all, we are still talking about positions in mortgage REITs. We don’t have any desire to cover preferred shares without cumulative dividends, so any preferred shares you see in our column will have cumulative dividends. You can verify that by using Quantum Online. We’ve included the links in the table below.
To better organize the table, we needed to abbreviate column names as follows:
- Price = Recent Share Price – Shown in Charts
- BoF = Bond or FTF (Fixed-to-Floating)
- S-Yield = Stripped Yield – Shown in Charts
- Coupon = Initial Fixed-Rate Coupon
- FYoP = Floating Yield on Price – Shown in Charts
- NCD = Next Call Date (the soonest shares could be called)
- Note: For all FTF issues, the floating rate would start on NCD.
- WCC = Worst Cash to Call (lowest net cash return possible from a call)
- QO Link = Link to Quantum Online Page
Second Batch:
Strategy
Our goal is to maximize total returns. We achieve those most effectively by including “trading” strategies. We regularly trade positions in the mortgage REIT common shares and BDCs because:
- Prices are inefficient.
- Long-term, share prices generally revolve around book value.
- Short-term, price-to-book ratios can deviate materially.
- Book value isn’t the only step in analysis, but it is the cornerstone.
We also allocate to preferred shares and equity REITs. We encourage buy-and-hold investors to consider using more preferred shares and equity REITs.
Performance
We compare our performance against 4 ETFs that investors might use for exposure to our sectors:
The REIT Forum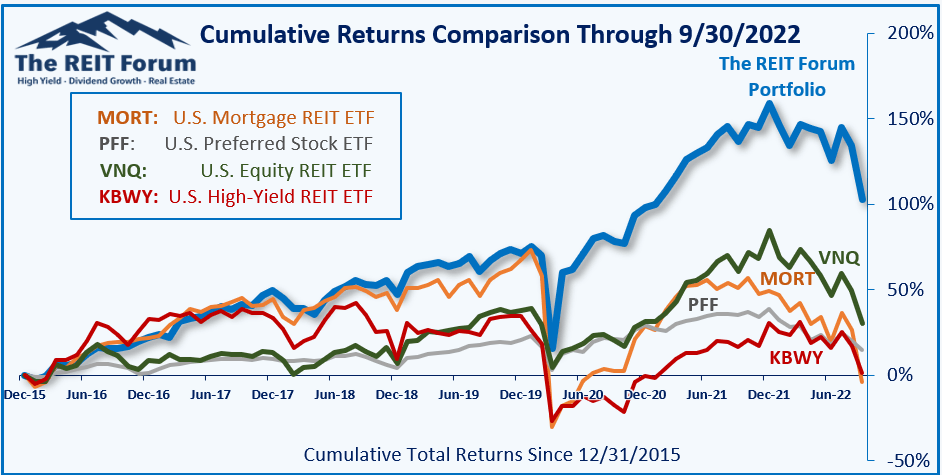
The 4 ETFs we use for comparison are:
|
Ticker |
Exposure |
|
One of the largest mortgage REIT ETFs |
|
|
One of the largest preferred share ETFs |
|
|
Largest equity REIT ETF |
|
|
The high-yield equity REIT ETF. Yes, it has been dreadful. |
When investors think it isn’t possible to earn solid returns in preferred shares or mortgage REITs, we politely disagree. The sector has plenty of opportunities, but investors still need to be wary of the risks. We can’t simply reach for yield and hope for the best. When it comes to common shares, we need to be even more vigilant to protect our principal by regularly watching prices and updating estimates for book value and price targets.
Ratings:
- Bullish on AGNC, NLY, DX, TWO
Be the first to comment