DKosig/E+ via Getty Images
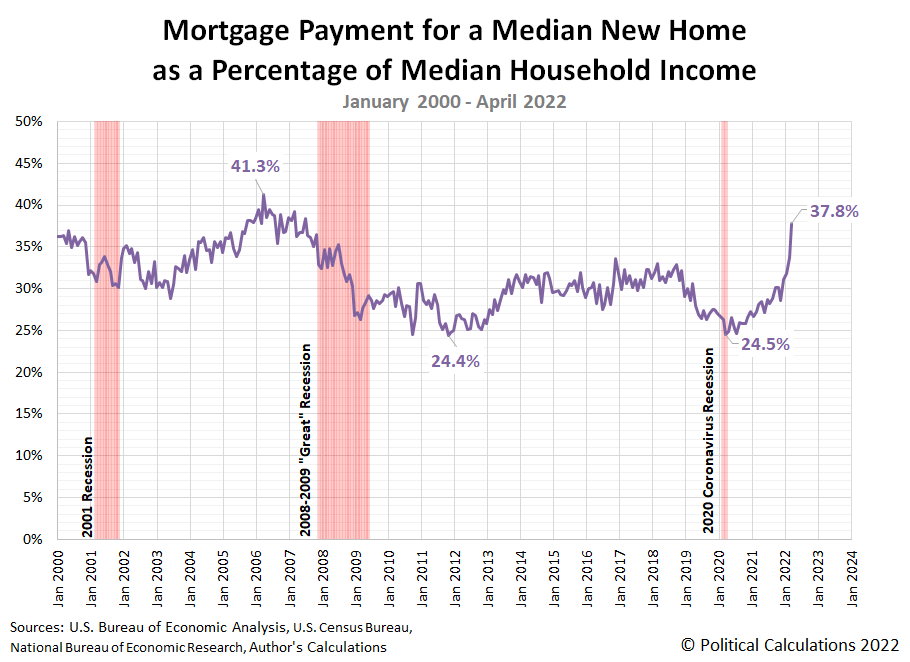
After reaching a new low for affordability in March 2022, the median new home in the U.S. became even less affordable for the typical American household in April 2022.
That’s especially clear in the following chart. It shows the basic mortgage payment for a median new home as a percentage of median household income rocketed up from 33.8% of that income in March to 37.8% in April 2022.
Calculated Risk’s Bill McBride is on record calling this the “worst housing affordability since 1991, excluding Bubble“. We’ll note that while he’s using a different methodology than ours [1], his results largely agree with our findings.
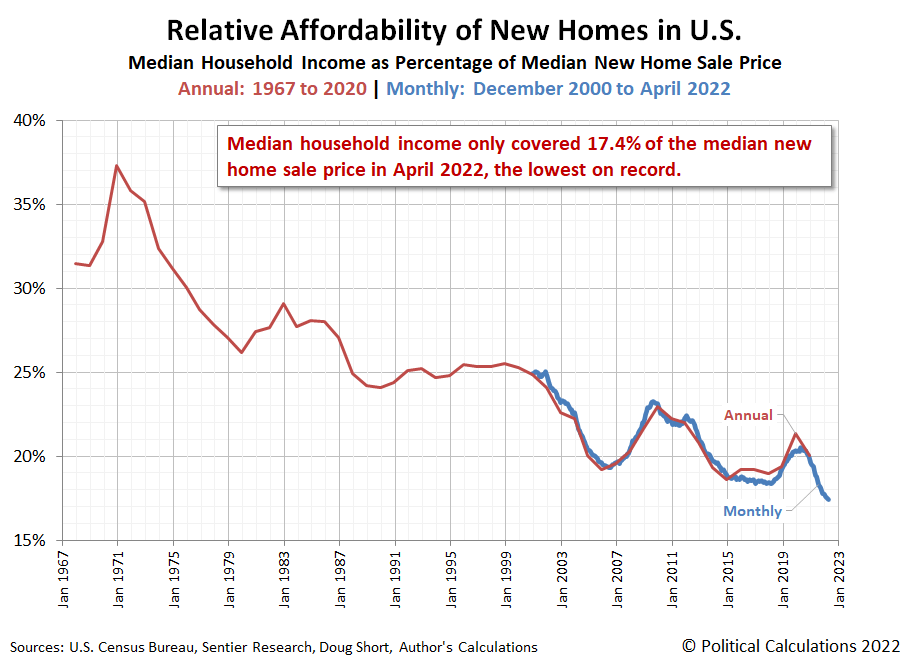
Our next chart confirms the raw affordability of new homes has achieved a new record low.
April 2022’s median household income was just 17.4% of the value of the median new home sold during the month. By this raw measure, new homes have never been less affordable for the period where we have data available.
Analyst’s Notes
[1] Our basic mortgage payment is based solely on the principal and interest paid for an average 30-year conventional mortgage for the median new home sold. In doing that math, we’re excluding any taxes, insurance, or other charges that might add to the cost of our estimated mortgage payment, while also excluding any down payment on a new home that might reduce it. Approaching the math this way provides a consistent way to estimate the relative burden of new home ownership for a median income-earning household both over time and space, where these factors have changed over time and vary by region. We then calculate the percentage of median household income consumed by that mortgage payment using our contemporary monthly estimates of that income.
Bill McBride’s method differs in that he’s looking at the average cost of a mortgage for all houses, both new and existing, which he adjusts downward to reflect a 15% down payment to calculate a mortgage payment before adjusting that payment upward by 2% to represent property taxes, insurance, and maintenance. He then divides that result by the U.S. Census Bureau’s annual estimate of median household income from the previous year before indexing his monthly data with respect to his result for January 1976.
There are advantages and disadvantages to both approaches. We developed our method because we find the results are more intuitive for assessing the relative affordability of the housing we’re looking at.
References
U.S. Census Bureau. New Residential Sales Historical Data. Houses Sold. [Excel Spreadsheet]. Accessed 24 May 2022.
U.S. Census Bureau. New Residential Sales Historical Data. Median and Average Sale Price of Houses Sold. [Excel Spreadsheet]. Accessed 24 May 2022.
Freddie Mac. 30-Year Fixed Rate Mortgages Since 1971. [Online Database]. Accessed 1 June 2022.
Editor’s Note: The summary bullets for this article were chosen by Seeking Alpha editors.


Be the first to comment