

MicroStockHub/iStock via Getty Images
When talking about rating agencies, we are usually looking at the major three rating agencies – Moody’s Corporation (MCO), S&P Global Inc. (SPGI) and Fitch Ratings – and often forget that there are other rating agencies aside from the Big Three. Morningstar Inc. (NASDAQ:MORN) is number four in this market after it acquired DBRS in 2019 and one of the major financial services companies.
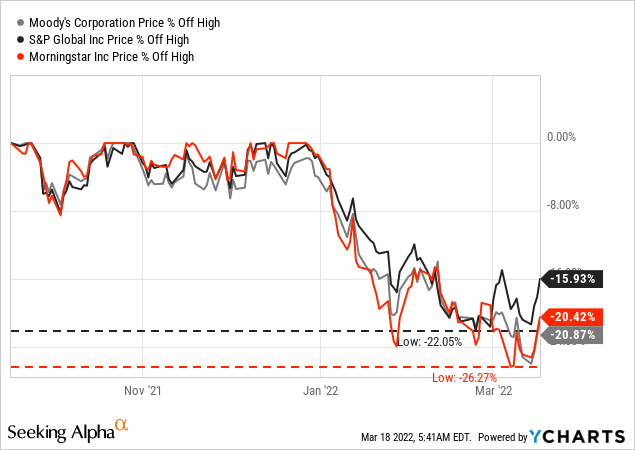
In the recent downturn all three stocks – MCO, SPGI and MORN – entered bear market territory with S&P Global declining only 22% and Moody’s Corporation as well as Morningstar declining about 25%. And when a stock is losing about 20% to 25% of its previous value, it certainly makes sense to take a closer look whether we are dealing with a bargain and in this article, we take a closer look at Morningstar again.
Results
At the end of February, Morningstar reported fiscal 2021 results and could once again report high growth rates. Morningstar generated $1,699 million in revenue and compared to $1,390 million last year, this is resulting in a 22.3% YoY increase (with organic revenue growth being 17.6%). Operating income also increased from $215.3 million in fiscal 2020 to $257.0 million resulting in 19.4% YoY growth.
Morningstar Q4/21 Presentation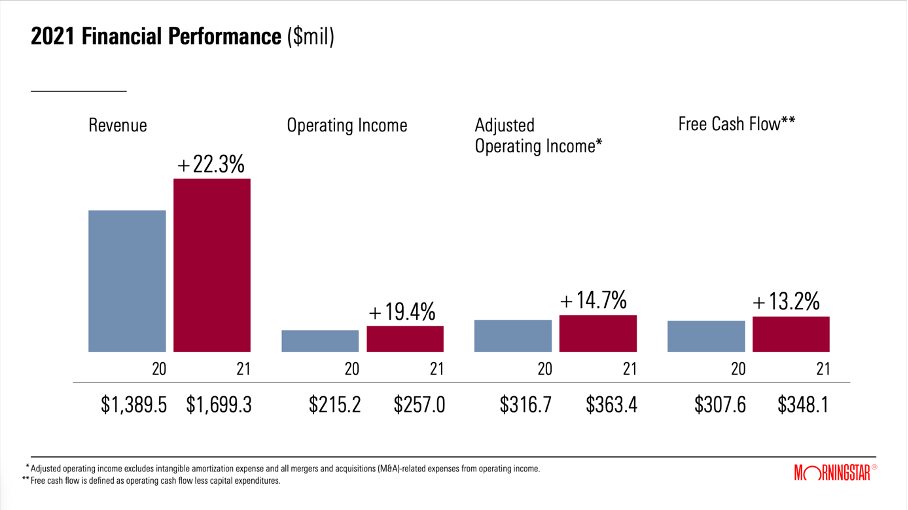
When looking at earnings per share (according to GAAP accounting), we see a decline from $5.18 in fiscal 2020 to $4.45 in fiscal 2021. However, we must point out, that fiscal 2020 EPS is including $1.18 per share holding gain related to Morningstar’s previously held equity interest in Sustainalytics. The adjusted diluted net income per share could increase 17.8% year-over-year. And finally, free cash flow could also increase 13.2% YoY from $307.6 million last year to $348.1 million in fiscal 2021.
Morningstar Q4/21 Presentation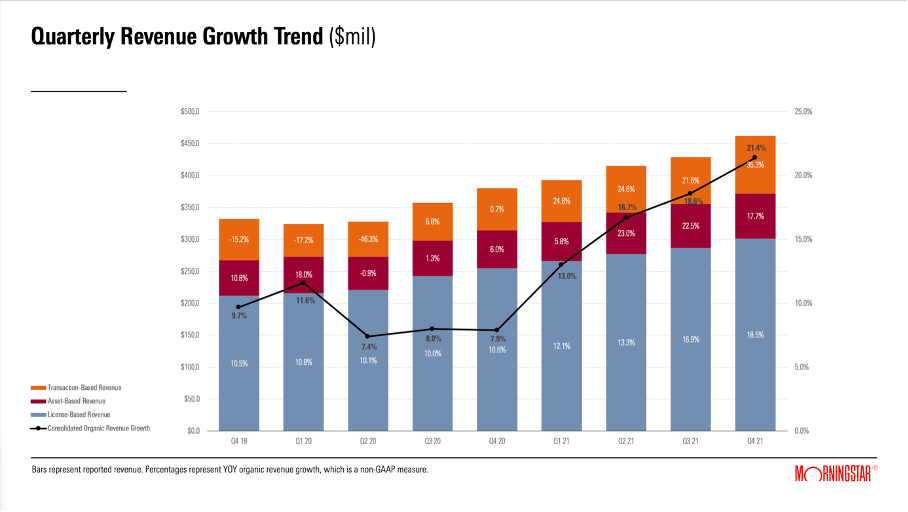
In fiscal 2021, PitchBook, DBRS Morningstar, Morningstar Data, Workplace Solutions and Morningstar Indexes were the top five contributors of organic revenue growth. And when looking at the three different segments, Morningstar is reporting in, all of them could contribute to year-over-year growth:
- License-based: This segment is still responsible for the biggest part of revenue and in fiscal 2021 it could generate $1,132 million in revenue. Compared to $935 million in fiscal 2020 it is resulting in 21.1% year-over-year growth (with organic growth being 15.4%). And especially PitchBook ($290.2 million) and Morningstar Data ($243.5 million) are responsible for a huge part of revenue.
- Asset-based: This segment could generate $264.9 million in revenue in fiscal 2021, which is 18.4% higher than revenue in the previous year ($223.8 million). From a growth perspective, Morningstar Indexes is worth mentioning with revenue increasing 70.4% year-over-year.
- Transaction-based: While this segment is responsible for $302.7 million in revenue in fiscal 2021, it could report the highest growth rates of the three segments. Compared to $230.8 million in fiscal 2020, revenue increased 31.2% YoY (with organic growth being 26.9%). Revenue of this segment mostly stems from DBRS Morningstar, which could generate $271.2 million in revenue and report 30.8% YoY growth.
The Years To Come
In my last article, I already talked about the growth potential of Morningstar in the years to come and I titled the section “Fear the bear” as Morningstar is probably among the businesses, that will be hit by a potential bear market. Morningstar as a financial services company is profiting from a bull market and in my last article I wrote:
Morningstar as a financial services firm is also dependent on the performance of the stock market. In bull markets (especially in the last phase of a bull market, during the euphoria stage), a lot of people are drawn to the stock market that usually don’t care about stocks or investing. And quite naturally, Morningstar is profiting from these trends: higher assets under management, more people needing investment tools, people using Morningstar’s data and/or indexes.
And while Morningstar is clearly profiting from a bull market – we can see this by looking at the quarterly results in the recent past – bear markets can be rather tricky for these businesses. In my last article I continued:
But during the following bear markets, many of these new investors are disappointed and stop investing as quickly as they started investing, which is not good for Morningstar. But we have to differentiate between individuals and businesses. If it is rather businesses using Morningstar’s services, we can expect more or less stability (of course, these companies might also go bankrupt or have less employees meaning less subscriptions for Morningstar). However, individual investors are using mostly Morningstar.com and are using paid Premium Membership, and these are not the main sources of revenue for Morningstar. But Morningstar is also generating about 16% of its revenue asset-based and if individual investors start to withdraw funds in case of a bear market, it will have a negative effect on Morningstar’s revenue.
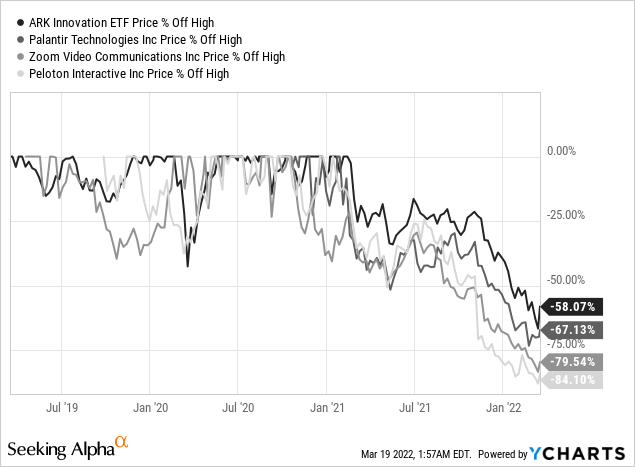
When my last article was published in May 2021, a bear market in the technology sector had already begun about three months earlier. But to be honest, I did not realize it back then. In the early summer of 2021, I started focusing on Chinese technologies stocks, but did not realize that the stocks of many U.S. based technology companies also entered bear market territory. So, we can argue, that many investors in the technology sector already experienced steep declines, while the overall market – exemplified by the S&P 500 (SPY) or the Dow Jones Industrial Average (DIA) – could stay at high levels. This decline is probably best exemplified by the person who could become in retrospect the face of this gigantic bubble – Cathie Woods. Her flagship fund, the Ark Innovation ETF (ARKK), saw already steep declines in the past 13 months (it lost about two thirds of its previous value) and it was recently reported, that two-thirds of ARKK holdings hit a new 52-week low.
The stock market is clearly overvalued at this point and stock prices for many companies can’t be justified. However, I believe that Avi Gilburt‘s prediction of a final upward wave in this bull market before the inevitable bear market will begin is correct. And this could lead to some more quarters with strong growth rates for Morningstar as the euphoria is not over. But we can assume that in 2023 or 2024 rather difficult years for Morningstar will begin as the final burst of this bubble will have similar effects as the burst of the Dotcom bubble in 2000 (many investors will run away from the stock market and never return and convince everybody else in the years and decades to come, that you can only loose by buying stocks).
When looking at the last bear market as well as the early years of the current bull market (2007 till about 2012), we don’t see extremely steep EPS declines for Morningstar. However, we can see rather stagnating numbers and low growth rates in these years before the bull market intensified and Morningstar saw higher growth rates again.
Author’s work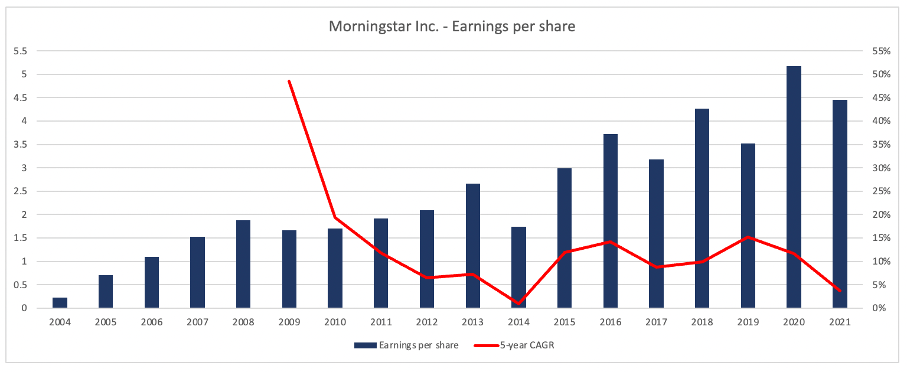
In the last ten years, earrings per share were clearly growing (with a CAGR of 8.77%), but earnings per share remained choppy during that time. In the last few years every single “growth year” was followed by a year with lower earnings per share again. But the overall trend is clearly showing that Morningstar is able to grow with a high pace. Since 2004 (the first year, Morningstar was profitable) earnings per share increased with a CAGR of 19.04%. Despite these high growth rates, it should not be ignored, that growth slowed down over the last few years.
Balance Sheet
We don’t exactly know what will happen in the years to come and how hard a potential bear market might impact Morningstar’s business model. But it is good to know, that Morningstar has a solid balance sheet and should be able to navigate through rough times.
On December 31, 2021, Morningstar had $359 million in long-term debt on its balance sheet, but when comparing this amount to a total equity of $1,416 million we get a debt-equity ratio of 0.25. When comparing the total debt to the operating income of fiscal 2021 ($257 million), it would take a little less than 1.5 years to repay the total debt, which is acceptable. We should also point out, that Morningstar has $484 million in cash and cash equivalents on its balance sheet as well as $62.3 million in short-term investments. Hence, the liquid assets are more than enough to repay the outstanding debt.
A bit problematic could be $1,207 million in goodwill, which is 42% of total assets ($2,863 million) and goodwill is certainly not the kind of asset I like to have on a balance sheet. But when summing up, we should not be concerned about Morningstar’s balance sheet – and neither solvency nor liquidity is an issue right now.
Intrinsic Value Calculation
Morningstar is without doubt a solid business with a solid balance sheet and should be able to grow over the long run (and be able to fend off competitors to some degree). But for Morningstar to also be a solid investment, the stock must trade at least for a reasonable price – and to make the stock a clear buy, it has to trade below its intrinsic value.
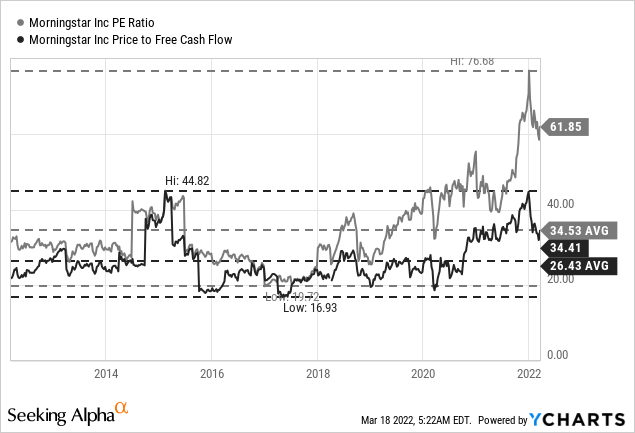
However, when looking at the price-earnings ratio, we also get first glimpses, that Morningstar is probably too expensive right now. Although the stock is trading for a lower multiple than a few weeks ago, we still must pay 62 times the earnings per share of the last four quarters. This is not only above the 10-year average P/E ratio (which is 34.5), but a P/E ratio that can’t hardly be justified. Even companies growing with an extremely high pace should not trade for P/E ratios that high. When looking at the price-free-cash-flow ratio – the more important metric – the picture looks a little better. Right now, Morningstar is trading for 34 times free cash flow. However, that is still one of the higher P/FCF ratios of the last 10 years and also above the 10-year average of 26.4.
Additionally, we can also use a discount cash flow analysis to determine an intrinsic value of a stock. And as basis for our calculation, we can take the free cash flow of fiscal 2021, which was $348.1 million. Additionally, we assume that Morningstar will be able to grow 10% annually for the next ten years followed by 6% growth till perpetuity (the same assumptions I used in my last article). When using these numbers (43.4 million outstanding shares and 10% discount rate), we get an intrinsic value of $266.07 for Morningstar and the stock would be slightly overvalued at the time of writing.
We could use this calculation and intrinsic value to make investment decisions based on it, but I see at least two problems we must address:
- I would be rather cautious if 10% growth for the next ten years is realistic. In theory, Morningstar can grow at such a rate, but when considering that Morningstar will probably suffer in a bear market (and a bear market will occur with a very high probability in the next ten years), we should be rather cautious. If we assume, that free cash flow will stagnate for three years in a row (a rather moderate assumption in case of a bear market), the intrinsic value for Morningstar should only be around $200.
- We should also be cautious about the extremely high free cash flow in comparison to the rather low net income. In fiscal 2021, Morningstar generated a free cash flow of $348 million, but only a net income of $193 million. Due to its subscription model for several products, Morningstar is often generating revenue up-front and when subscriptions are growing with a high pace, free cash flow is a lot higher than net income. But when growth will slow down, free cash flow will also decrease – and it might decrease quite steep and suddenly be in line with net income again. When looking at the last ten years, we can see free cash flow being more or less similar to net income at the beginning of the bull market and especially in the last few years, free cash flow is much higher than net income. In the first five years, free cash conversion was 112%, in the last five years free cash conversion was 150%.
|
Year |
2012 |
2013 |
2014 |
2015 |
2016 |
|---|---|---|---|---|---|
|
Free cash conversion |
107% |
123% |
95% |
137% |
94% |
|
Year |
2017 |
2018 |
2019 |
2020 |
2021 |
|
Free cash conversion |
134% |
130% |
167% |
138% |
180% |
And when considering these aspects, the intrinsic value calculated above is probably too optimistic.
Conclusion
In my last article about Morningstar, which was published in May 2021, I considered the stock to be a “Hold”. I would Morningstar once again see as a hold, but I consider the upside limited for the next few years. Of course, when the theory of a final bullish wave is correct, Morningstar’s stock will probably also increase in value in the coming months. But as the stock is trading above its intrinsic value in my opinion and growth could slow down in the next few years, the stock will most likely be trading for a lower price in the years to come and as long-term investors we should not just focus what will happen in the next few months but consider longer timeframes.
Be the first to comment