

Pgiam/iStock via Getty Images
Investing Thesis
What makes markets work are the different price expectations among players in the game. And the uncertainty of the future, particularly the more distant it may be.
The jugglers at many well-informed centers of future-value determination have many portfolio-holding balls in the air at a time. Each one is molded around its own set of influences, appraisals and re-appraisals as new information appears.
Market-makers fill volume trade orders by borrowing existing shares to deliver in the trade. Shares to be recovered and returned to original owners as markets make practical recovery actions possible.
While at risk in the interim, they hedge their shorts. The hedge actions taken define the price limits, up and down of the market’s expectations. Histories of their post-forecast market outcomes offer guidance to appraise their credibility.
Investment strategies decide in advance how long in time and/or how far in price expectations a portfolio holding may go before change is called for. Buy & Hold is at one extreme, day-trading at the other. Few extremes get adopted by well-informed institutional funds.
Purpose of Article
This article compares the outlook for near coming prices of T. Rowe Price Group (TROW) with Morgan Stanley (NYSE:MS) and others with alternatives and market averages. It is a picture of differences of view in Equity investing reflected in the prospects for stocks seen at this point in time and the next few months, not a study of values for long-term holdings.
Value prospects for individual investors may be quite different from institutional investors depending on income tax impacts, presumed by this analysis to be absent in both cases. The analysis of market professionals regarding economics of subject investment corporation operations and tax implications we believe is to be competitively adequate.
Description of Primary Subject
“Morgan Stanley, a financial holding company, provides various financial products and services to corporations, governments, financial institutions, and individuals in the Americas, Europe, the Middle East, Africa, and Asia. It operates through Institutional Securities, Wealth Management, and Investment Management segments. The Institutional Securities segment provides market-making services in equity and fixed income products. Morgan Stanley was founded in 1924 and is headquartered in New York, New York.”
Source: Yahoo Finance
Yahoo Finance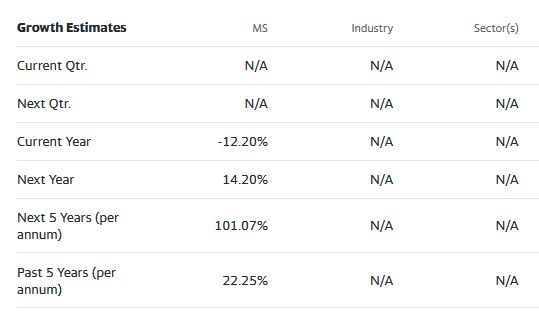
Description of Secondary Subject
“T. Rowe Price Group, Inc. is a publicly owned investment manager. The firm provides its services to individuals, institutional investors, retirement plans, financial intermediaries, and institutions. It launches and manages equity and fixed income mutual funds. The firm invests in the public equity and fixed income markets across the globe. The firm was previously known as T. Rowe Group, Inc. and T. Rowe Price Associates, Inc. T. Rowe Price Group, Inc. was founded in 1937 and is based in Baltimore, Maryland.
Source: Yahoo Finance
Yahoo Finance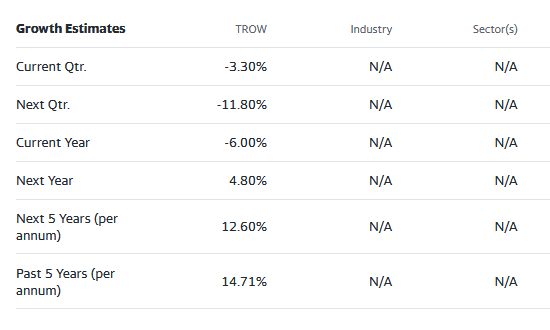
Source: Yahoo Finance
Investment Alternative Rewards & Risks
blockdesk.com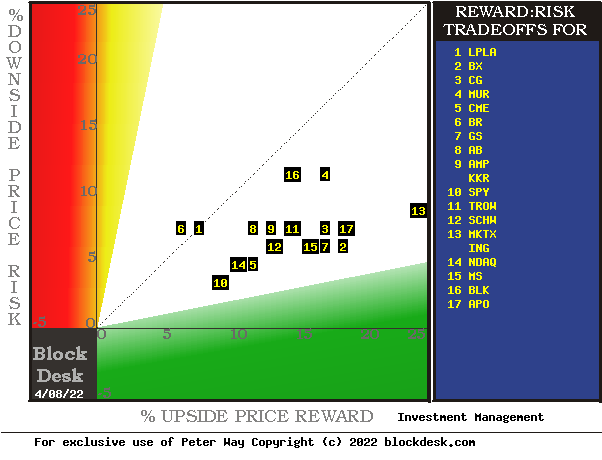
(Used with permission)
The tradeoffs here are between near-term upside price gains (green horizontal scale) seen worth protecting against by Market-makers with short positions in each of the stocks, and the prior actual price drawdowns experienced during holdings of those stocks (red vertical scale). Both scales are of percent change from zero to 25%.
The intersection of those coordinates by the numbered positions is identified by the stock symbols in the blue field to the right.
The dotted diagonal line marks the points of equal upside price change forecasts derived from Market-Maker [MM] hedging actions and the actual worst-case price drawdowns from positions that could have been taken following prior MM forecasts like today’s.
Our principal interests are in TROW at location [11] and in MS at [15]. A “market index” norm of reward~risk tradeoffs is offered by SPDR S&P500 index ETF at [10]. Best “long” position locations are down and to the right.
Those forecasts are implied by the self-protective behaviors of MMs (like MS) who must usually put firm capital at temporary risk to balance buyer and seller interests in helping big-money portfolio managers (like TROW) make volume adjustments to multi-billion-dollar portfolios. The protective hedging actions taken with real-money bets define daily the extent of likely expected price changes for thousands of stocks and ETFs.
This map is a good starting point, but it can only cover some of the investment characteristics that often should influence an investor’s choice of where to put his/her capital to work. The table in Figure 2 covers the above considerations and several others.
Comparing Alternative Investment Details
Figure 2
blockesk.com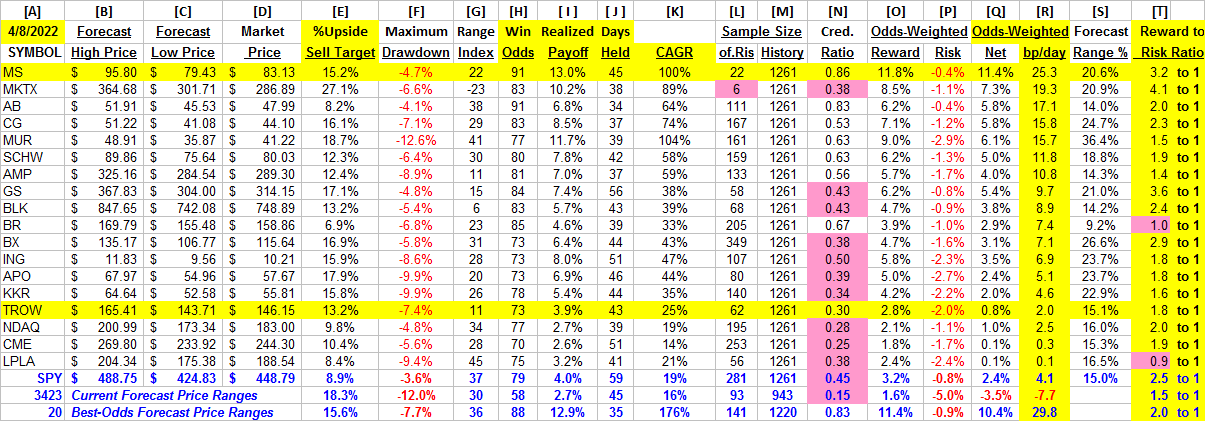
(Used with permission)
Column headers for Figure 2 define elements for each row stock whose symbol appears at the left in column [A]. The elements are derived or calculated separately for each stock, based on the specifics of its situation and current-day MM price-range forecasts. Data in red numerals are negative, usually undesirable to “long” holding positions. Table cells with pink background “fills” signify conditions typically unacceptable to “buy” recommendations. Yellow fills are of data for the stocks of principal interest and of all issues at the ranking column, [R].
Readers familiar with our analysis methods may wish to skip to the next section viewing price range forecast trends for TROW.
Figure 2’s purpose is to attempt universally comparable answers, stock by stock, of a) How BIG the price gain payoff may be, b) how LIKELY the payoff will be a profitable experience, c) how soon in TIME it may happen, and d) what price drawdown RISK may be encountered during its holding period.
The price-range forecast limits of columns [B] and [C] get defined by volume trade orders placed by big-$ “institutional” clients. Orders where MM firm capital which has been required to be put at risk of price changes gets protected by hedging actions.
Potential upside risks for MM short positions created to fill such orders are measured in [E], and reward potentials for the buy-side positions so created. Prior forecasts like the present provide a history of relevant price draw-down risks for buyers. The most severe ones actually encountered are in [F], during holding periods in effort to reach [E] gains. Those are where buyers are most likely to accept losses.
[H] tells what proportion of the [L] sample of prior like forecasts have earned gains by either having price reach its [B] target or be above its [D] entry cost at the end of a 3-month max-patience holding period limit. [ I ] gives the net gains-losses of those [L] experiences and [N] suggests how credible [E] may be compared to [ I ].
Further Reward~Risk tradeoffs involve using the [H] odds for gains with the 100 – H loss odds as weights for N-conditioned [E] and for [F], for a combined-return score [Q]. The typical position holding period [J] on [Q] provides a figure of merit [fom] ranking measure [R] useful in portfolio position preferencing. Figure 2 is row-ranked on [R] among candidate securities, with MS in top rank, not TROW.
Along with the candidate-specific stocks these selection considerations are provided for the averages of over 3400 stocks for which MM price-range forecasts are available today, and 20 of the best-ranked (by fom) of those forecasts, as well as the forecast for S&P500 Index ETF (NYSEARCA:SPY) as an equity market proxy.
The present uncertainties in the equities market at large are seen in the [T] column. The forecast population of the 3,423 row is a broader measure of equities in general than the 500 relatively bigger-cap stocks of SPY. Its R~R ratio of 1.5 to 1 has less [E] payoff prospect beyond the column [F] size of price drawdown than SPY’s 2.5 to 1. The real difference is in the [F] risk column where SPY is only 1/4th as much exposed to price drawdowns as the rest of the population exposure for the broad market index. SPY’s Sample Size of 281 (out of 1,261 market days of the past 5 years) provides how broad is today’s Range Index of 37, a usual level with a reward~risk ratio of 2.5. The high level of world uncertainty from Russia’s invasion of Ukraine appears to have little abnormal effect on big-capital equities.
Recent Trends in MM Price-Range Forecasts for TROW
Figure 3
blockdesk.com
(Used with permission)
This picture is not a “technical chart” of past prices for TROW. Instead, it is the past 6 months of daily price range forecasts of market actions yet to come in the next few months. The only past information there is the closing stock price on the day of each forecast.
That data splits the price range’s opposite forecasts into upside and downside prospects. Their trends over time provide additional insights into coming potentials, and helps keep perspective on what may be coming.
The small picture at the bottom of Figure 3 is a frequency distribution of the Range Index’s appearance daily during the past 5 years of daily forecasts. The Range Index [RI] tells how much the downside of the forecast range occupies of that percentage of the entire range each day, and its frequency suggests what may seem “normal” for that stock, in the expectations of its evaluators’ eyes.
Here the present level is well below its most frequent presence, encouraging the acceptance that we are looking at a moment of TROW’s price change prospects a bit below normal, one allowing further coming modest recovery. The history of prior recoveries at this stage is that 7 out of 10 reach their target sell forecasts, with realized further payoffs only about +4% gains, including those 3 of 10 not profitable.
This is the perspective of an investor viewing TROW as an investment itself being managed, not as a manager doing the investment. Were TROW in the latter role, with the market’s evaluation of MS as seen in Figure 4, a more comfortable choice might well be of MS as an investment.
Figure 4
blockdesk.com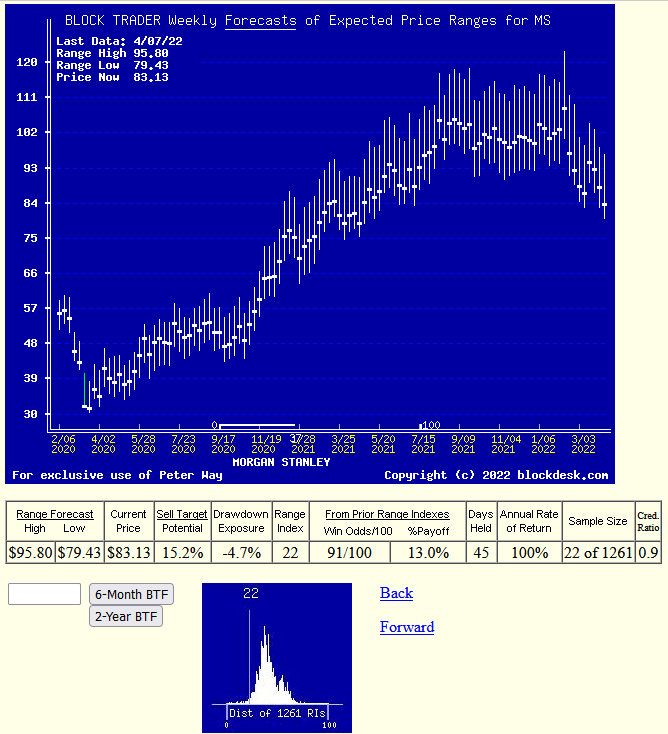
(Used with permission)
Here instead of the 6 months of daily forecasts in Figure 3 we have two years of once a week daily forecasts, allowing a longer time view, with its forecast price ranges topping out about where the TROW picture begins. Its current Range Index of 22 has a larger proportion of a larger forecast range (20% vs. 15%) than TROW, but a much smaller actual downside (-4.7% than -7.4%) price risk experience at today’s RI during the same 5 years of market exposure as TROW.
MS’s accomplished net gains of +13% from today’s forecast Risk~Reward balance are considerably better than TROW’s +3.9%, largely because of its 91% winners instead of TROW’s only 73% at today’s R~R balance.
In many respects, MS has the market-maker advantage of continuing perspective of TROW’s competitors from a position not possible for TROW to have. Other points in time may be different.
Conclusion
Among alternative investments for other Investment Industry competitors, Morgan Stanley (MS) appears to be a logical buy preference at this point in time for investors seeking near-term capital gain advantage over the current prospect for T. R. Price Group (TROW).
Additional disclosure: Peter Way and generations of the Way Family are long-term providers of perspective information, earlier helping professional investors and now individual investors, discriminate between wealth-building opportunities in individual stocks and ETFs. We do not manage money for others outside of the family but do provide pro bono consulting for a limited number of not-for-profit organizations.
We firmly believe investors need to maintain skin in their game by actively initiating commitment choices of capital and time investments in their personal portfolios. So our information presents for D-I-Y investor guidance what the arguably best-informed professional investors are thinking. Their insights, revealed through their own self-protective hedging actions, tell what they believe is most likely to happen to the prices of specific issues in coming weeks and months. Evidences of how such prior forecasts have worked out are routinely provided at our SA blog under my name.
Be the first to comment