

MF3d/E+ via Getty Images
During periods of uncertainty, investors need to look for high-quality stocks with reliable and reasonably predictable free cash flows. Companies like Alphabet (NASDAQ:GOOGL) (NASDAQ:GOOG) and Microsoft (NASDAQ:MSFT) will certainly be profitable in almost all market conditions, even if sales and profits were to temporarily decline in a recession.
Therefore, investors can hardly go wrong in the long term picking either one of these two tech giants. Nonetheless, for the sake of this article, we will compare them to determine which one may be the better buy.
Quality Poised to Outperform
Before we get into the comparisons, let’s first take a look at why investors should really consider these two stocks from a macroeconomic point of view.
The yield curve recently inverted for a brief period of time, sparking a frenzy of recession talks. More specifically, the 2-year treasury yield was higher than the 10-year treasury yield. However, we recently wrote an article explaining why we don’t think a recession is in the cards yet.
No, it’s not a “this time is different” argument. On the contrary, we argue that the 3-month treasury yield is the one investors should actually be watching because it is a more accurate indicator than the 2-year. This is because the 2-year has been wrong in the past, signaling recessions that never occurred. Alternatively, the 3-month yield has never been wrong, at least not yet.
In addition, there’s always a lag time between inversion and a recession. As a result, we would define a late-stage bull market as the period following an inversion of the 3-month and 10-year yield but before the actual recession.
Given that this inversion has not happened yet, and the initial boom of the pandemic recovery is now fading, we would consider this current period as the mid-cycle. Historically speaking, quality-factor investing tends to outperform during this time period.
The iShares MSCI USA Quality Factor ETF (QUAL), which we will use as a reference in this article, defines quality as having a high return on equity, stable year-over-year earnings growth, and low financial leverage.
Below is the relative performance of QUAL versus the SPDR S&P 500 Trust ETF (SPY) beginning during the mid-cycle of the previous business cycle:
Koyfin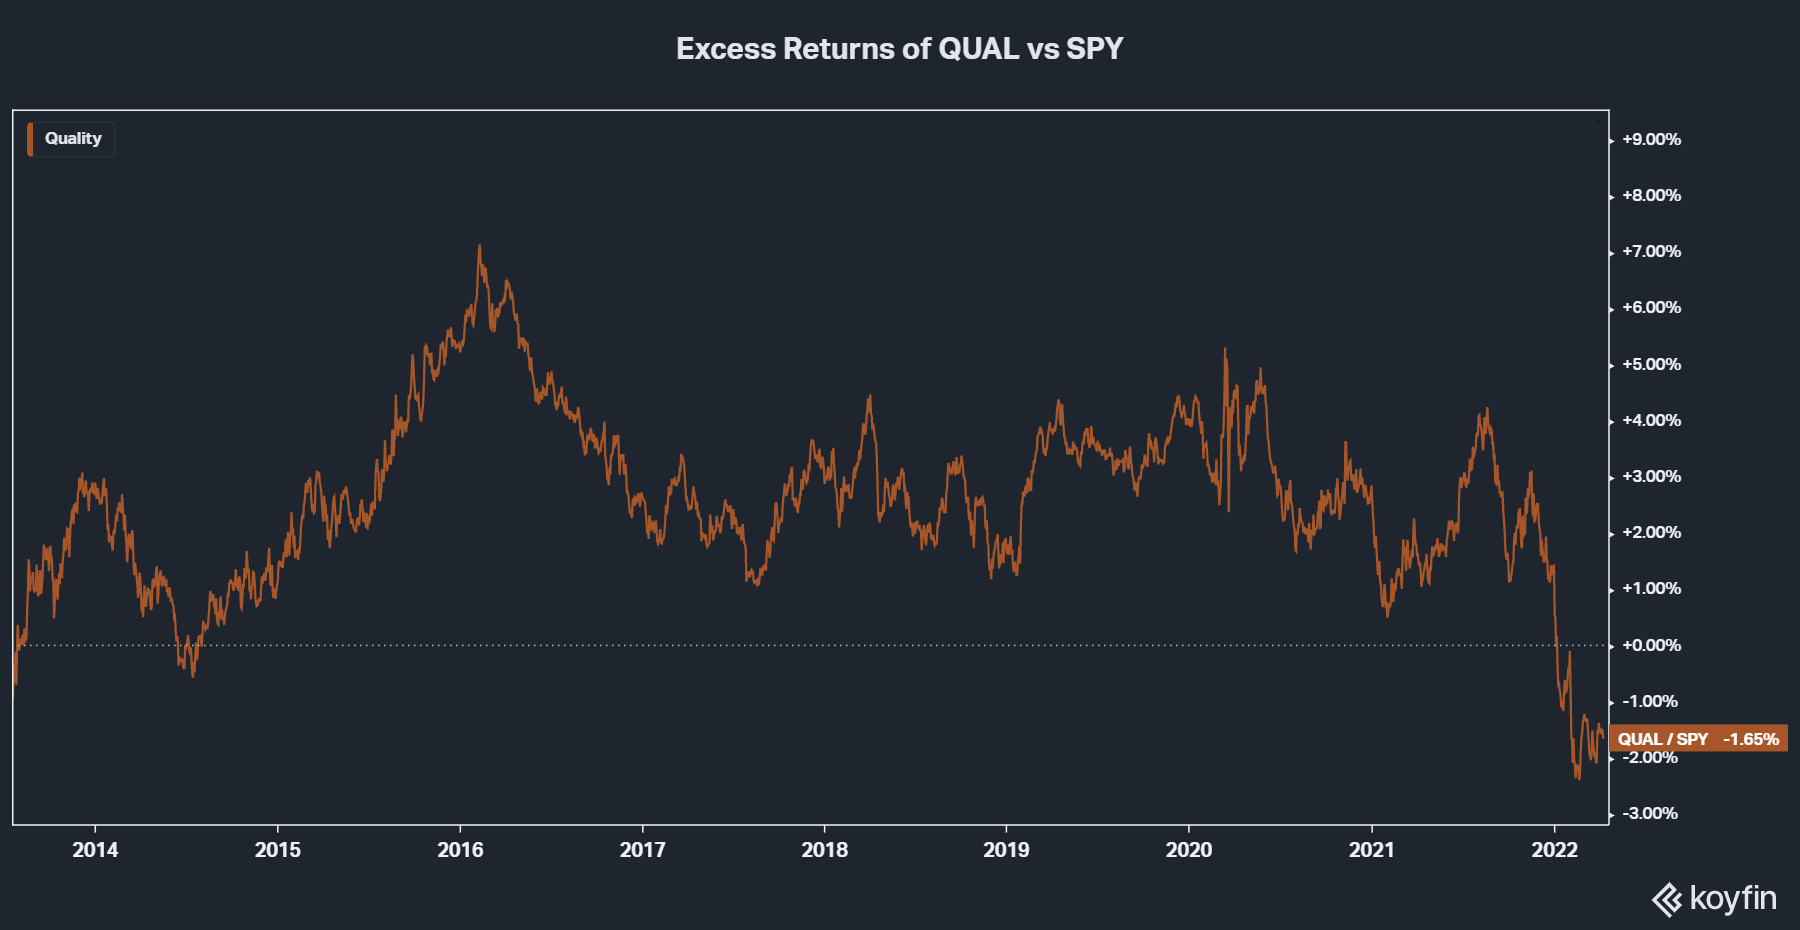
As we can see from the chart above, quality outperformed the S&P 500 during most of the expansion. This is likely because as the initial boom of a new cycle begins to wear off, investors begin to move money into stocks that can maintain consistent growth and profitability throughout all business conditions.
However, we can also see that quality is currently underperforming due to the recent sell-off we’ve experienced in the past few months. As a result, quality stocks may be in a prime position to outperform from this point on.
With both companies as holdings in the ETF that have seen declines greater than that of the S&P 500, they both qualify as quality stocks while being positioned to likely outperform as well.
Quantitative Competitive Advantage
Alphabet
To measure the competitive advantages, we will employ a method called earnings power value, which was created by Bruce Greenwald. Earnings power value is measured as adjusted earnings divided by the weighted average cost of capital, and reproduction value can be measured using total asset value.
The idea is simple: assuming no growth, if a company can generate more value from earnings relative to the total asset value, then that company is considered to have a competitive advantage.
Although the formula is simple and straightforward, there are quite a few steps required to calculate adjusted EBIT after tax. First off, we will need to compute the average EBIT margin of the past five years, which in this case is 25%.
The next step is to normalize the EBIT and calculate the net operating profit after tax or NOPAT. Please note that all calculations are in millions of dollars:
- NOPAT = LTM Revenue x Average EBIT Margin x (1 – Tax Rate)
- $50,876 = $257,600 x 0.25 x (1 – 0.21)
Now that we have NOPAT, we need to adjust depreciation and CapEx to account for the assumption of no growth because less investment would be required:
- Adjusted Depreciation = (0.5 x Tax Rate) x Five-Year Average Depreciation
- $1,127.5 = (0.5 * 0.21) x $10,738
Next, we will need to calculate the maintenance CapEx for each of the past five years and then find the average:
- Maintenance Capex = Total Capex x (1 – Revenue Growth Rate)
Using the formula above for each of the past five years, we arrive at an average maintenance CapEx of $16,518.1.
Now that we have both adjusted depreciation and average maintenance capex, we can calculate the adjusted earnings and EPV as follows:
- Adjusted Earnings = NOPAT + Adjusted Depreciation – Average Maintenance Capex
- $35,485.4 = $50,876 + $1,127.5 – $16,518.1
- EPV = Adjusted Earnings / Weighted Average Cost of Capital
- $506,933.9 = $35,485.4 / 0.07
Note: WACC was taken from Finbox.
Since Alphabet has a total asset value of $359,300 (in millions), we can say that it does have a competitive advantage. In other words, assuming no growth for Alphabet, it would require $359,300 of assets to generate $506,933.9 in value over time.
Microsoft
Using the same steps above, Microsoft’s competitive advantage is as follows:
- NOPAT = LTM Revenue x Average EBIT Margin x (1 – Tax Rate)
- $51,124.8 = $184,900 x 0.35 x (1 – 0.21)
- Adjusted Depreciation = (0.5 x Tax Rate) x Five-Year Average Depreciation
- $1,102.5 = (0.5 * 0.21) x $10,500
- Maintenance Capex = Total Capex x (1 – Revenue Growth Rate)
- Using the formula above for each of the past five years, we arrive at an average maintenance capex of $14,146.4.
- Adjusted Earnings = NOPAT + Adjusted Depreciation – Average Maintenance Capex
- $38,081 = $51,124.8 + $1,102.5 – $14,146.4
- EPV = Adjusted Earnings / Weighted Average Cost of Capital
- $544,014.1 = $38,081.0 / 0.07
Since Microsoft has a total asset value of $340,400 (again, in millions), we can say that it does have a competitive advantage. In other words, assuming no growth for Microsoft, it would require $340,400 of assets to generate $544,014.1 in value over time.
Microsoft Has the Edge
While both companies have a quantitative competitive advantage, Microsoft has the edge with an earnings power value that is 59.8% higher than its reproduction value. In contrast, Alphabet’s earnings power value is 41.1% higher than its reproduction value.
Pros and Cons of Earnings Power Value
The benefit of this method is that it allows investors to quantify a company’s competitive advantage in an easy-to-understand way. This reduces the need for investors to qualitatively try figuring out what makes a company better than others, a process prone to human error and misinterpretation of information.
The idea is that the qualitative factors should be reflected in the numbers, otherwise, a company is more prone to overpromising and underdelivering. In fact, companies that have an earnings power value greater than the total asset value tend to outperform the market as per our backtest below:
Finbox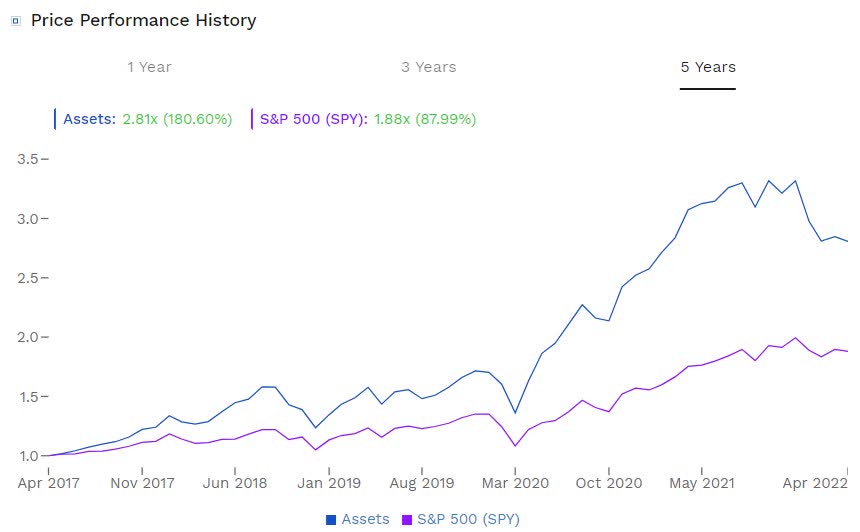
The only requirement for the backtest was that these companies had to have an EPV value greater than their total asset value in each of the last 5 years, using a 10% discount rate to be conservative. These companies returned 180.6% in the past 5 years compared to 87.99% for the S&P 500 (SPY).
Note: This data isn’t adjusted for dividends
This backtest was performed on 40 stocks of many different industries and sizes. You can see the different stocks pictured below. They range from megacaps like Apple (AAPL) and Meta Platforms (FB) to smaller companies like Williams-Sonoma (WSM), iRobot (IRBT), and WW International (WW).
Finbox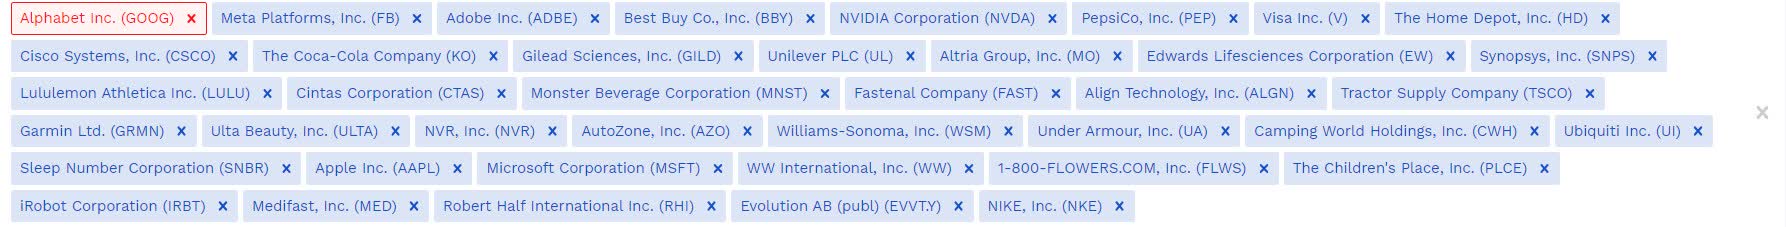
Interestingly, in the past decade, Microsoft shares have outperformed Alphabet shares quite significantly:
StockCharts.com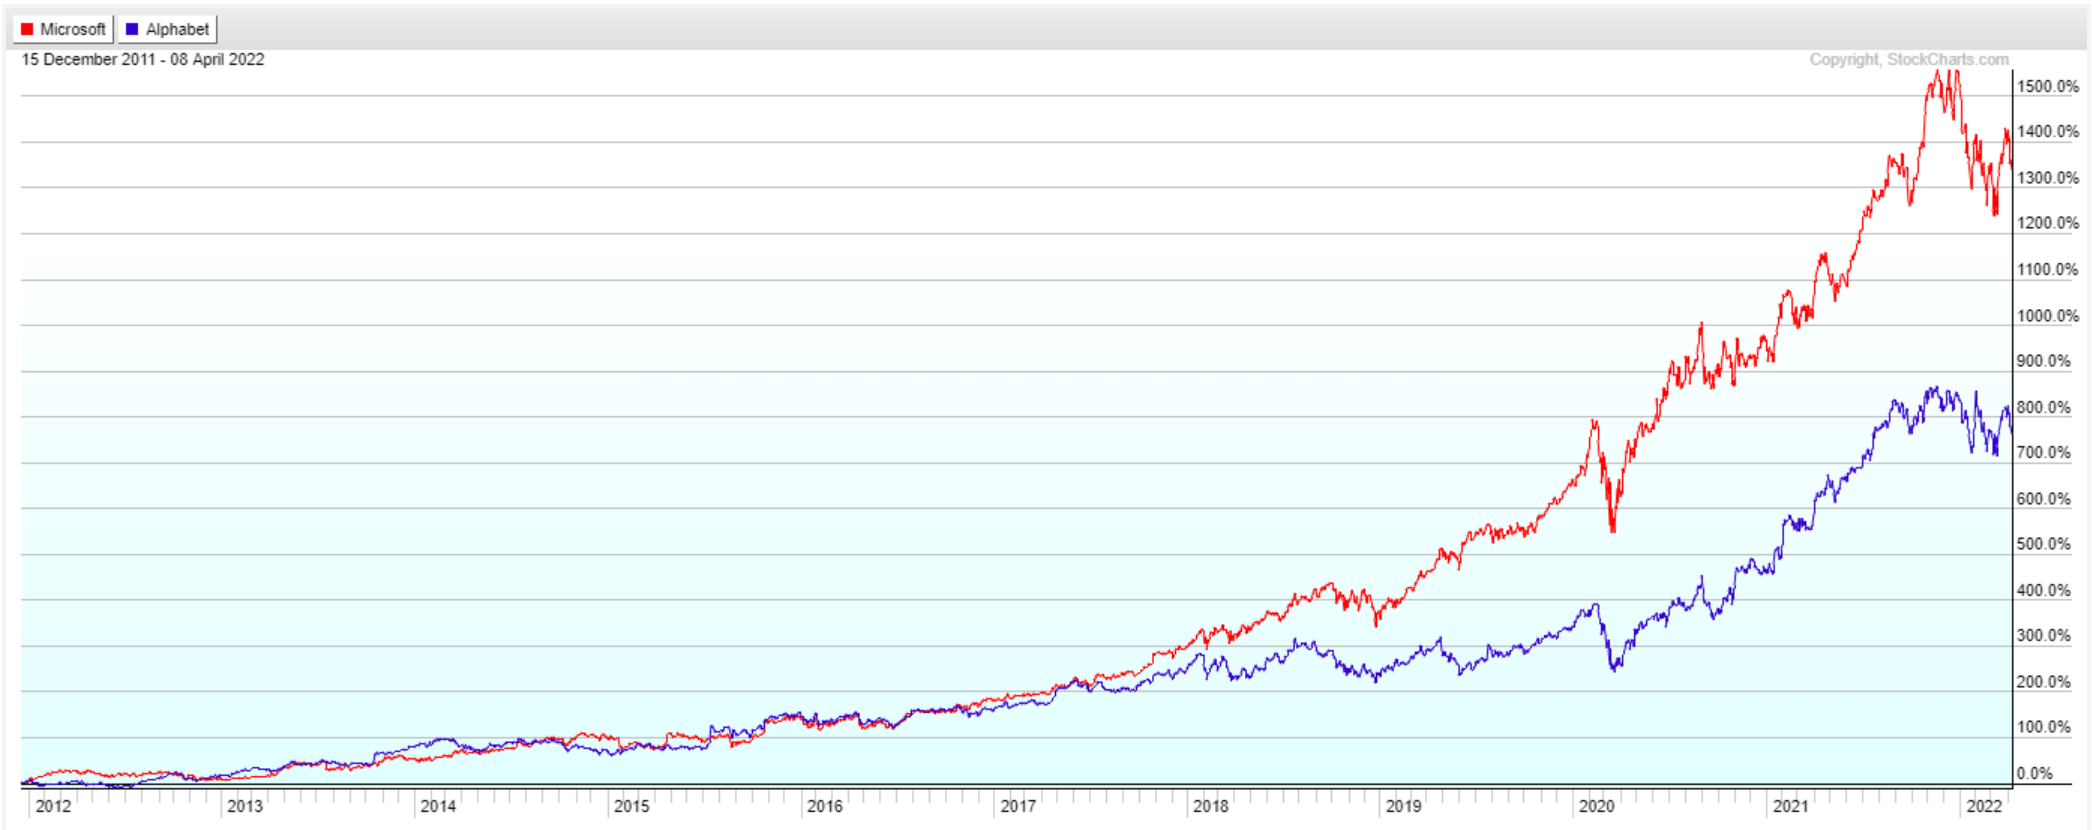
Thus, this is consistent with the idea that the more value a business generates above its total asset value, the better it should perform.
The drawback to this method is that it assumes no growth, thus eliminating many growth stocks that might have legitimate competitive advantages but have chosen to reinvest money into capturing more market share.
Thus, this type of analysis is best suited for mature companies that are more focused on profitability. However, if you do find a growth stock with profitability and an earnings power value that exceeds total asset value, then it is likely to be a strong performer.
Why Does Microsoft Have a Stronger Competitive Advantage?
Both companies have markets in which they dominate. Alphabet essentially has a monopoly in search engines with Google controlling over 90% of the market, whereas Microsoft’s Bing only has a 3.1% market share:
statcounter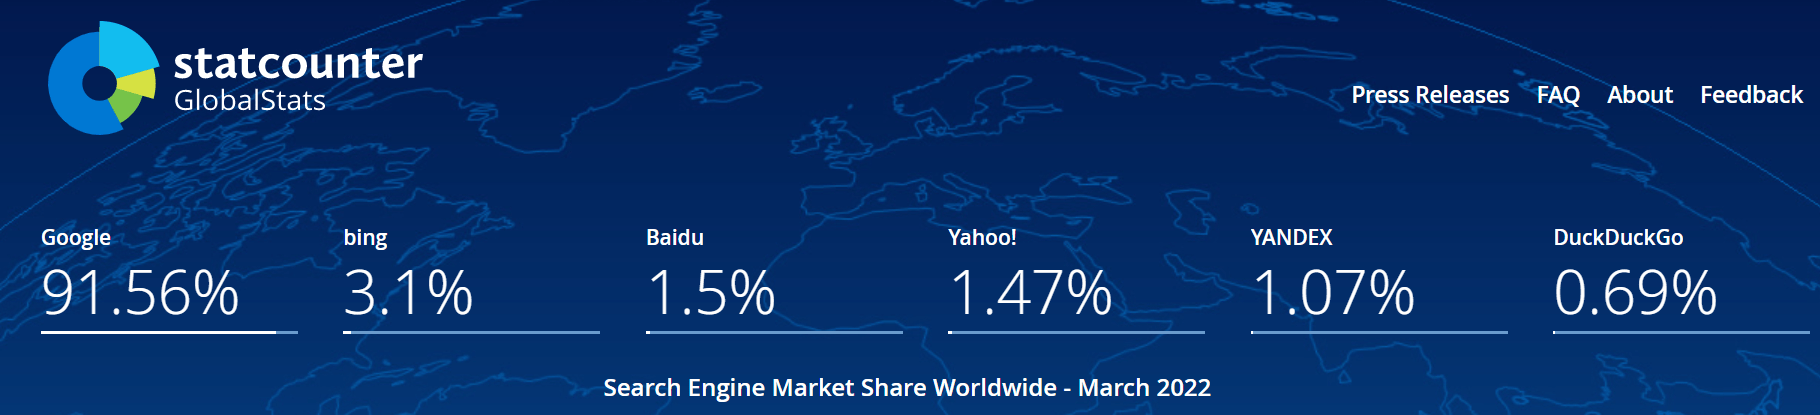
As a result, although Bing actually offers a better return on investment when it comes to advertising spending, marketers still prefer to use Google as a bigger part of their marketing strategy. Therefore, Microsoft can’t challenge Alphabet in this realm.
Furthermore, when it comes to smartphones, Alphabet’s Android operating system also holds a large share of the market.
statcounter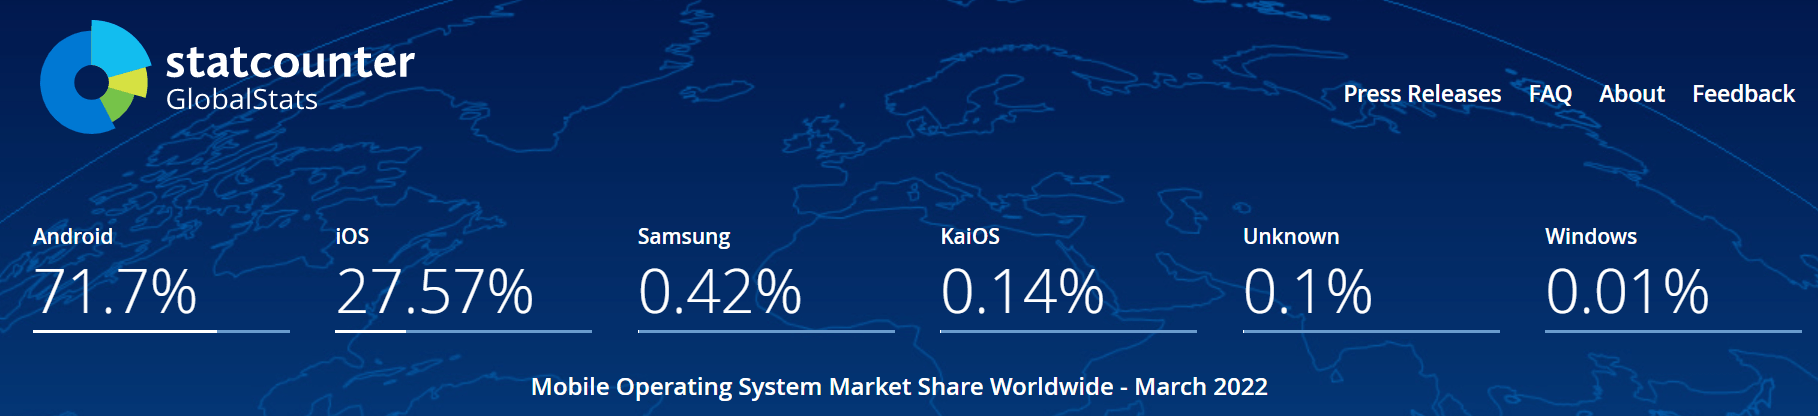
At 71.7% of the worldwide market, it dwarfs everyone else. Alternatively, Microsoft has never been able to make a meaningful impact in the smartphones market. This applies to both an operating system and hardware. However, we believe the reason why Microsoft might have a stronger competitive advantage is due to its gaming and cloud businesses.
The gaming market was valued at almost $200 billion in 2021 and is expected to grow at a compound annual growth rate of 8.94% from 2022 to 2027. That would equate to a market value of almost $340 billion. Between its Xbox consoles and its xCloud cloud gaming platform, Microsoft controls about 6.5% of the market. If its Activision acquisition goes through, its market share will be bumped to 10.7%.
Of course, it’s likely that Microsoft will face a tough time with regulators. Nonetheless, the company is confident that the deal will go through as it has agreed to pay Activision between $2-3 billion in breakup fees should the merger be rejected by regulators. Considering that the gaming industry is quite fragmented, Microsoft has a good reason to be confident, especially with a combined market share of only 10.7%.
Mordor Intelligence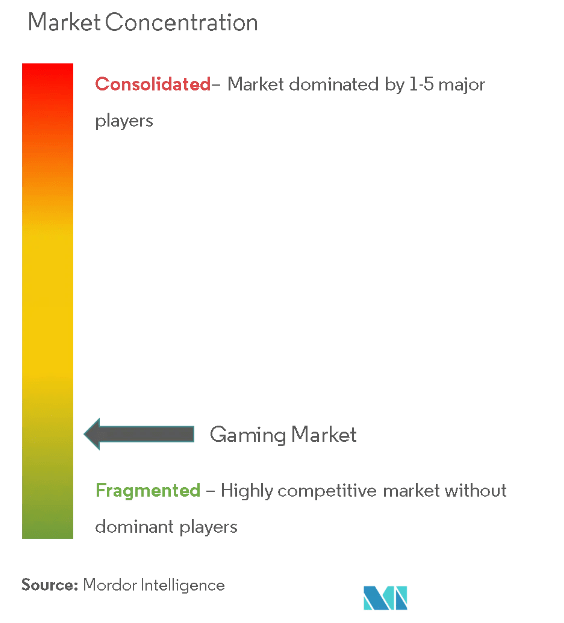
On the other hand, Alphabet hasn’t been able to make a meaningful impact in the gaming market. The company had launched Google Stadia in 2019, with the goal of disrupting the gaming industry with cloud gaming. However, it failed to catch on, and most people have not really heard about it. As a result, Alphabet has so far not been able to capitalize on a very lucrative gaming industry.
Nonetheless, we believe the most important catalyst for Microsoft’s larger competitive advantage is the platform powering its xCloud – Microsft Azure. The cloud computing market is valued at almost $370 billion and is larger than the gaming market. It is also expected to grow at a faster rate, increasing at a CAGR of 15.7% from 2022 to 2030.
Azure currently has more than double the market share of Google in this space, at 21% versus Google’s 10%, although both trail AWS (AMZN).
Statista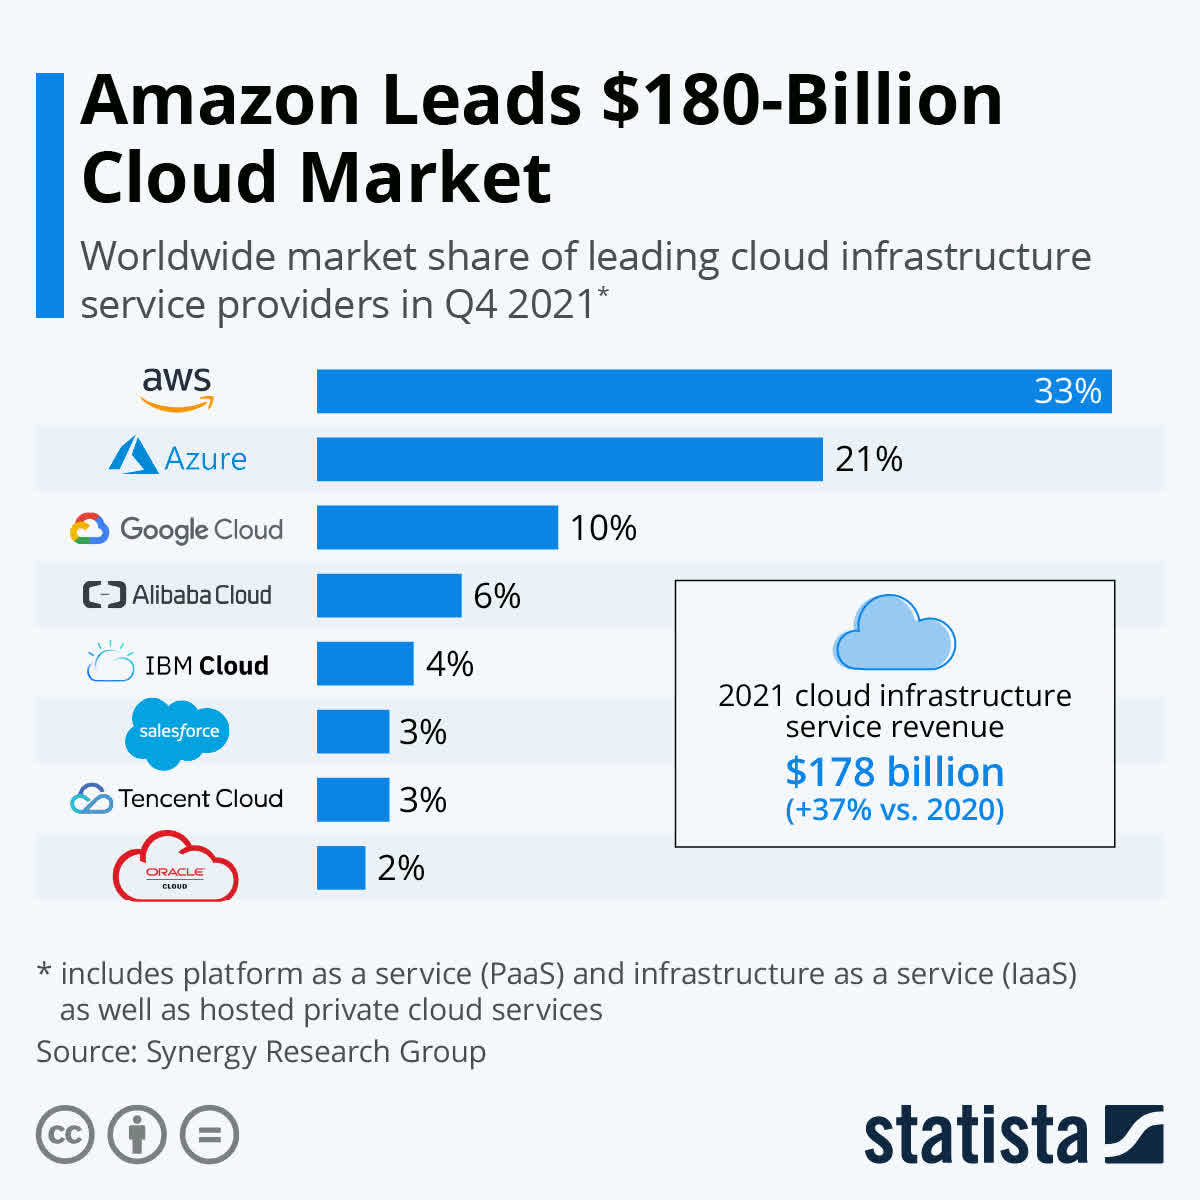
The top three players have each gained market share from Q1 2021, with Google actually seeing the largest increase, going from 7% to 10%.
Canalys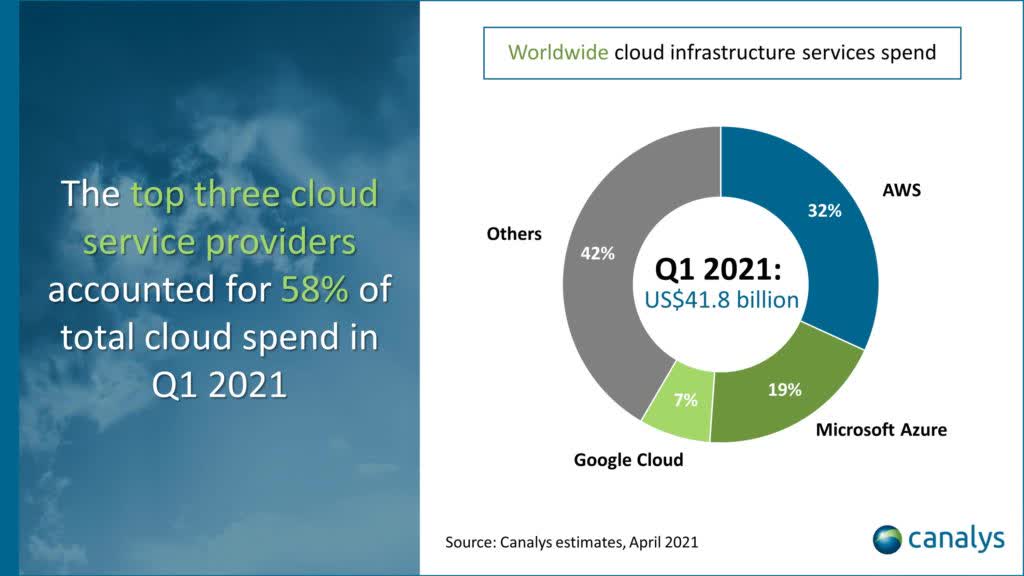
Although it’s good to see Google Cloud pick up steam, we have to remember that it is playing catch-up with Azure and AWS. Thus, Google cloud is still not profitable, racking up $890 million in operating losses in the most recent quarter. Azure, however, is very profitable with an operating income of $8.2 billion in Microsoft’s most recent quarter.
Azure’s operating income is greater than Google Cloud’s $5.5 billion revenue and almost as much as YouTube’s $8.62 billion revenue in Q4 2021. It’s also important to remember that Microsoft has a big presence in the social media space with LinkedIn, which generated $3.5 billion of revenue in the most recent quarter.
As a result, we believe that the two segments of gaming and cloud computing are likely the reason why Microsoft’s earnings power value is relatively greater than that of Alphabet.
Valuation
Alphabet
To value Alphabet, we will use the H-Model, which is similar to a three-stage DCF model. The H-Model assumes that growth will decelerate linearly over a specified period of time. We believe this is a reasonable assumption as companies gradually slow down as they mature. The formula is as follows:
Stock Value = (CF(1+tg))/(r-tg) + (CF*H*(hg-tg))/(r-tg)
Where:
- CF = free cash flow per share (excludes stock-based comp)
- tg = terminal growth rate
- hg = high growth rate
- r = discount rate
- H = half-life of the forecast period
For Alphabet, we used the following assumptions:
- CF = $76.3 per share
- tg = 2.746% (used 30-year U.S. Treasury yield)
- hg = 20.5% (based on analysts’ estimates)
- r = 7.0%
- H = 5 years (we are assuming it will take 10 years to reach terminal growth)
As a result, we estimate that the fair value of Alphabet is approximately $3,435.04 under current market conditions.
However, market conditions are always changing along with the discount rates. Furthermore, it’s possible that the time it takes to reach the terminal growth rate might be different than our assumption. As a result, we created the table below to show the valuation at different discount rates and time horizons for reaching terminal growth:
Image created by the author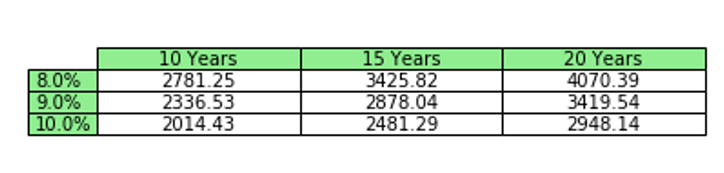
Microsoft
Using the same method, Microsoft’s valuation is as follows:
Stock Value = (CF(1+tg))/(r-tg) + (CF*H*(hg-tg))/(r-tg)
Where:
- CF = $7.15 per share
- tg = 2.746% (used 30-year U.S. Treasury yield)
- hg = 16.1% (based on analysts’ estimates)
- r = 7.0%
- H = 5 years (we are assuming it will take 10 years to reach terminal growth)
As a result, we estimate that the fair value of Microsoft is approximately $284.92 under current market conditions. Its valuation under different market conditions is in the table below:
Image created by the author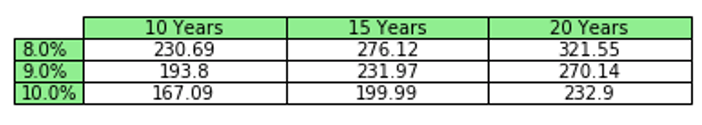
Alphabet Has a Better Valuation
Based on our estimates, it appears that Microsoft is overvalued while Alphabet is undervalued. Therefore, Alphabet has a much greater margin of safety in terms of intrinsic value.
Risks
When it comes to risks, both companies essentially face the same issues. Scrutiny from regulators will always be a thorn in the side of each company, although Microsoft has not been targeted as much as the other big tech names. The Activision acquisition will undoubtedly gain a lot of attention from regulators before (and if) it gets approved.
Moreover, whenever companies make large acquisitions, they always run the risk of not being able to realize the perceived synergies. This is usually due to poor execution in integrating the newly acquired business into the firm. Alphabet’s recently announced acquisition of Mandiant also faces this risk. Thus, this is something for investors to keep in mind although both companies have a good track record of acquiring companies.
Lastly, the Federal Reserve’s aggressive approach to quantitative tightening might turn out to be greater than what the market expects. As a result, it will push bond yields higher, causing discount rates to increase and valuations to decrease.
Final Thoughts
In the long term, investors can’t really go wrong investing in either company. Nevertheless, it currently seems that Microsoft has the stronger business while Alphabet has the better valuation. That being said, it would appear that the market has already priced Microsoft’s competitive advantage while significantly mispricing Alphabet’s ability to continue improving.
Of course, if Microsoft can continue growing above the terminal growth rate for longer than expected, then it would likely also be undervalued. However, based on the information we have today, as well as the potential for greater bond yield increases, we would prefer investing in Alphabet simply because the valuation offers a greater margin of safety.
Be the first to comment