

Getty Images
Price Action Thesis
Morgan Stanley (NYSE:MS) is scheduled to report its Q2 earnings on July 14, as financial institutions (FI) start the Q2 report card in earnest. MS has outperformed the SPDR S&P 500 ETF (SPY) and its broad FI peers over the past five years.
However, our price action analysis suggests that MS remains deeply mired in a bearish flow, weighed by a persistent distribution phase. Even though it no longer seems overvalued compared to its historical metrics, we don’t consider it undervalued, given the worsening macros.
Furthermore, Morgan Stanley’s adjusted EPS growth is projected to decelerate markedly moving forward. Therefore, we believe it’s reasonable for MS to trade at a reasonable discount against its 5Y P/E mean to compensate for slower growth.
As a result, we rate MS as a Hold for now.
Morgan Stanley Still Looks Well-Extended
MS price chart (monthly) (TradingView)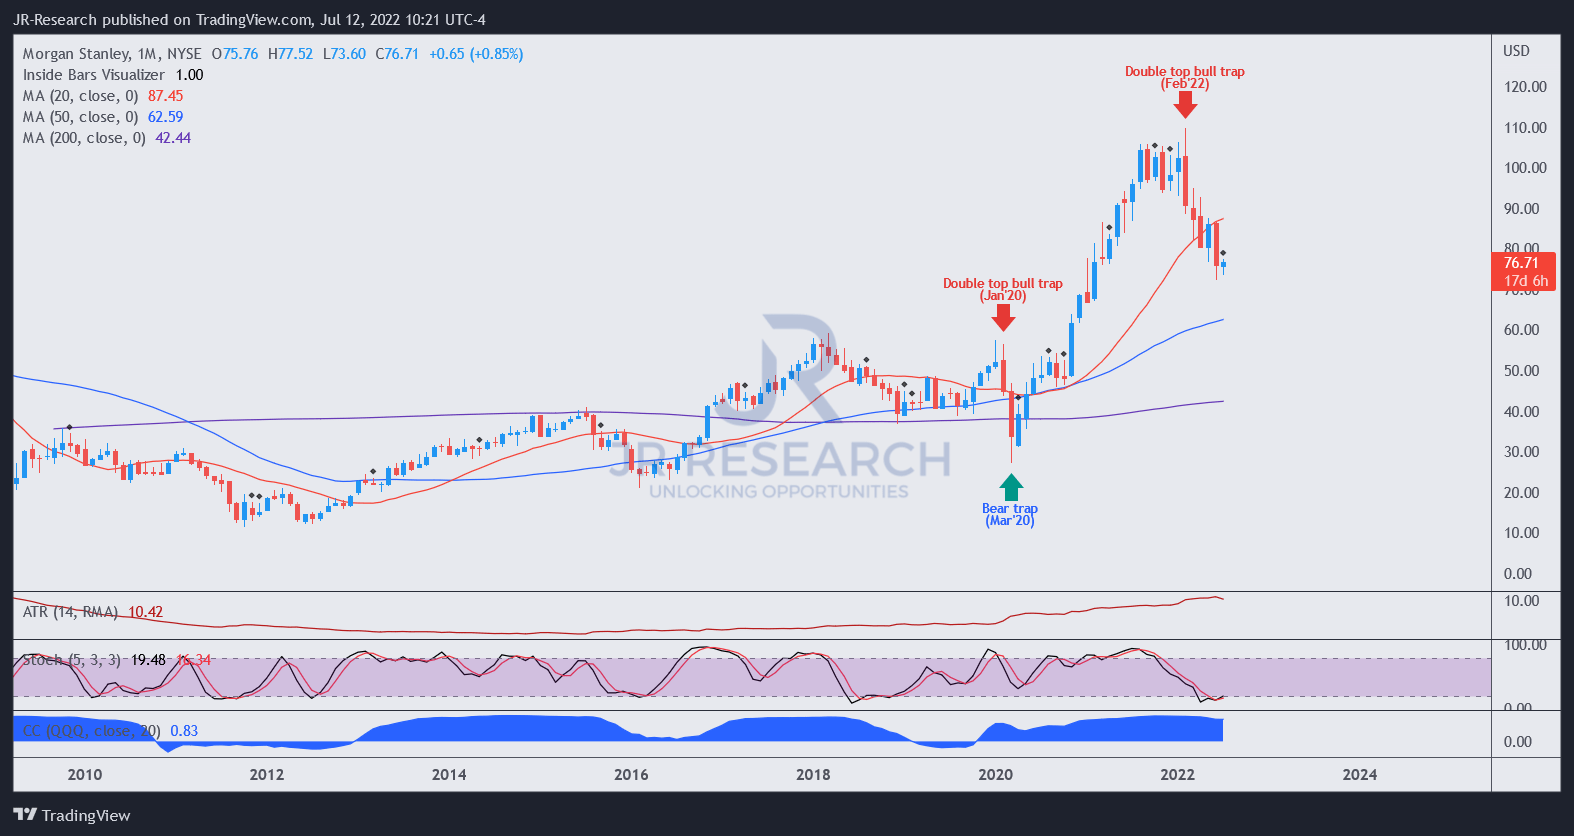
MS mounted a tremendous surge from its March 2020 bear trap (significant rejection of selling momentum) that was resolved by a double top bull trap (significant rejection of buying momentum) in February 2022.
Therefore, it corroborated our observation that the consolidation zone between August 2021 and February 2022 was a distribution phase, as astute investors left “quietly.” Following the bull trap, the market sent MS into a rapid liquidation, falling more than 30% from its highs.
However, we also observed that MS remains relatively extended, and the market could still possibly digest the remarkable gains from 2020-22.
MS price chart (weekly) (TradingView)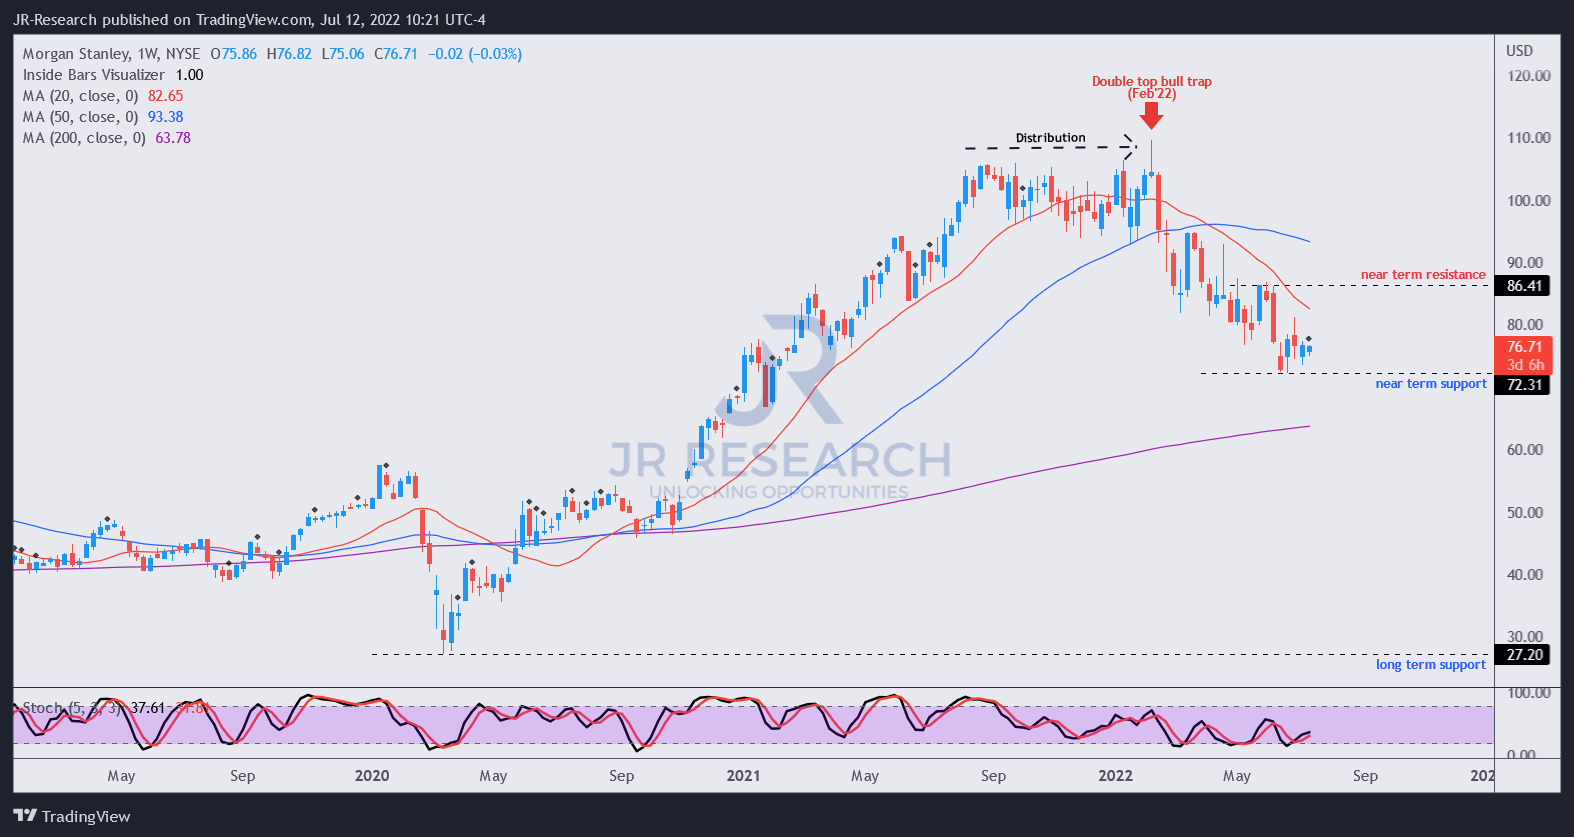
Moving over to its weekly chart, we can glean its price structures more clearly. Note that its medium-trend has already turned bearish. February’s double top bull trap reversed its bullish bias that underpinned its advance since March 2020’s bear trap.
The critical point is that we have yet to observe any significant rejection of selling pressure. Given its dominant bearish bias, a short-term bottom is likely tenuous for buy-the-dips opportunities without a bear trap to support it.
As a result, the right move is to find appropriate directionally-bearish set-ups leveraging bull trap price structures.
A possible set-up could occur at its near-term resistance, as MS has been trying to stage a bottom since mid-June. Notwithstanding, we accord lesser significance to its bottoming process due to its negative flow.
Therefore, we encourage investors looking to buy the dips to remain patient until more constructive price action signals form that could help stanch its bearish momentum.
Otherwise, opportunistic investors/traders can still capitalize on short bets at the appropriate entry levels.
MS Stock Is Not Cheap Enough Yet
MS NTM normalized P/E (TIKR)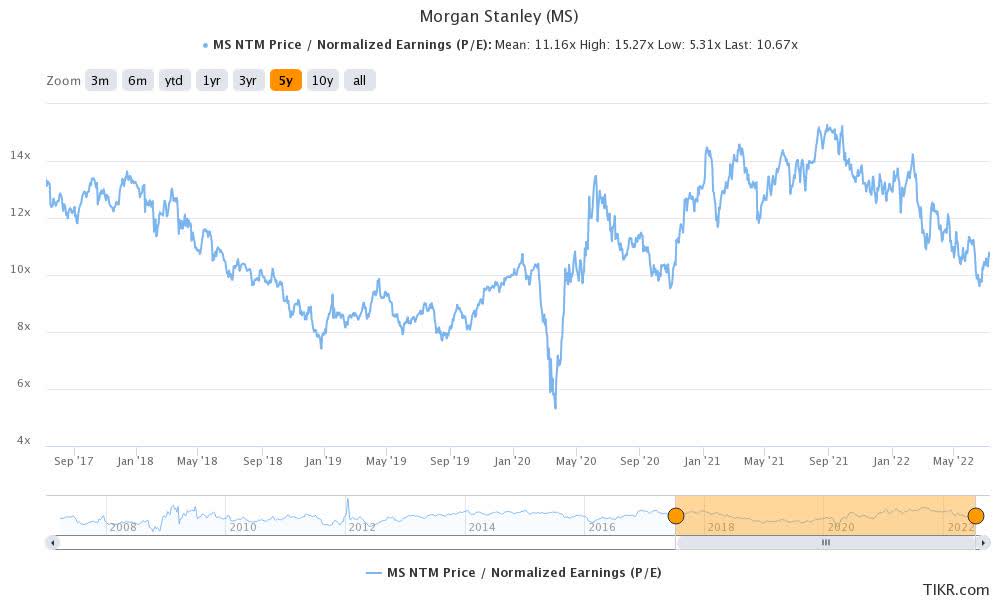
MS last traded at an NTM normalized P/E of 10.67x, slightly below its 5Y mean of 11.16x. However, we believe the current discount is justified, as Morgan Stanley’s adjusted EPS is expected to slow markedly.
Morgan Stanley adjusted net margins % and adjusted EPS change % consensus estimates (S&P Cap IQ)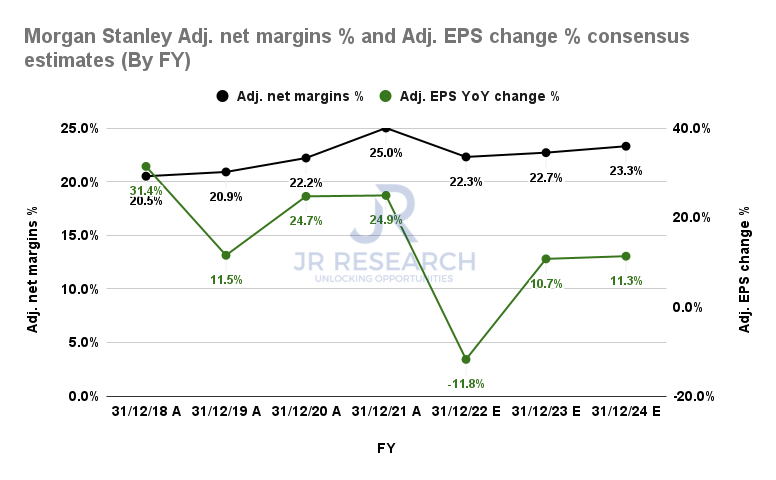
Morgan Stanley posted a 5Y EPS CAGR of 22.4%. Therefore, we believe it has helped MS outperform its broad banking peers, as MS notched a 5Y total return CAGR of 13.64%.
However, even the bullish consensus estimates suggest that Morgan Stanley’s adjusted EPS growth is projected to decelerate markedly through FY24 after bottoming in FY22.
Therefore, we believe the market’s de-rating of MS since February 2022 is warranted, as it’s not expected to sustain its outperformance.
Hence, we don’t think a slight discount from its 5Y average P/E is justified. Instead, we believe the market could continue to digest its valuation further after completing its current consolidation phase.
Is MS Stock A Buy, Sell, Or Hold?
We rate MS as a Hold for now.
We get it. MS has fallen more than 30% from its February highs. However, it still looks well extended on its long-term charts. Furthermore, it’s deeply entrenched in a bearish flow on its medium-term charts, with little indication of a sustained bottom currently.
Moreover, its adjusted EPS growth is expected to fall markedly. Therefore, we believe its current valuation is too high to justify much slower growth ahead.
Be the first to comment