


kentoh/iStock via Getty Images
Investment thesis
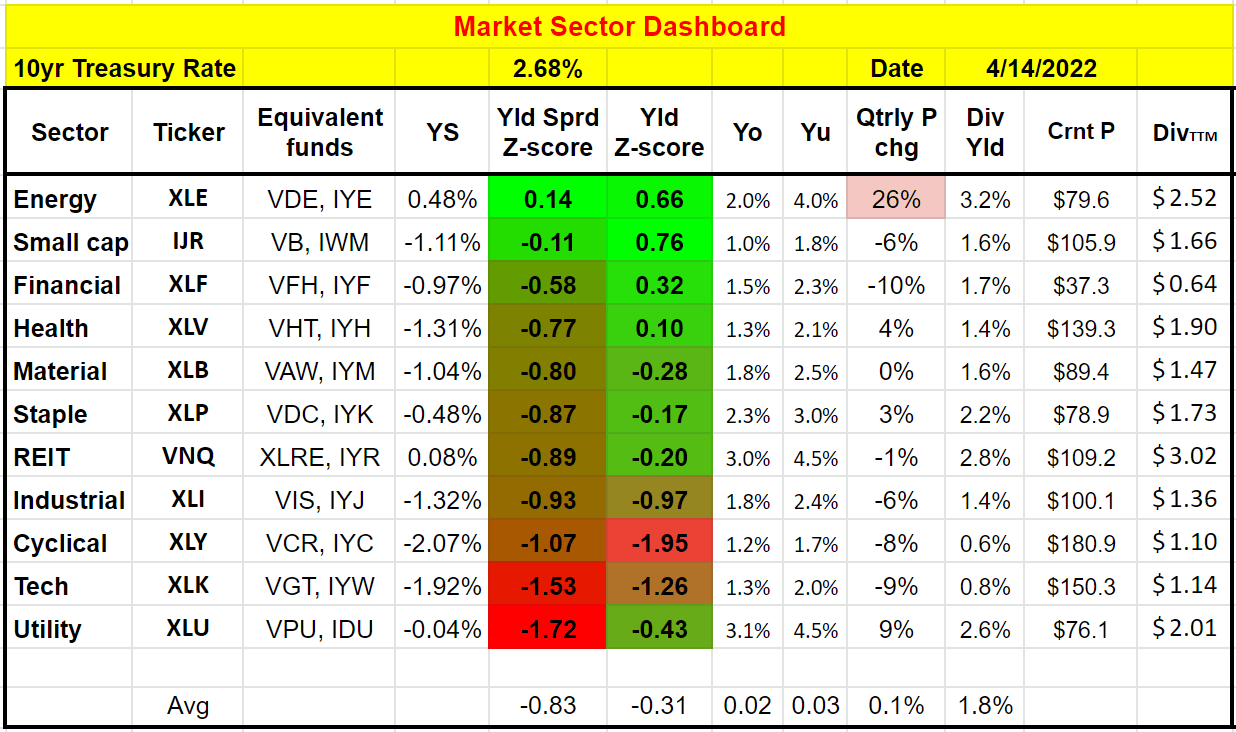
Both Morgan Stanley (NYSE:MS) and Goldman Sachs (NYSE:GS) reported earnings on 04/14/2022 before market open. Before diving into their specifics, it’s helpful to first take a 30,000 feet view of the overall market and the financial sectors as shown by our market dashboard below so we can better anchor the detailed discussions. Details of the dashboard are explained in our earlier article and feel free to download or export the google-sheet via this link: Market Sector Dashboard.
Author
Under the backdrop, the thesis of this article is that:
- The financial sector (represented by XLF) is one of the few sectors that’s fairly valued relative to the risk-free rates as measured by their dividend yields and yield spread relative to the treasury rates (more on this later).
- Specific to MS and GS, the market has been expecting a pullback in both revenues and earnings this quarter given the record set in the same quarter last year. The monetary tightening in recent quarters was expected to mute M&A and IPO activities. And their earnings releases this morning confirmed such expectations.
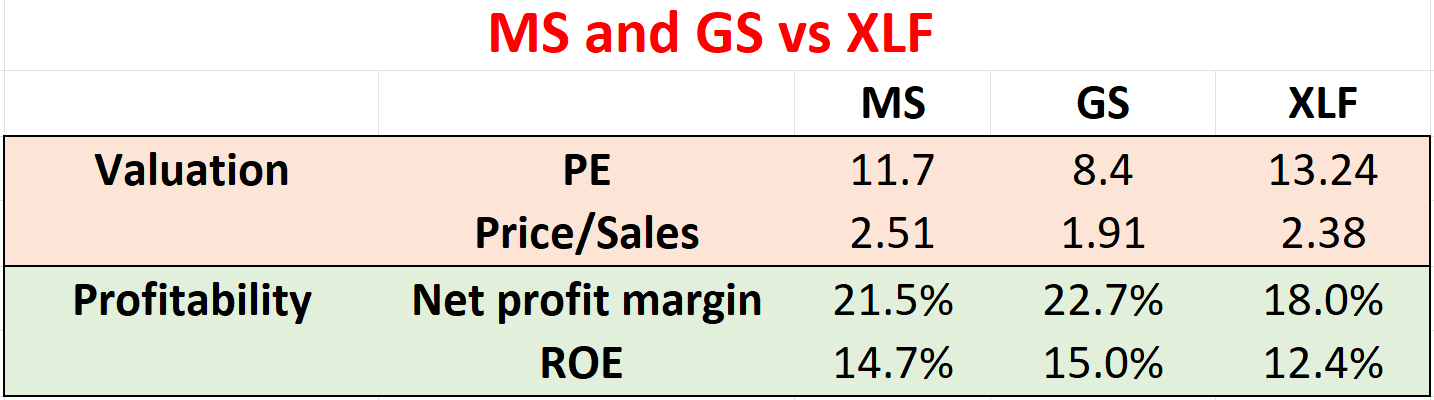
- My view is that the above pullbacks have already been fully priced in. These premium banking stocks are now quite attractively valued both in absolute and relative terms (both relative to their own historical valuation, to the sector, and to the overall market) as you can see from the following chart (the data here are either taken from Yahoo Finance or Seeking Alpha). They also offer higher profitability and safety than the sector. As such, our recommendations are “BUY” for both of them.
Finally, note that the remainder of this article is based on the price information before market open on 4/14. And the prices may have changed a bit when you are reading it.
Author
MS earnings highlights
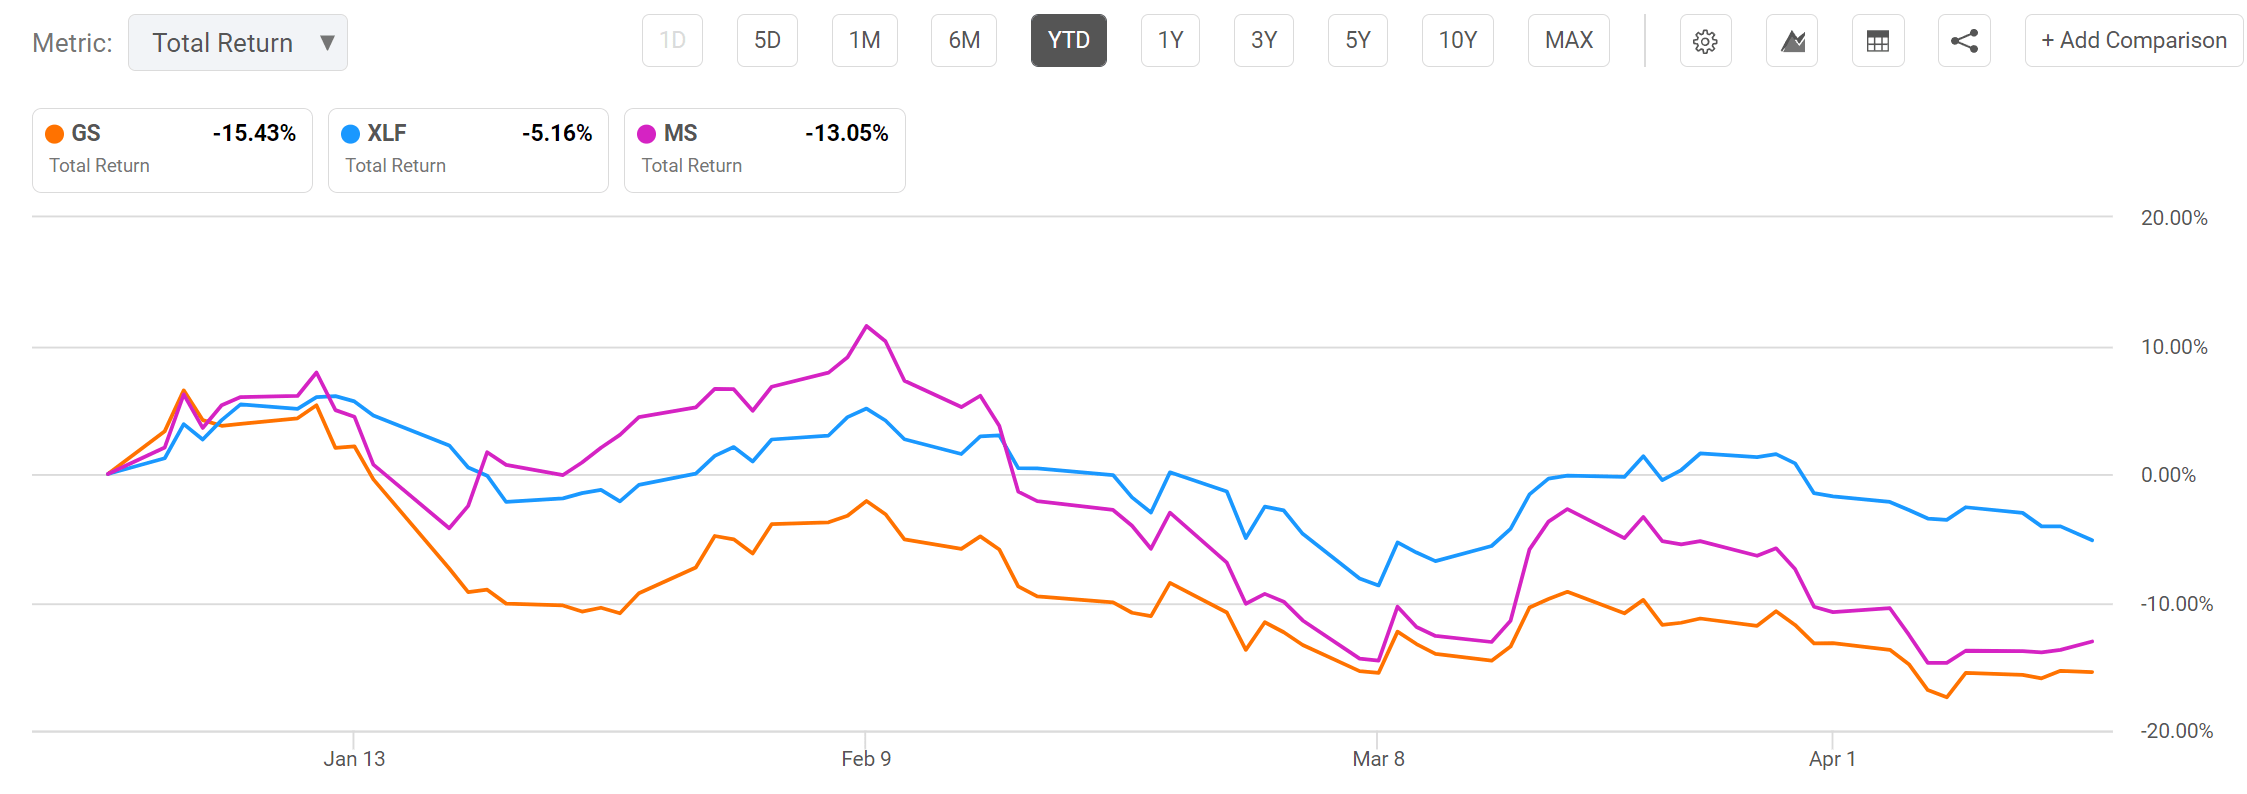
As aforementioned, the market has been expecting a pullback in both revenues and earnings this quarter for both banks, as reflected in their prices below. The prices of MS and GS have declined by about 15% and 13%, respectively YTD, in anticipation of the pullback.
Seeking Alpha
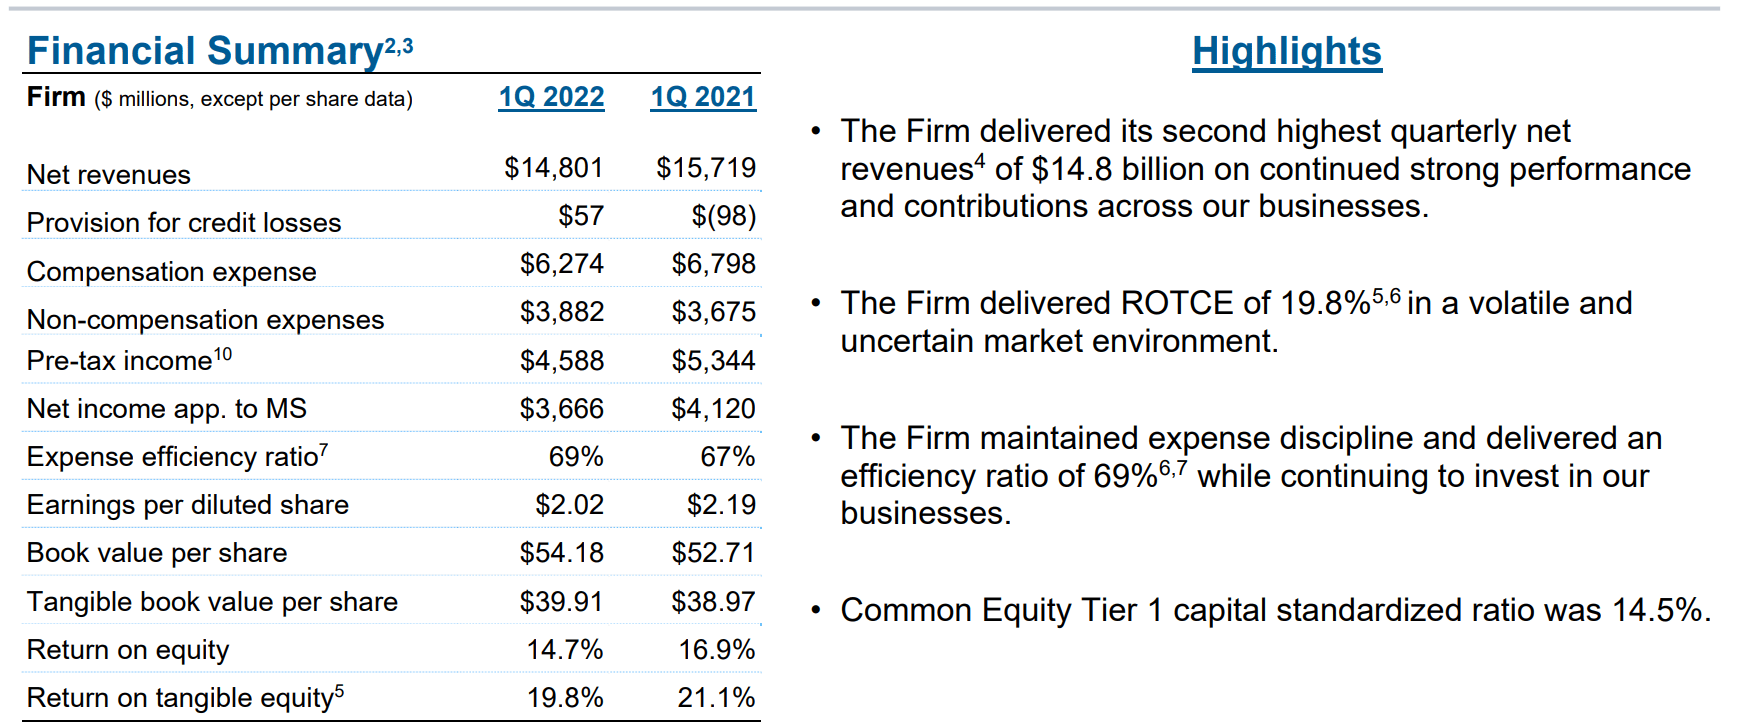
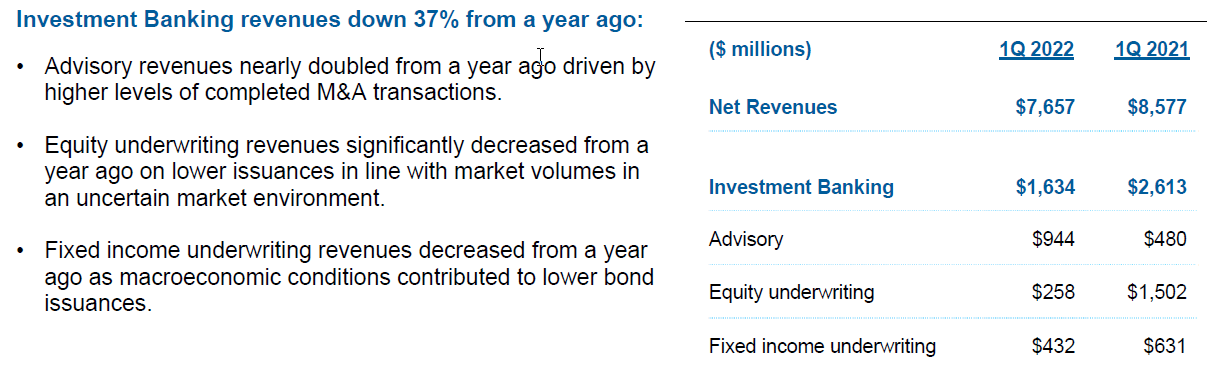
The earnings release this a.m. confirmed such expectations. For MS, both top line and bottom line were lower than in the same quarter last year. Morgan Stanley Reports Net Revenues of $14.8 billion, EPS of $2.02, and ROTCE of 19.8%. The net revenue was lower than one year ago by about 6% and EPS by about 8%, from a combination of revenue decrease and an increase in expenses. On the expense front, the efficiency ratio increased to 69%, 2% above last year’s level in the same quarter, despite the firm’s efforts to maintain expense discipline. In particular, investment banking revenues were down 37% from a year ago given the record set a year earlier.
MS earnings release
Although I won’t worry too much about the pullbacks besides the tough comp, for a few additional reasons.
First, the profitability is still very healthy. The firm delivered an ROE (return on equity) of 14.7% during this quarter, a bit lower than last year, but still significantly above its historical average and also the sector average. And ROTCE (return on tangible equity) was 19.8% as you can see from the chart above, quite an impressive level in a volatile and uncertain market environment.
Secondly, MS has further diversified its revenue streams through its recent acquisitions of E*TRADE and Eaton Vance. As the integration of these acquisitions progresses, the augmented diversification will help MS to better growth despite the Fed plan of further monetary tightening in the coming quarters. As the Chairman and Chief Executive Officer, James Gorman, commented,
The E*TRADE integration continues to go very well, and given the current path we are on, a significant portion of the integration will be done by the end of this year. By the end of 2022, we expect to no longer separate our integration expenses.
MS earnings release
GS earnings highlights
Similarly, GS also reported a lower topline and bottom line for 1Q22 compared to the same quarter a year ago given the tough comparison set in 1Q21. Net revenues were 27% lower compared with the record set a year ago. Especially, the revenues from investment banking decreased by 36% YoY. The net revenues in Asset Management also decreased substantially. However, given the smaller role of the Asset Management segment, its absolute impact is much smaller.
GS earnings release
For reasons similar to MS, I’m not too concerned about the pullback. The pullback is largely a result of the tough comparison set up by the record quarter last year. Furthermore:
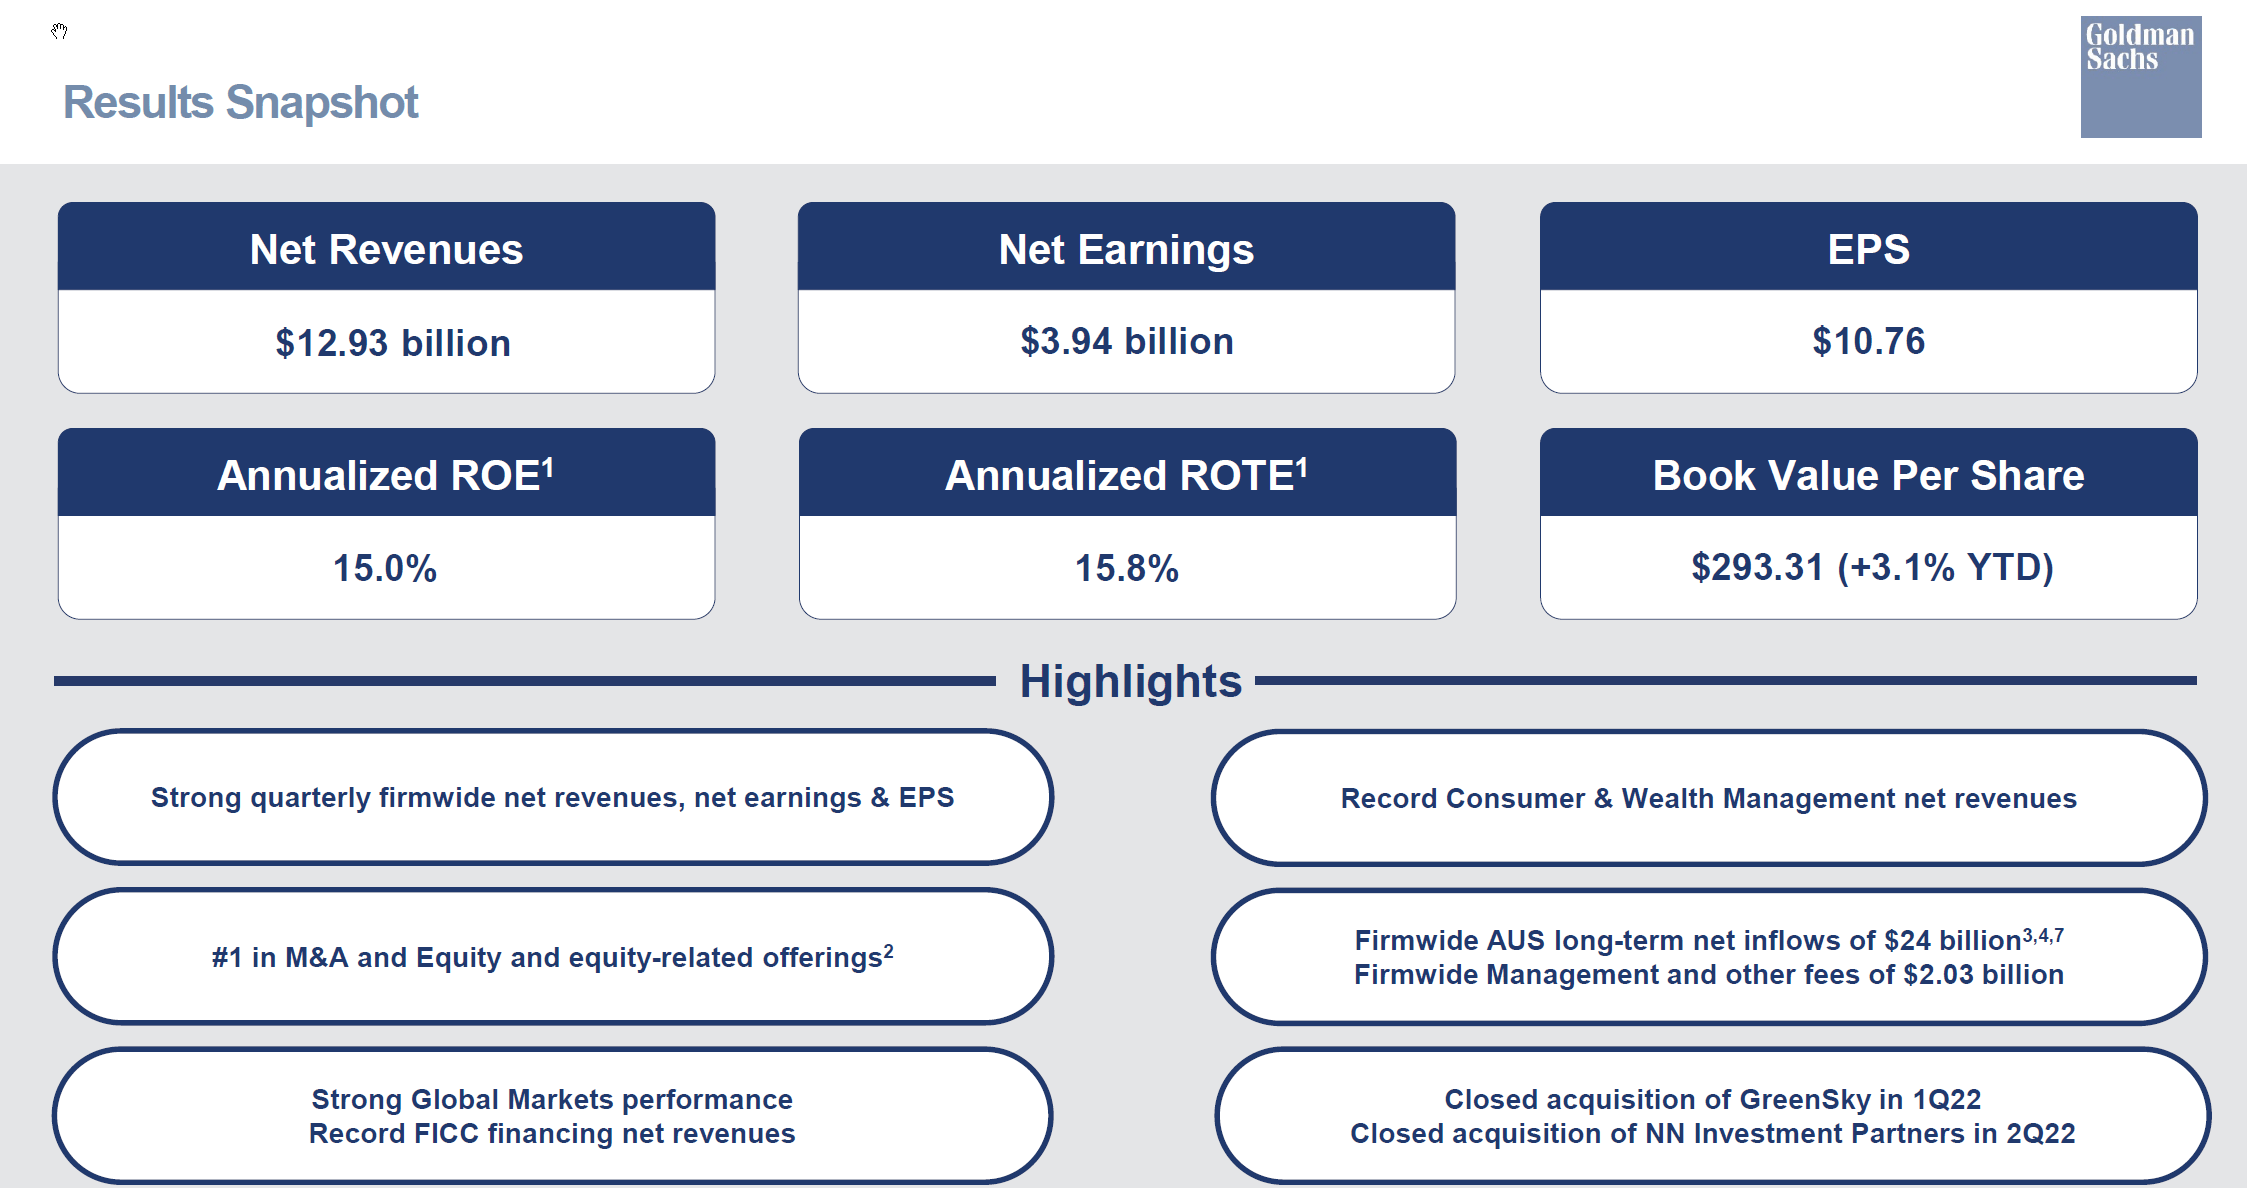
- The firm also delivered very impressive profitability. It delivered an annualized ROE of 15.0% during this quarter and a ROTE (return on tangible equity) of 15.8%, again significantly above its historical average and also the sector average.
- GS’ recent acquisitions of NN Investment Partners and GreenSky also help to further strengthen its strategic positions. It closed its acquisition of GreenSky in 1Q22 and the NN Investment Partners in 2Q22. Both should help GS to grow in changing rate and monetary environments.
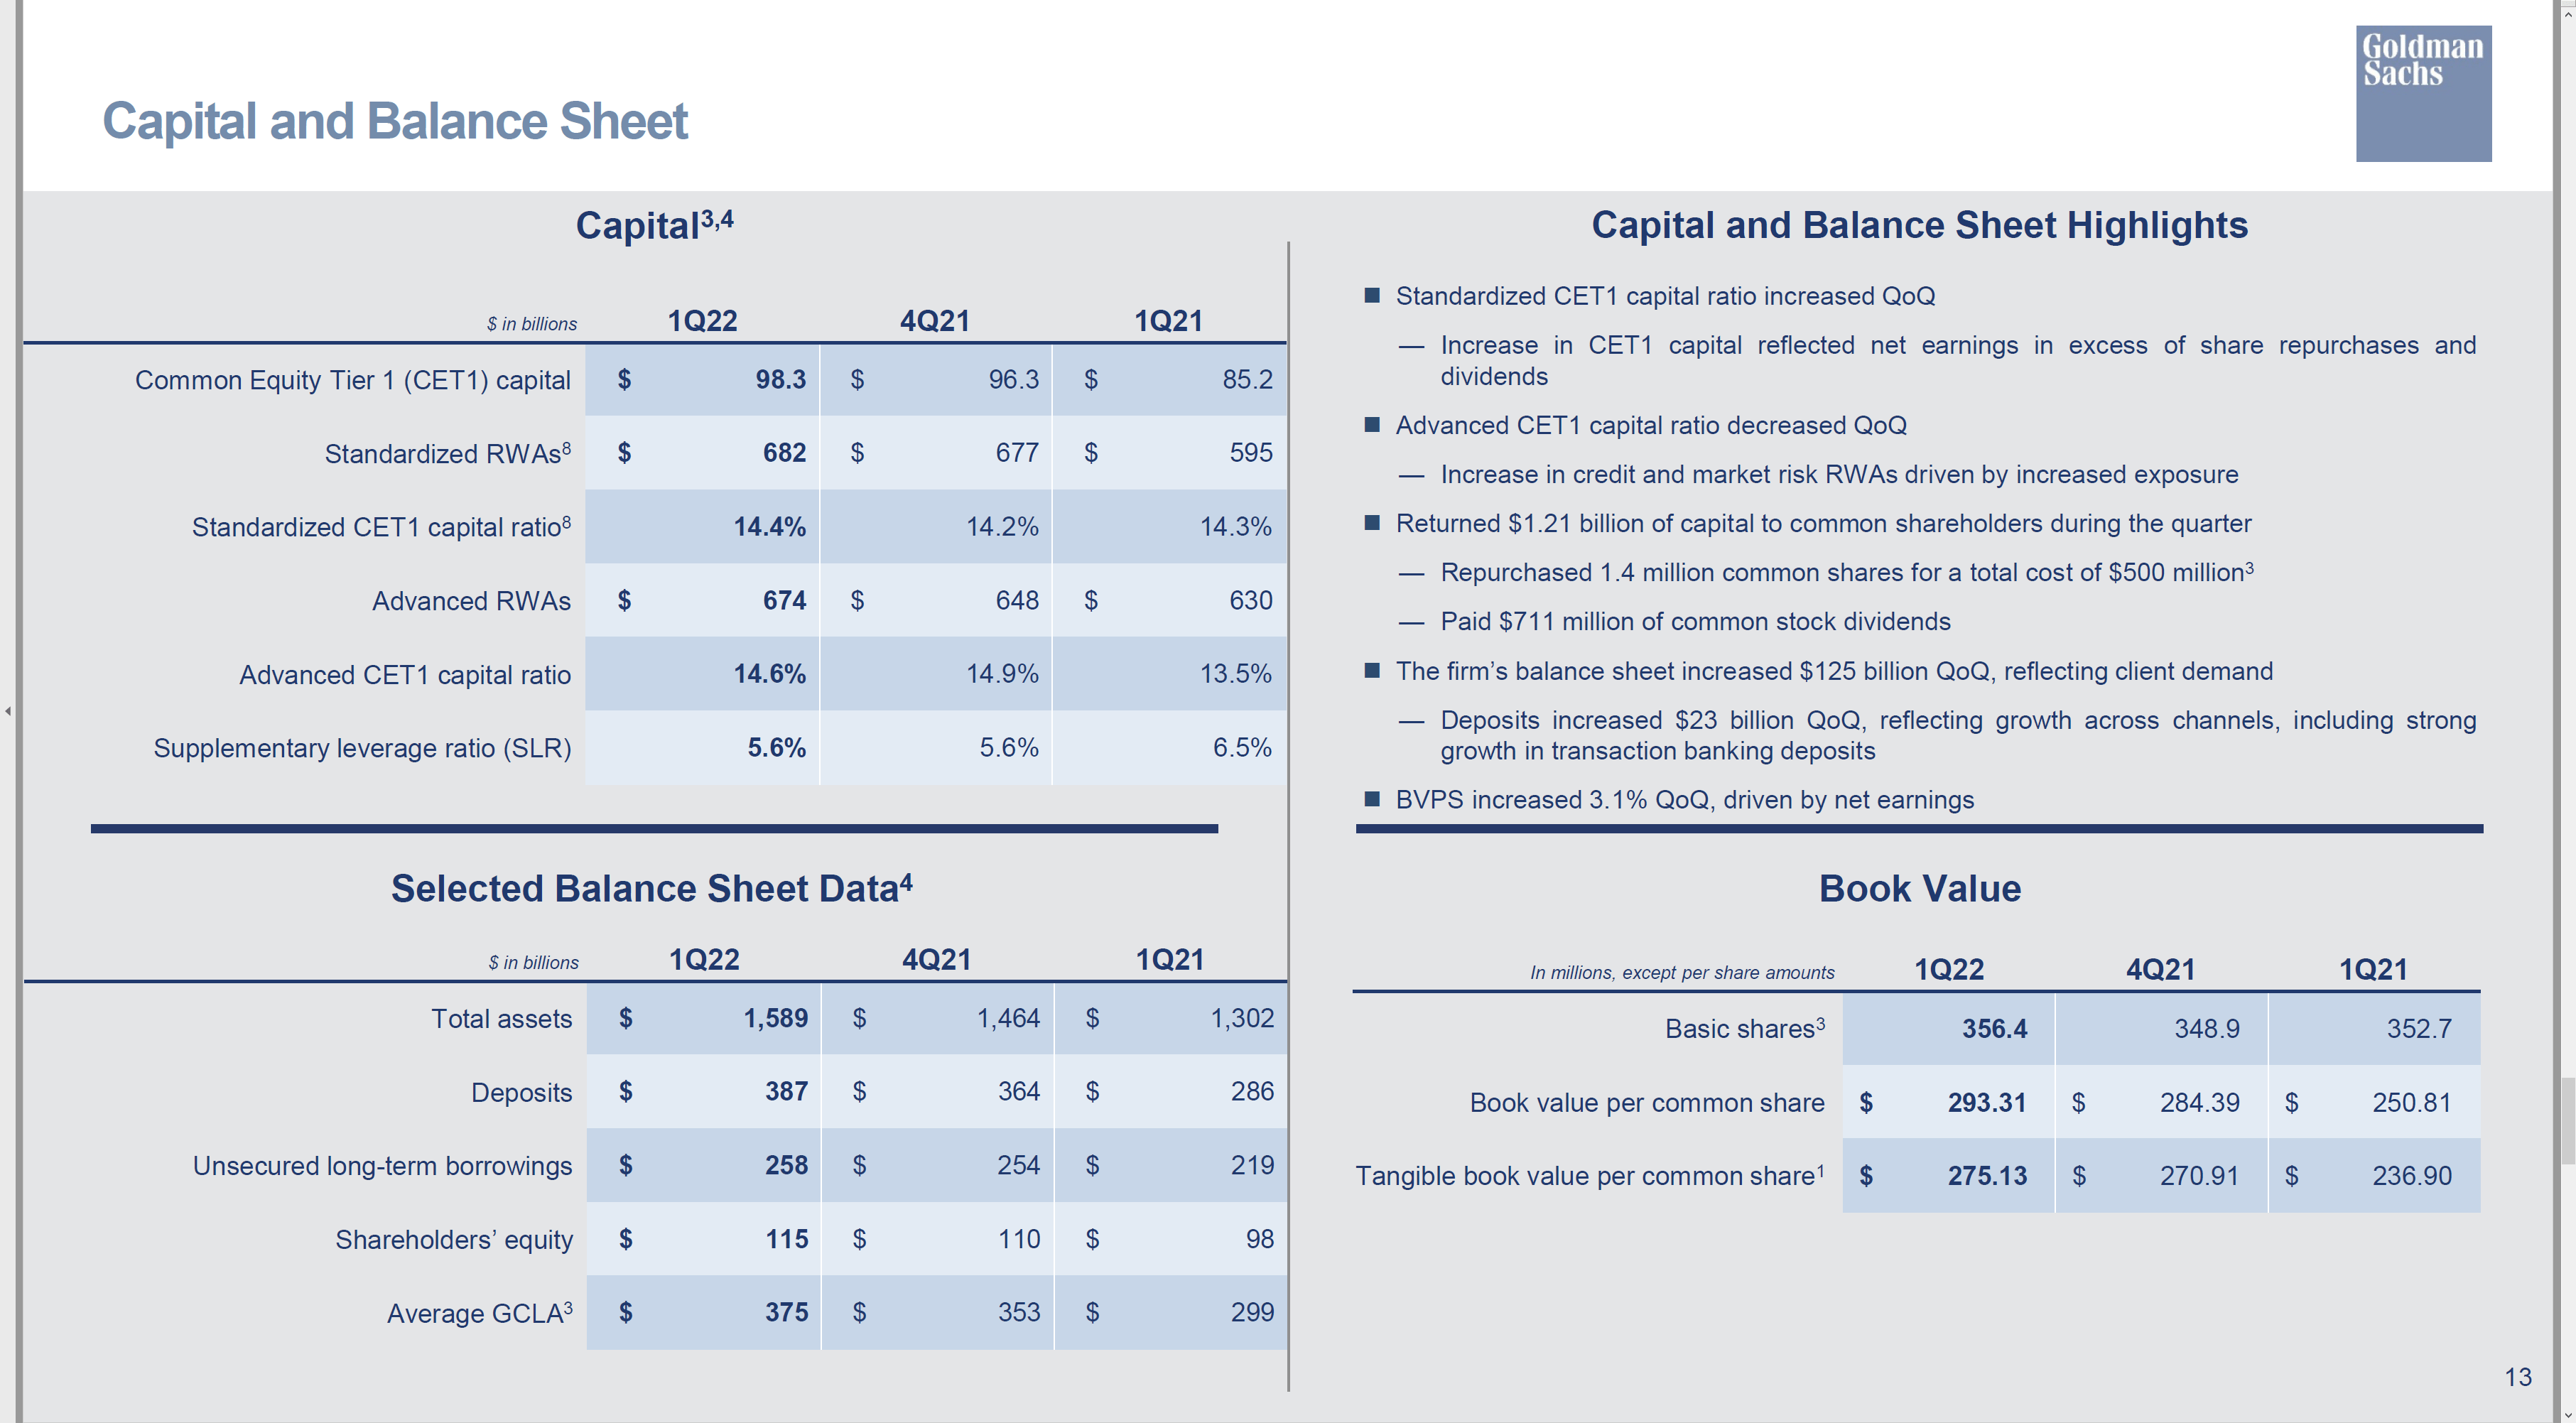
- Its balance sheet increased by $125billion QoQ. Standardized CET1 capital ratio and advanced CET1 capital ratio both remained at a very consistent and comfortable level around 14.5%. On a yearly and per-share basis, its Book Value Per Share has grown by about 3.1% YoY to $293 per share. Combining the price correction recently and the growth of its book value, now the stock is priced at only about 1.09x of its book value, a very attractive valuation, as examined more closely next.
GS earnings release
GS and MS: Valuation and yield spread relative to risk-free rates
Now on to valuation. As mentioned earlier, both MS and GS are attractively valued both in relative (e.g., relative to the financial sector and the overall market) and absolute terms (e.g., PE and Price to book ratios).
Another effective way to evaluate their valuations is by their dividend yield, and an effective way to evaluate their relative valuations is by their dividend yields either relative to each other or relative to the risk-free rates. Details of these concepts and approaches have been provided in our earlier article. Dividends yields and yield spread are what we first check before making any investment decisions. We’ve fortunately had very good success with this approach because of:
- The common PE, Price/sales, or price to book multiples provide partial and even misleading information due to the differences between accounting earnings and owners’ earnings.
- Dividends provide a backdoor to quickly estimate the owners’ earnings. Dividends are the most reliable financial information and least open to interpretation. In investing, we always prefer a simpler method that relies on fewer and unambiguous data points rather than a more complicated method that depends on more ambiguous data points.
- The dividend yield spread (“YS”) is based on a timeless intuition. No matter how times change, the risk-free rate serves as the gravity on all asset valuations and consequently, the spread ALWAYS provides a measurement of the risk premium investors are paying relative to risk-free rates. And similarly, the yield spread between two securities always measures their risk premium relative to each other. A large spread provides a higher margin of safety and vice versa.
With this background, you will see below that when adjusted for interest rates, their current valuations also are at an attractive level.
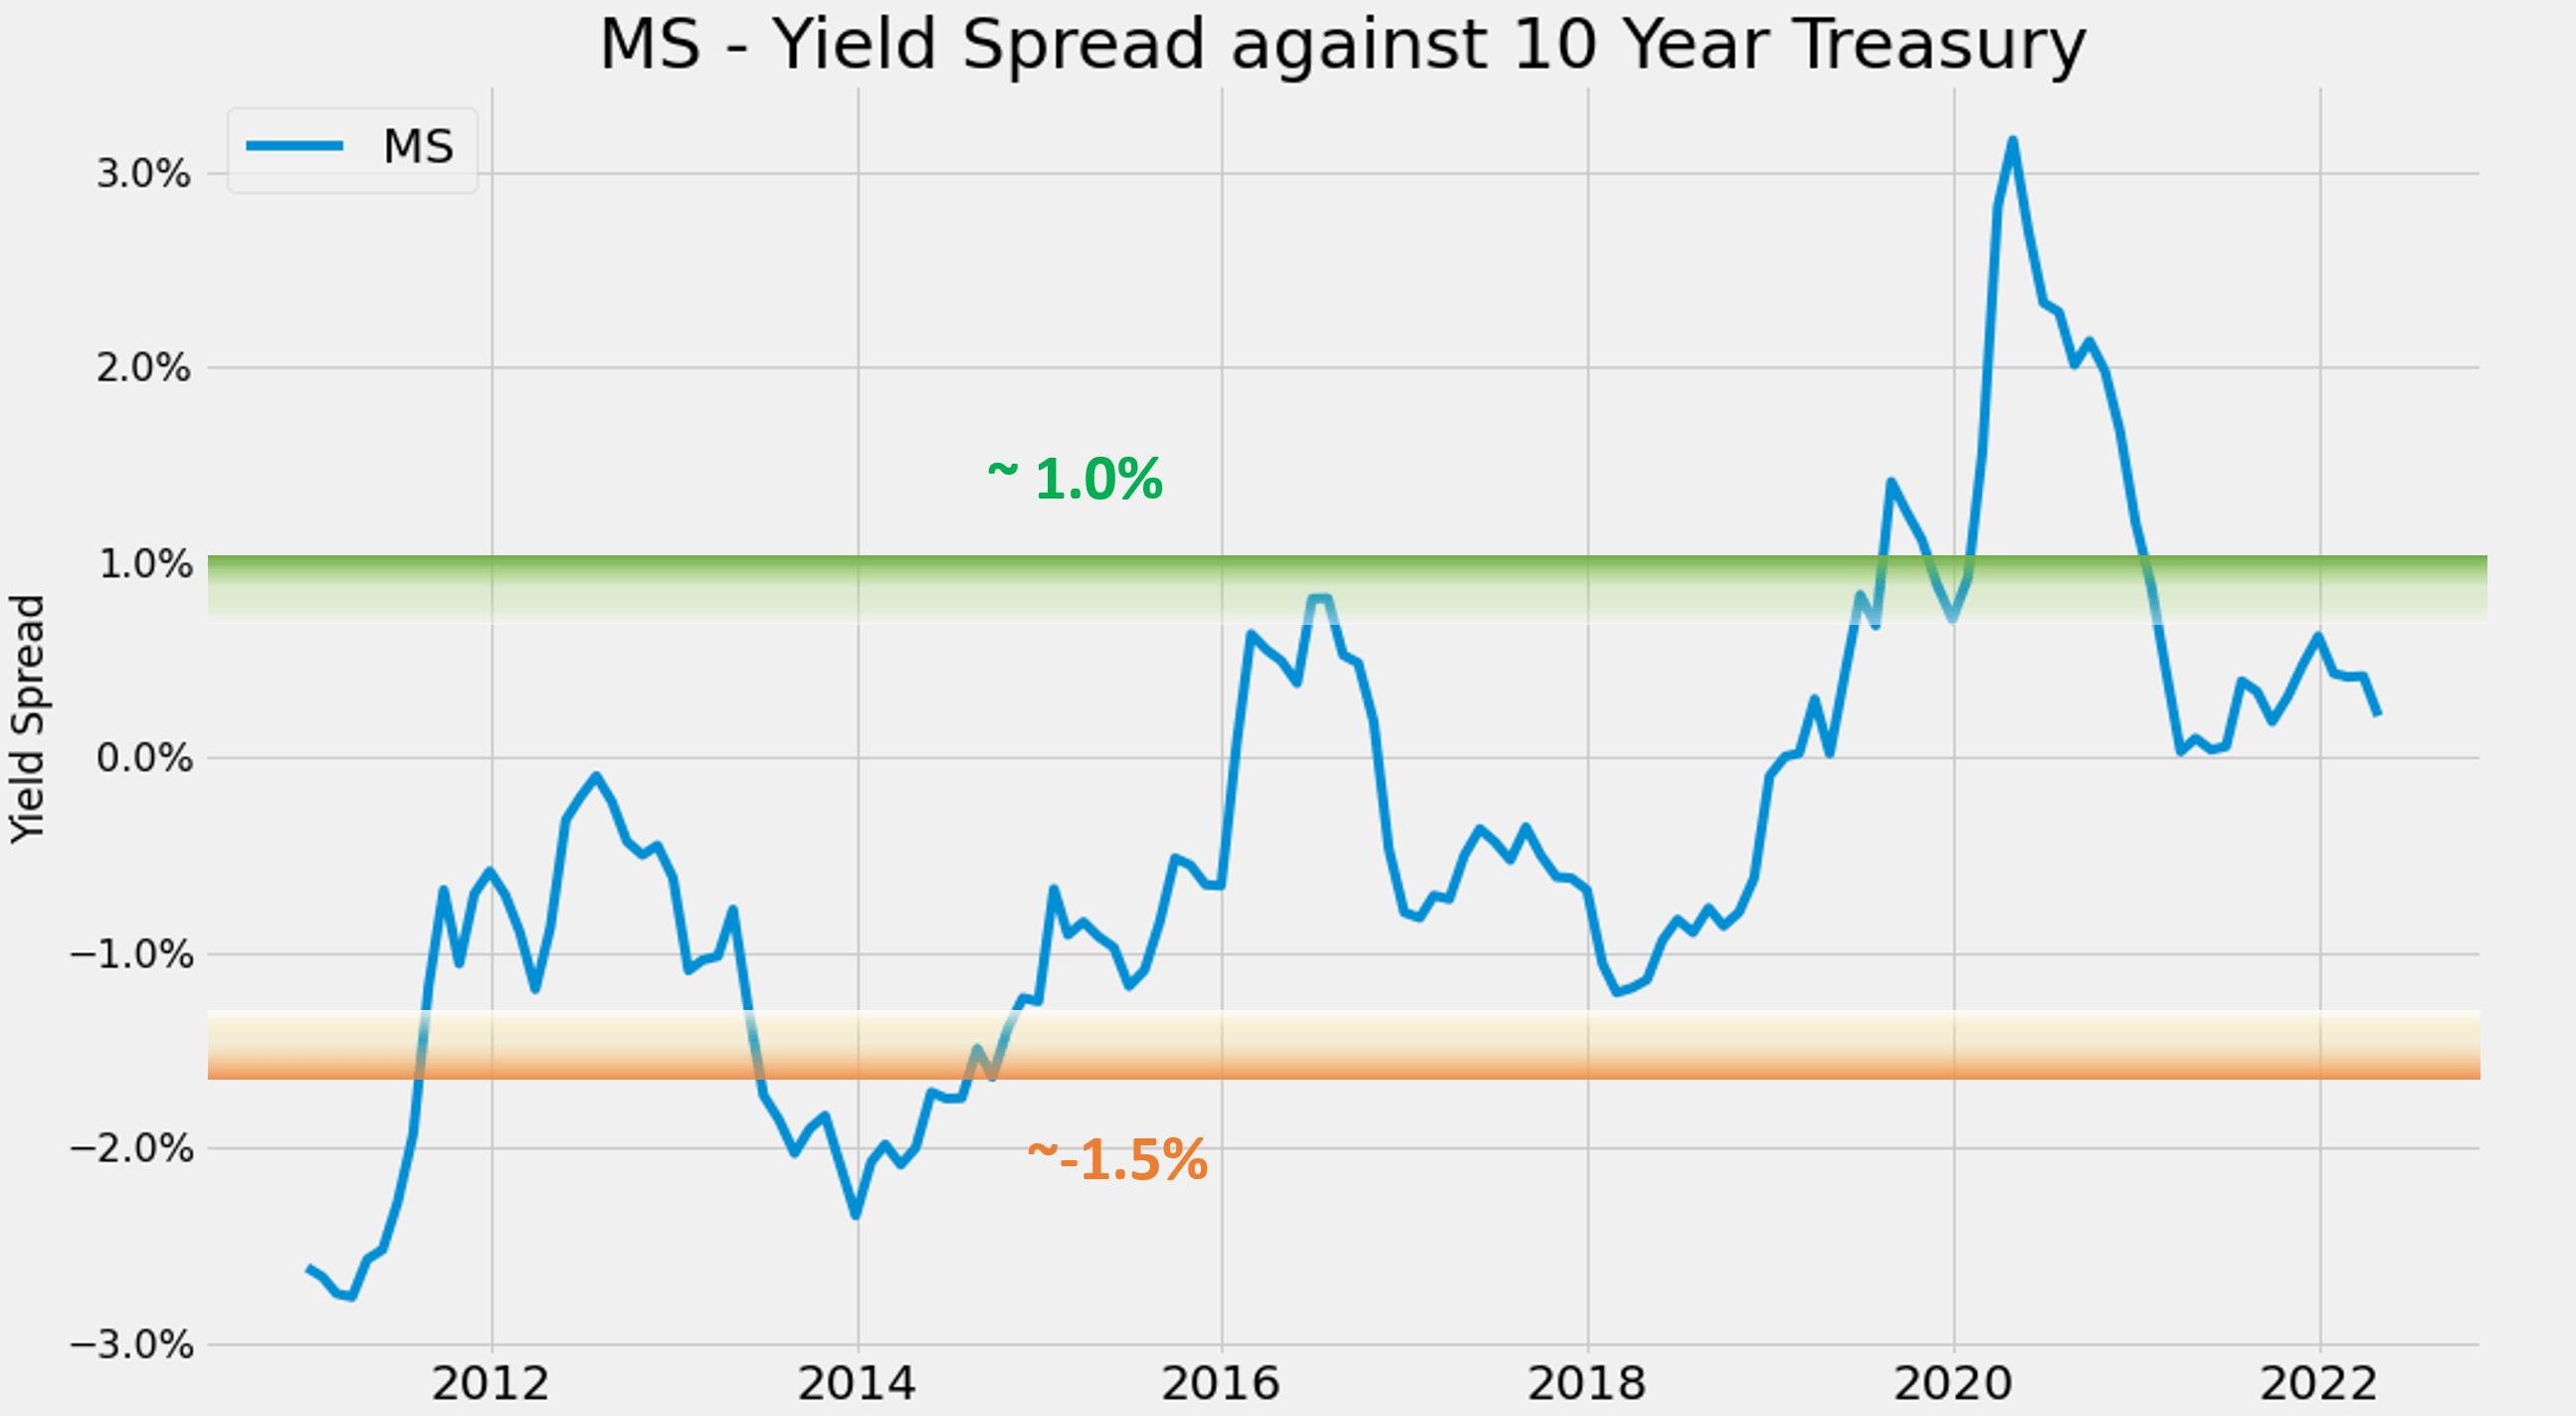
Let’s examine MS first. The following chart shows the yield spread between MS and the 10-year treasury. The dividend yield is calculated based on the TTM dividends. As can be seen, the spread is bounded and tractable most of the time. The spread has been in the range between about 1.0% and negative 1.5% the majority of the time during the past decade. Such a tractable YS suggests that when the spread is near or above 1.0%, MS is significantly undervalued relative to the 10-year Treasury bond (i.e., I would sell Treasury bonds and buy MS). In another word, sellers of MS are willing to sell it (essentially an equity bond with growth built-in) to me at a yield that is 1% above the risk-free yield. So it’s a good bargain for me. And vice versa.
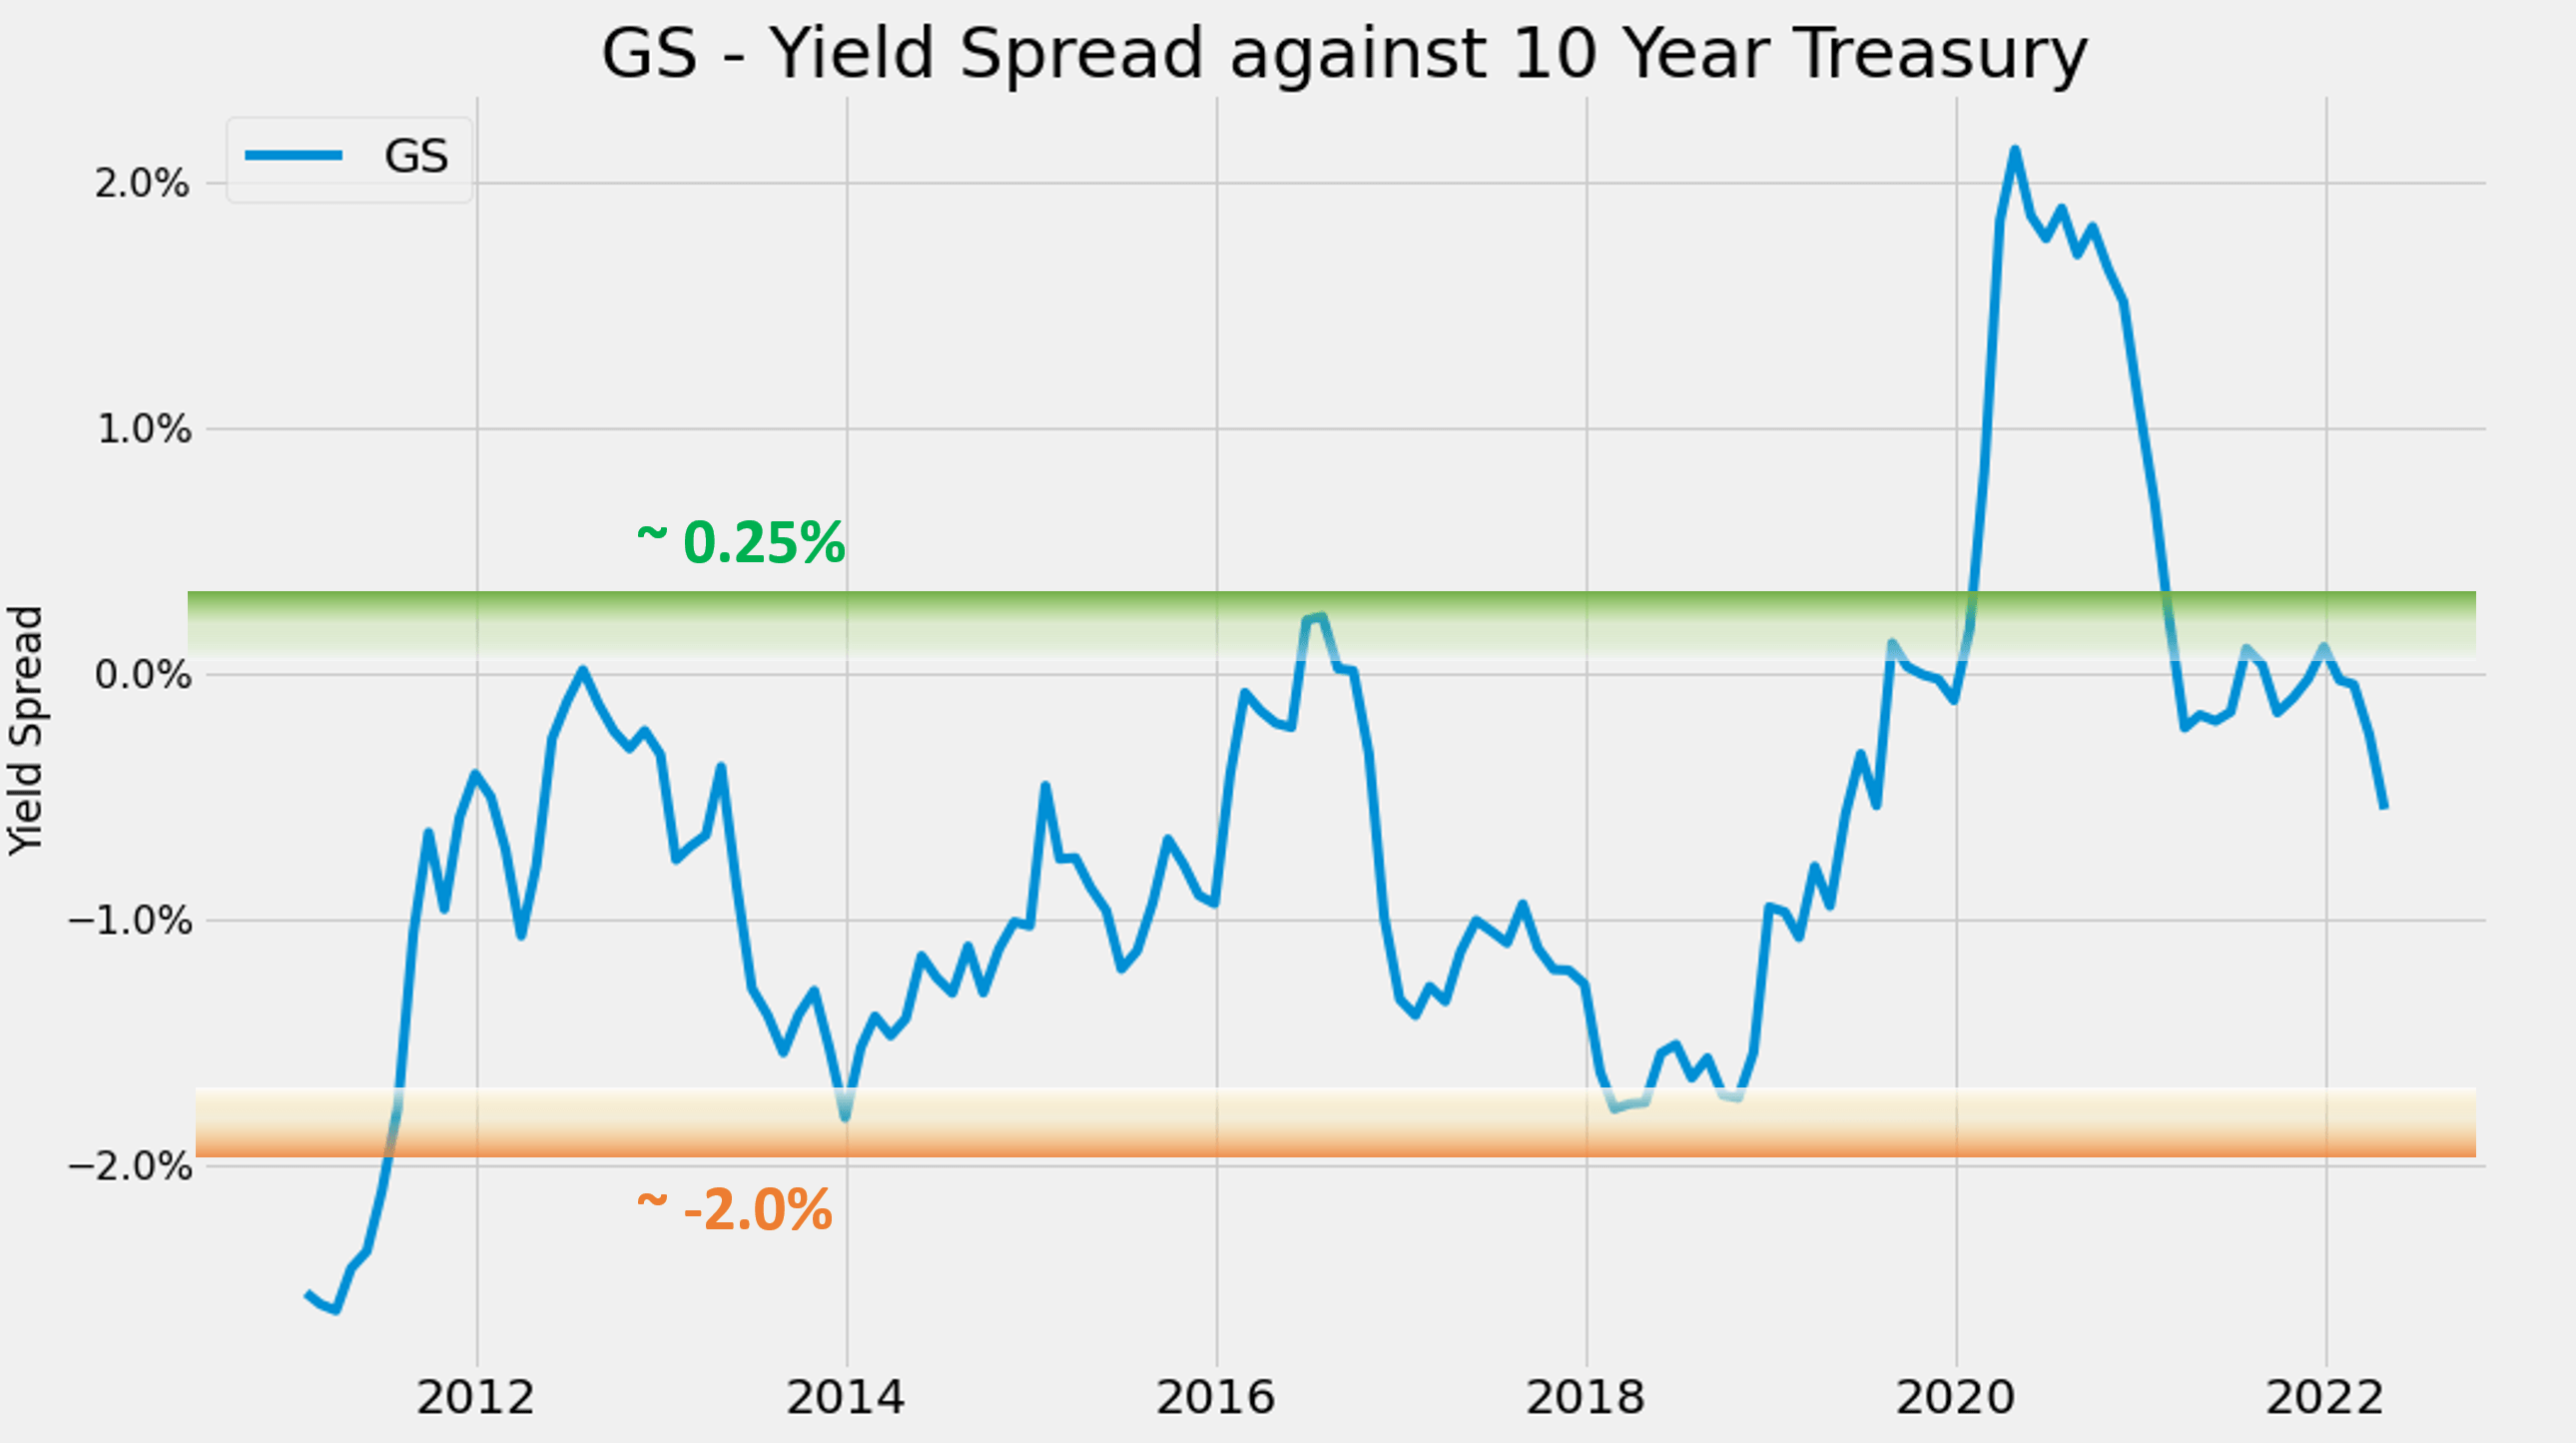
Similarly, you can see that the yield spread between GS and the risk-free Treasury rates is also bounded and tractable, with some small differences in their exact numerical values. The spread has been in the range between about 0.25% and negative -2.0% the majority of the time during the past decade.
You can see the screaming signal in 2020 when the yield spreads surged to ~2%+ level – and this is why this dashboard is the first thing we look at when we make our investment decisions.
As of this writing, the spreads for both stocks are closer to the thicker end of their historical average, signaling attractive valuations relative to the risk-free rates.
Author
Author
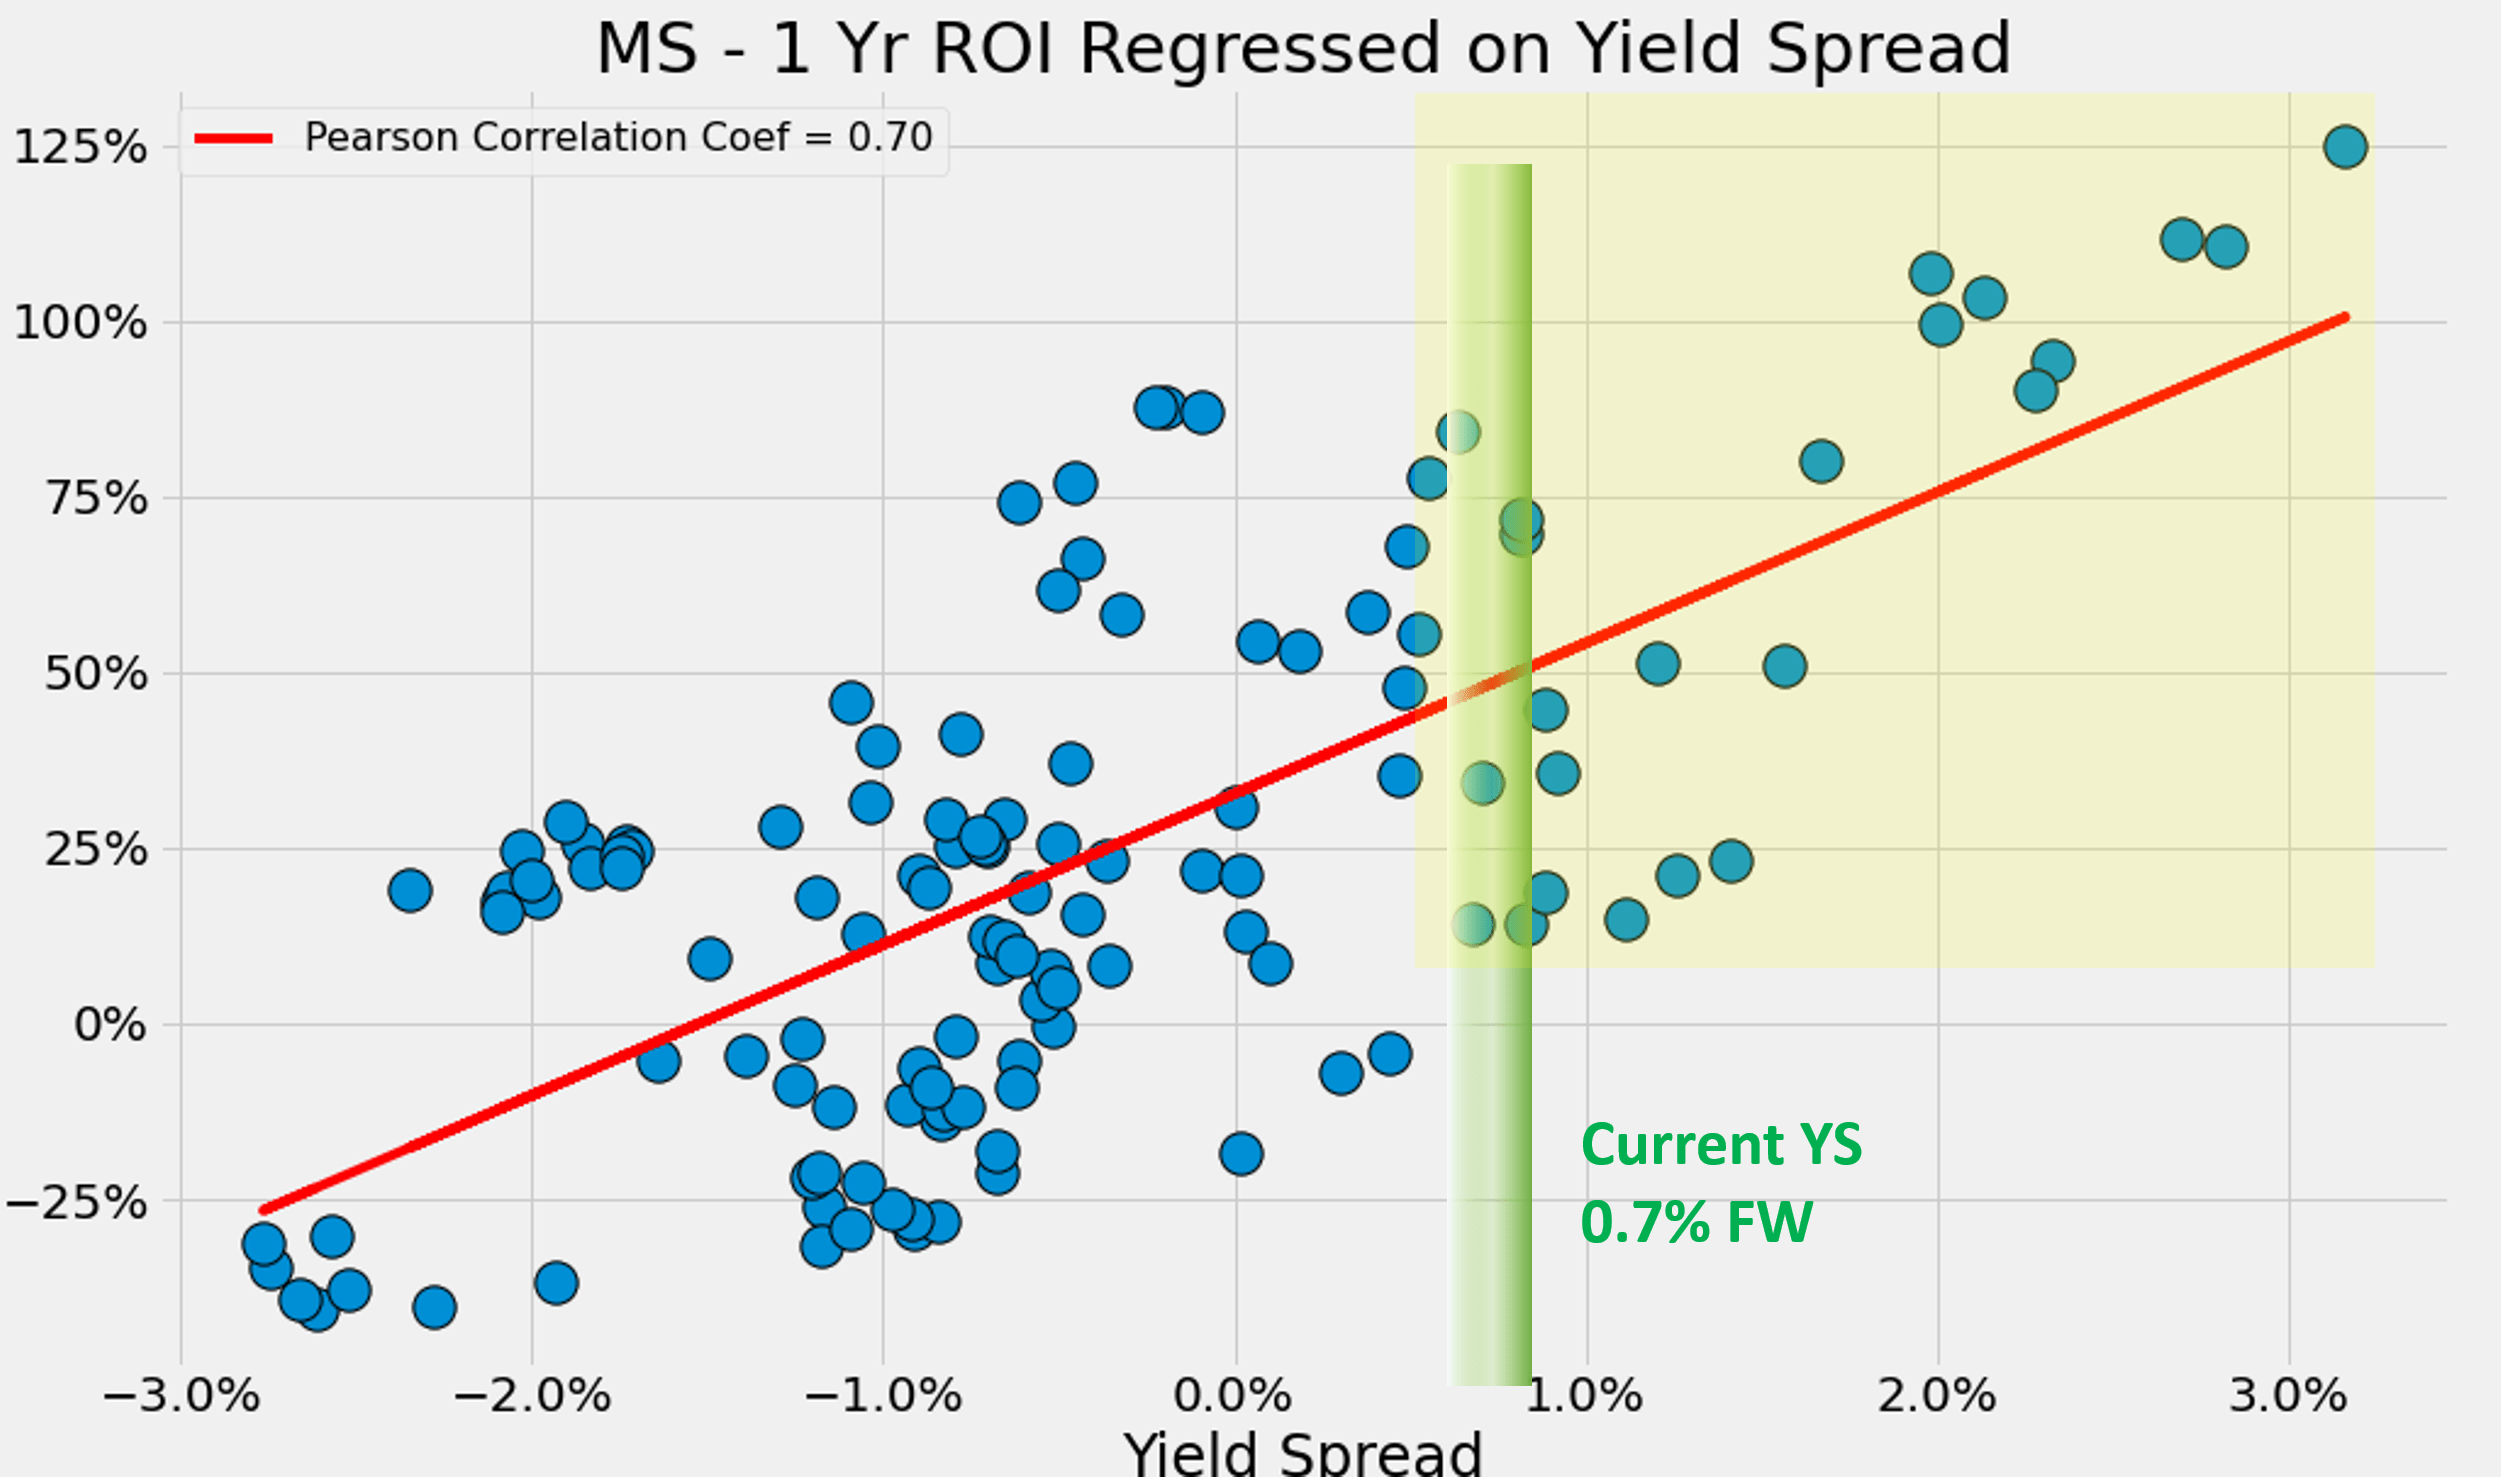
For readers familiar with our analyses, you know that the short-term returns are closely correlated with the yield spread for many of the funds and stocks (after all, risk-free rates indeed act as the gravity of financial activities). And as you can see from the charts below, it’s also true for both MS and GS. The first chart shows the one-year total return on MS (including price appreciation and dividend) when the purchase was made under different yield spreads. There’s a clear positive trend and a Pearson correlation coefficient of 0.7.
Again, the screaming buying opportunities in 2020 are shown by the few data points on the far-right side of the charts. And you see the outsized return in the next 1 year (more than 100%). In general, also shown in the yellow box, when the yield spread is above 1%, the total returns in the next two years have been all positive and quite large (almost all above 25%).
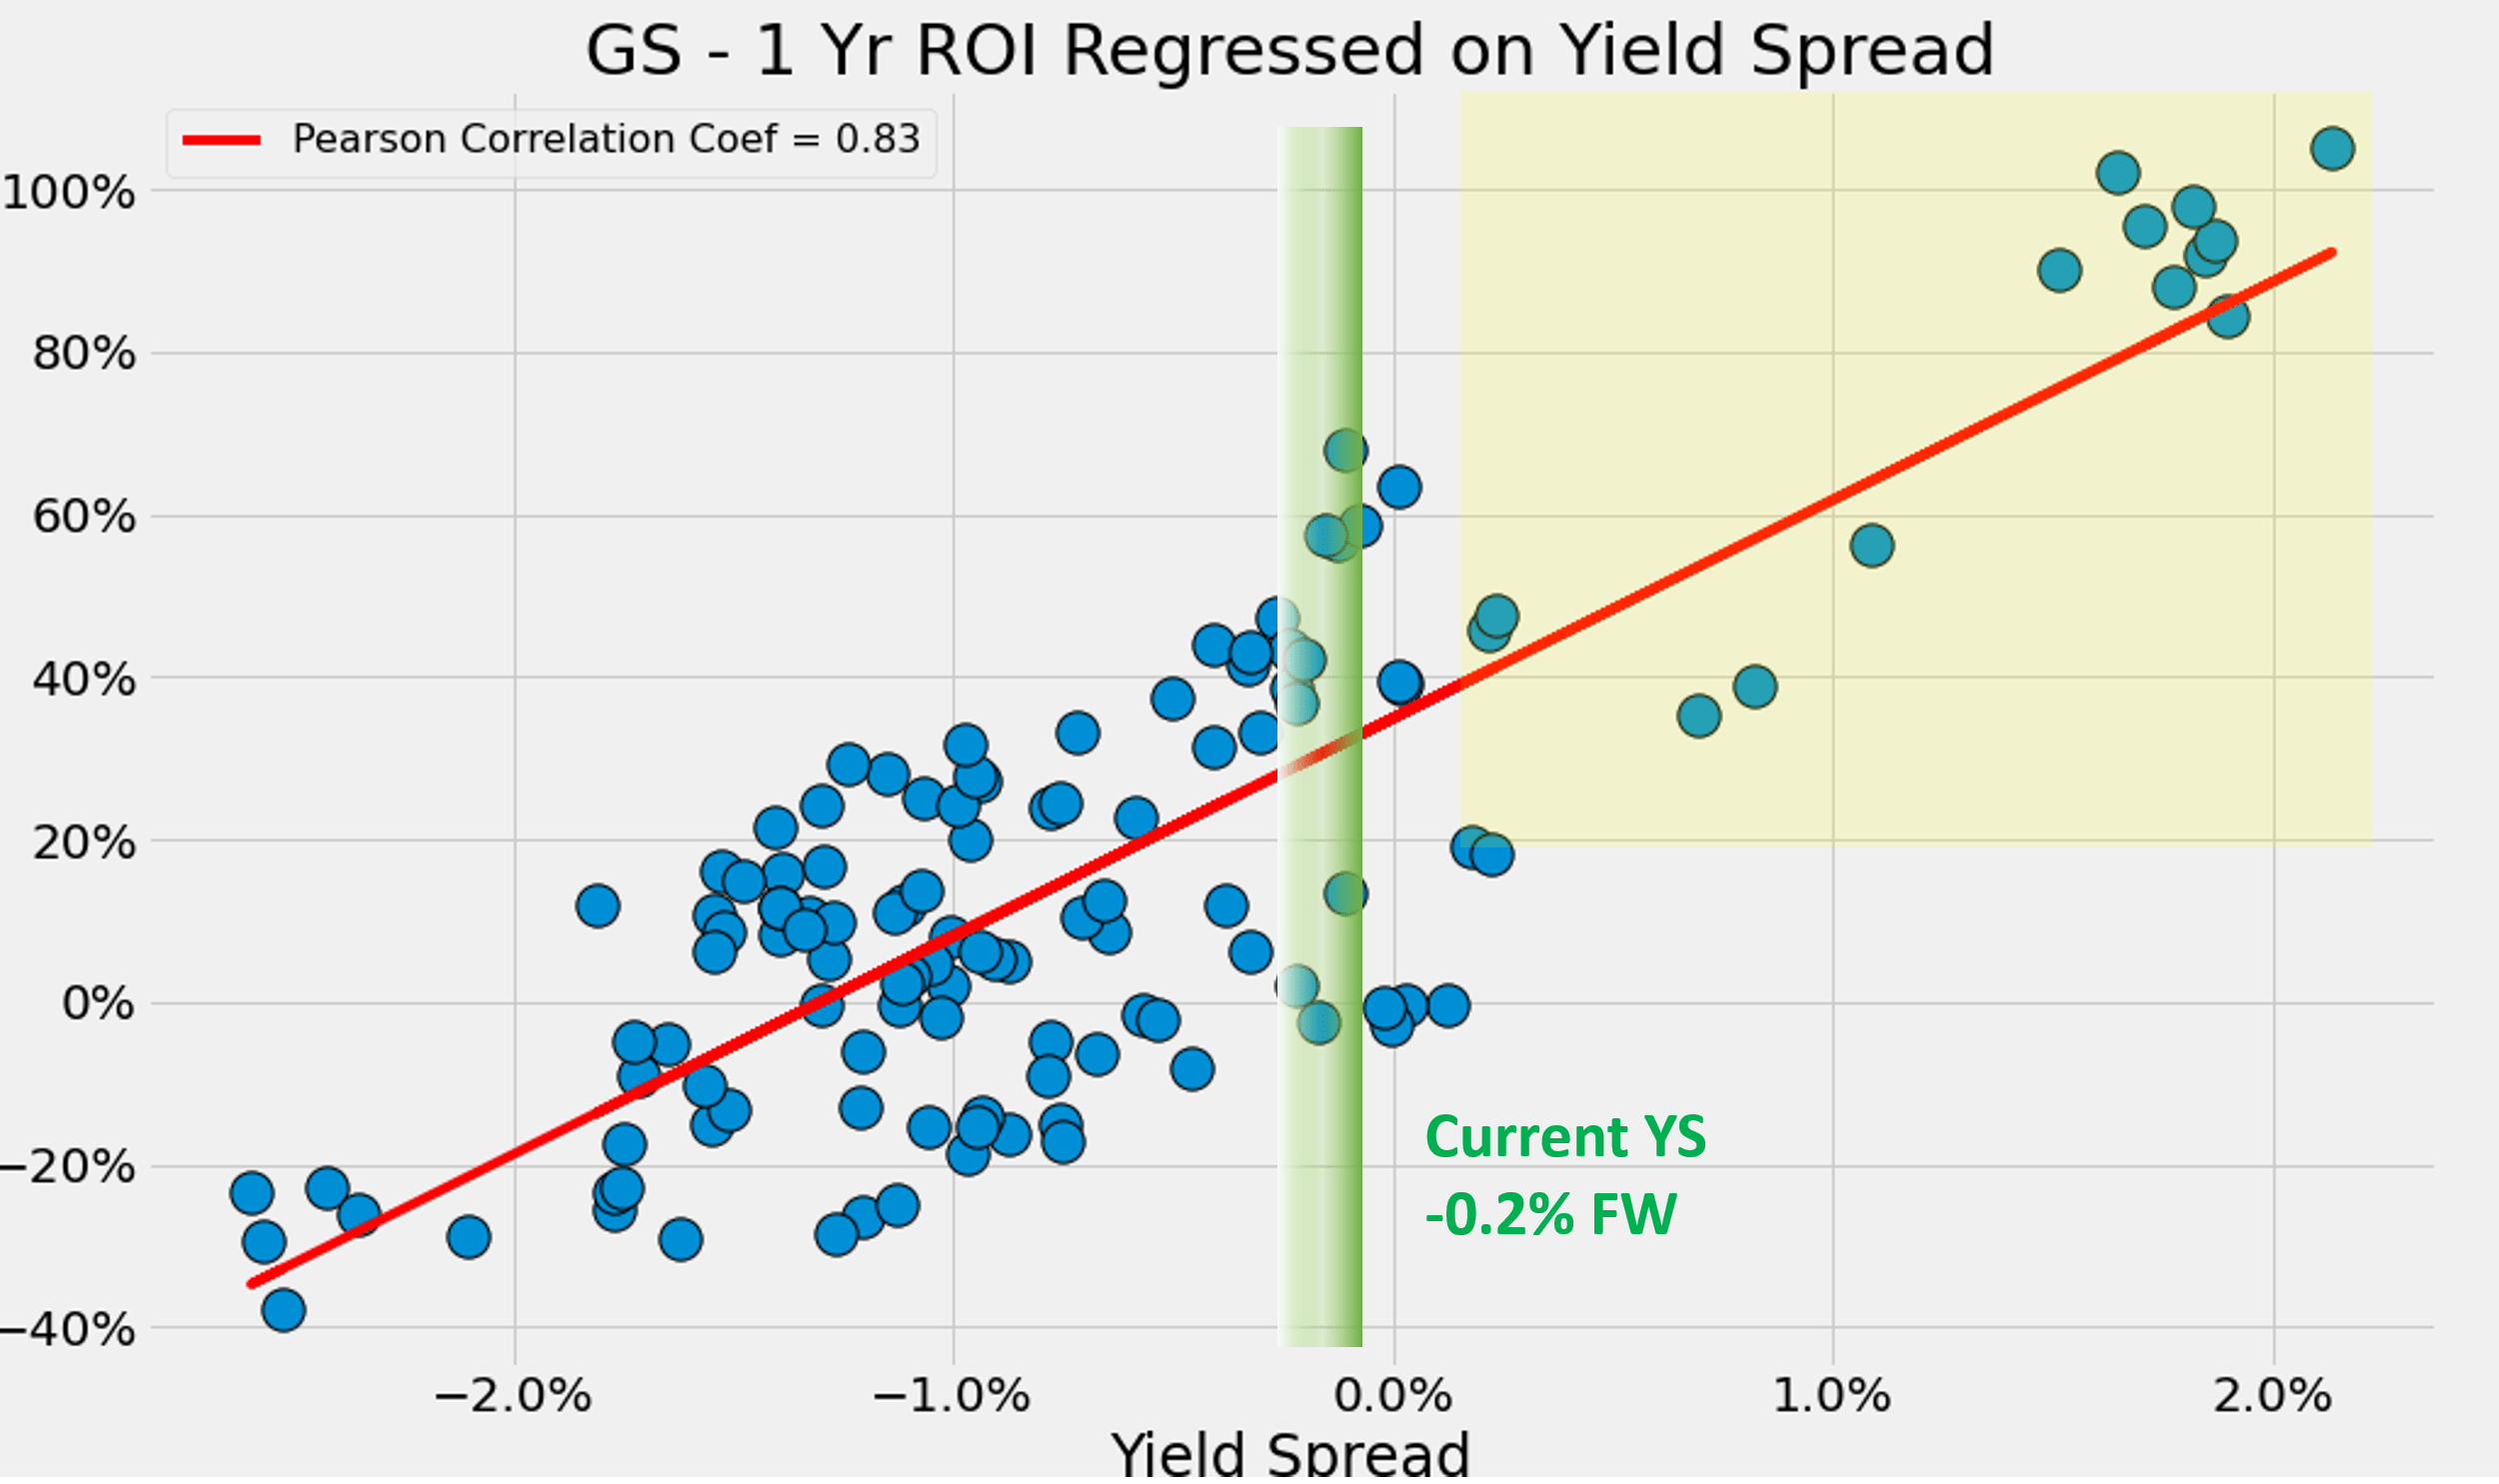
You can see a very similar correlation for GS, and here the correlation is even stronger a Pearson correlation coefficient of 0.83. Also shown in the yellow box, when the yield spread is above 0.25% or so as aforementioned, the total returns in the next 1 year have been all positive and even larger (all above about 20%). And when the yield spread is above 1%, the total returns in the next 1 year have also all been about 60%.
As of this writing, on an FW basis, the yield spread is about 0.7% for MS and about -0.2% for GS, respectively. And again, both are closer to the thicker end of their historical spectrum.
Author
Author
Risks
There are a few risks common to both stocks:
- The current macroeconomic and geopolitical uncertainties can impact their operations in unpredictable ways. GS has just announced its plan to exit Russia, becoming the first major Wall Street bank to announce plans to do so after the invasion of Ukraine. Both banks operate globally and are exposed to global and regional geopolitical conflicts.
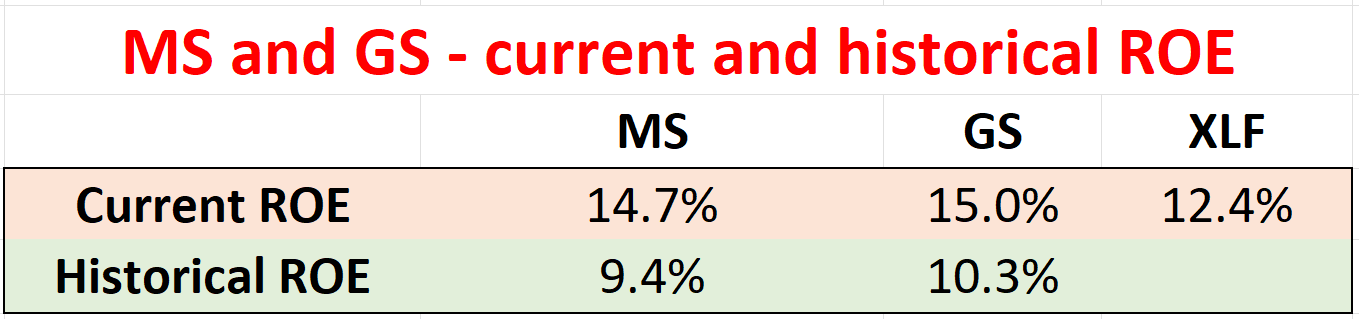
- Both banks are also over-earning on their assets. As such, there’s a concern about their profitability reversion. As seen from the following chart, both now are earning nearly 15% of ROE, which is dramatically above their historical mean of about 10%. I myself am a bit more cautious than they are earning about 50% more on their assets. If taking 10 years as an approximation for a business cycle, it’s a concern that their profitability reversion to their historical means in the years to come.
Author
Conclusion and final thoughts
The earnings releases from MS and GS this a.m. largely confirmed the market expectation of the retreat of their revenues and profits from a year ago. With the Fed’s monetary tightening ahead, there are certainly reasons to be cautious. It’s reasonable to expect lower investment banking activity across the board and lower asset and wealth management revenues.
However, this article presents a bullish thesis on both MS and GS based on the following considerations:
- The headwinds have already been fully priced in at this point. These premium banking stocks are now quite attractively valued both in absolute and relative terms. They offer higher profitability and safety than the sector, yet they trade at substantial discounts to the sector. To provide a further margin of safety, the financial sector itself is trading at a reasonable valuation according to our Market Sector Dashboard among other overvalued sectors.
- The spreads for both stocks relative to risk-free Treasury rates are closer to the thicker end of their historical average, signaling attractive valuations relative to the risk-free rates also.
Be the first to comment