

davidrasmus/iStock via Getty Images
Introduction
Friday, June 10th marked the start of the strongest negative signal for 2022, and conditions continue highly negative through today. This article builds on prior signal event articles with more explanations on how to benefit from one of the most popular features of the Value & Momentum Breakouts marketplace service. As more data points are collected, more insights are gained.
This article serves to answer key questions about the current negative signal and prepare readers for the potential of more downside risk in the short term.
Examining The Charts And Signals Of The Current Decline
A combination of validating factors has been forming in recent weeks. Now, with a broad selection of momentum gauges, the signal strength can be approximated relative to prior events. These validating combinations are listed below and then detailed with charts.
Prior signals on the S&P 500 index fund (SPY) are illustrated below, and the market has been in decline this year since near the January 13th negative signal.
Finviz.com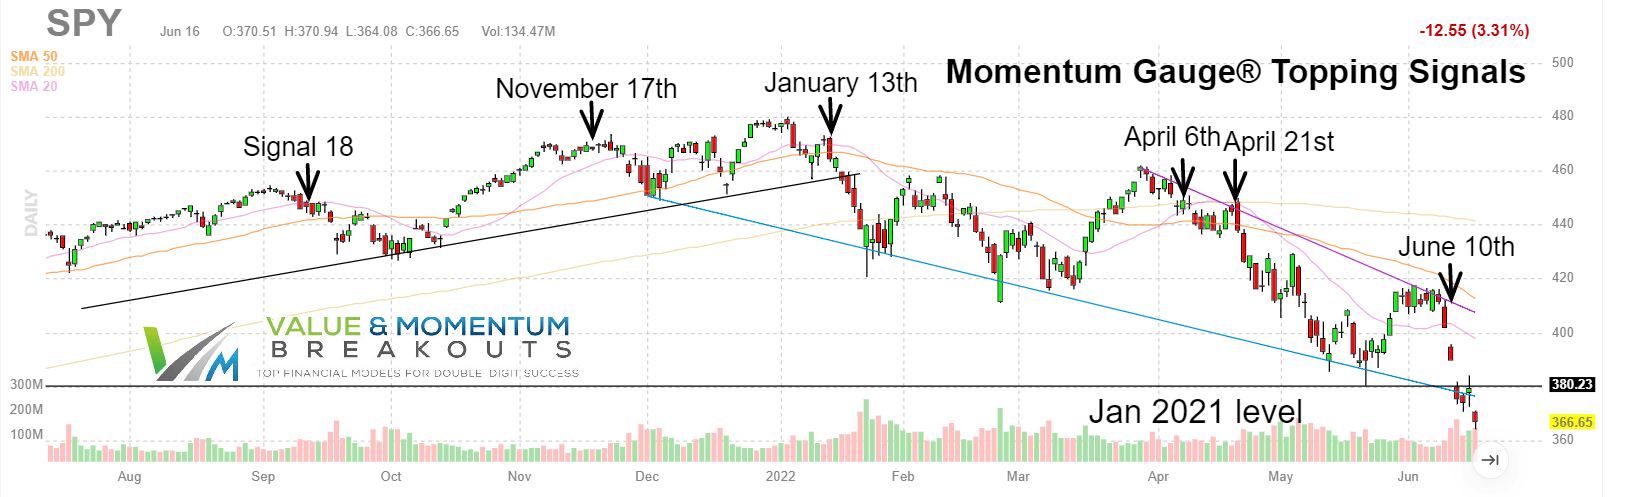
The strongest recent signal had been November 17th. The current signal is delivering values across different gauges comparable to 2020.
Finviz.com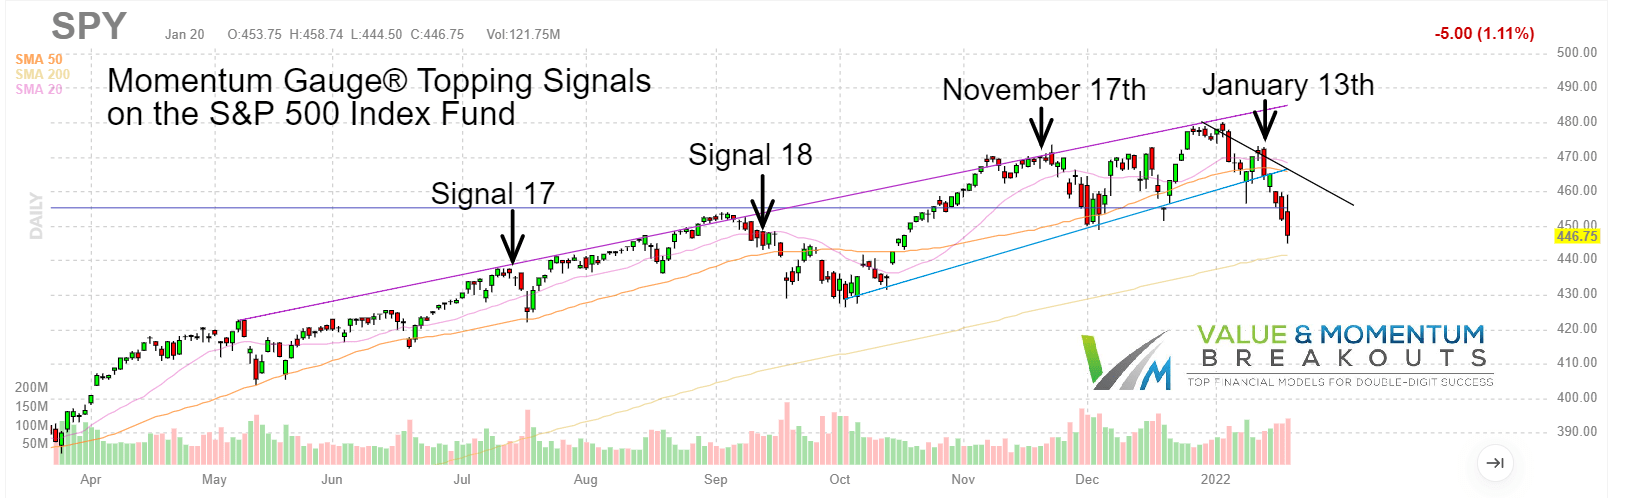
Ironically, just as the S&P 500 gauges and Sector Momentum Gauges were turning strongly negative, JPMorgan announced a bullish market signal ahead of what is now an -8.7% decline for the index in just the past 5 days.
Bloomberg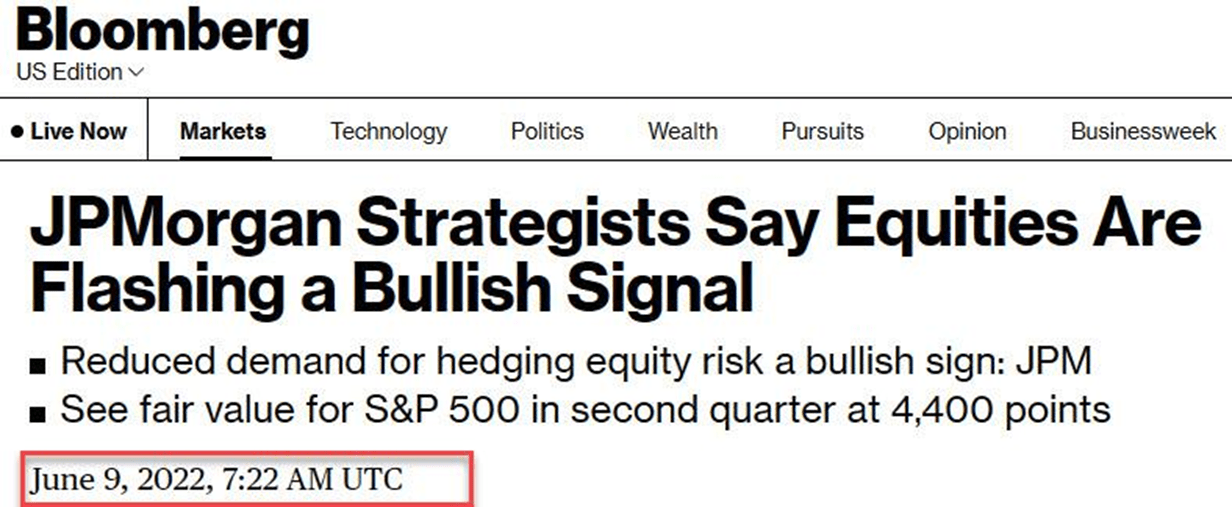
Reviewing the June Momentum Gauge signals
1. The Daily Momentum Gauges turned negative on June 10th with increasing negative values since the signal.
app.VMBreakouts.com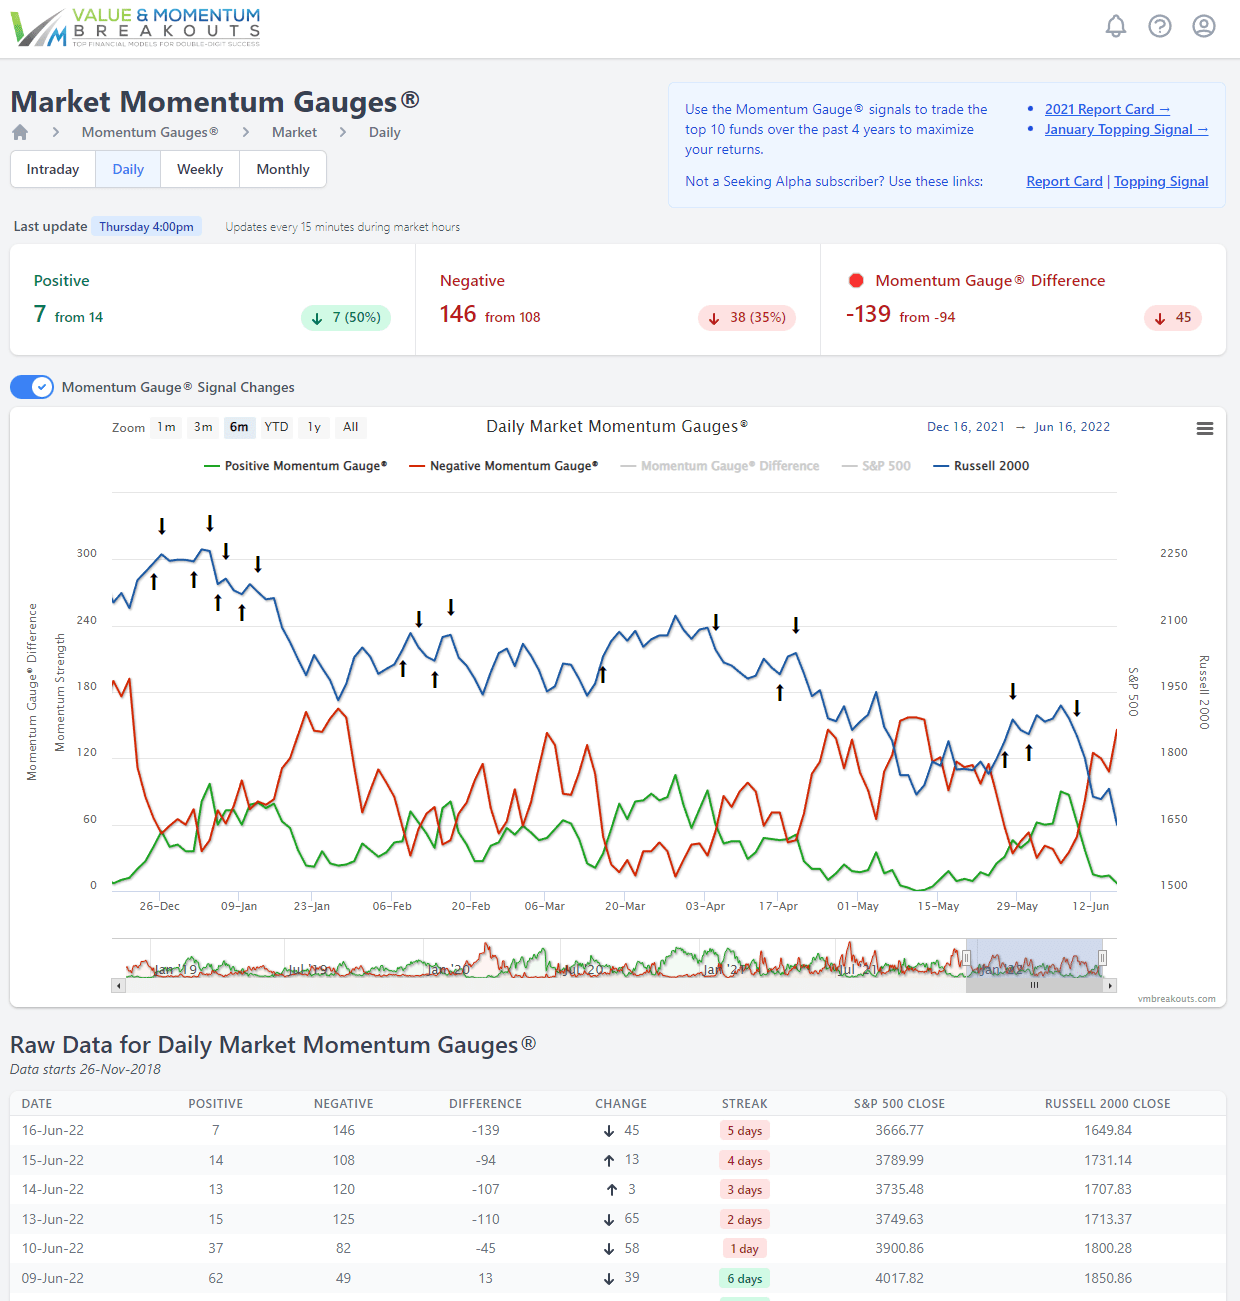
2. The Weekly Momentum Gauges have been negative 26 of the last 31 weeks since the November signal. We have not had more than 2 consecutive weeks positive since the November 17th signal. The peak negative values in each of the declines has ranged from 148 to 187 not including the Covid-19 correction when the weekly negative momentum reached 229. Currently, as shown, the negative level for the week is up to 125.
app.VMBreakouts.com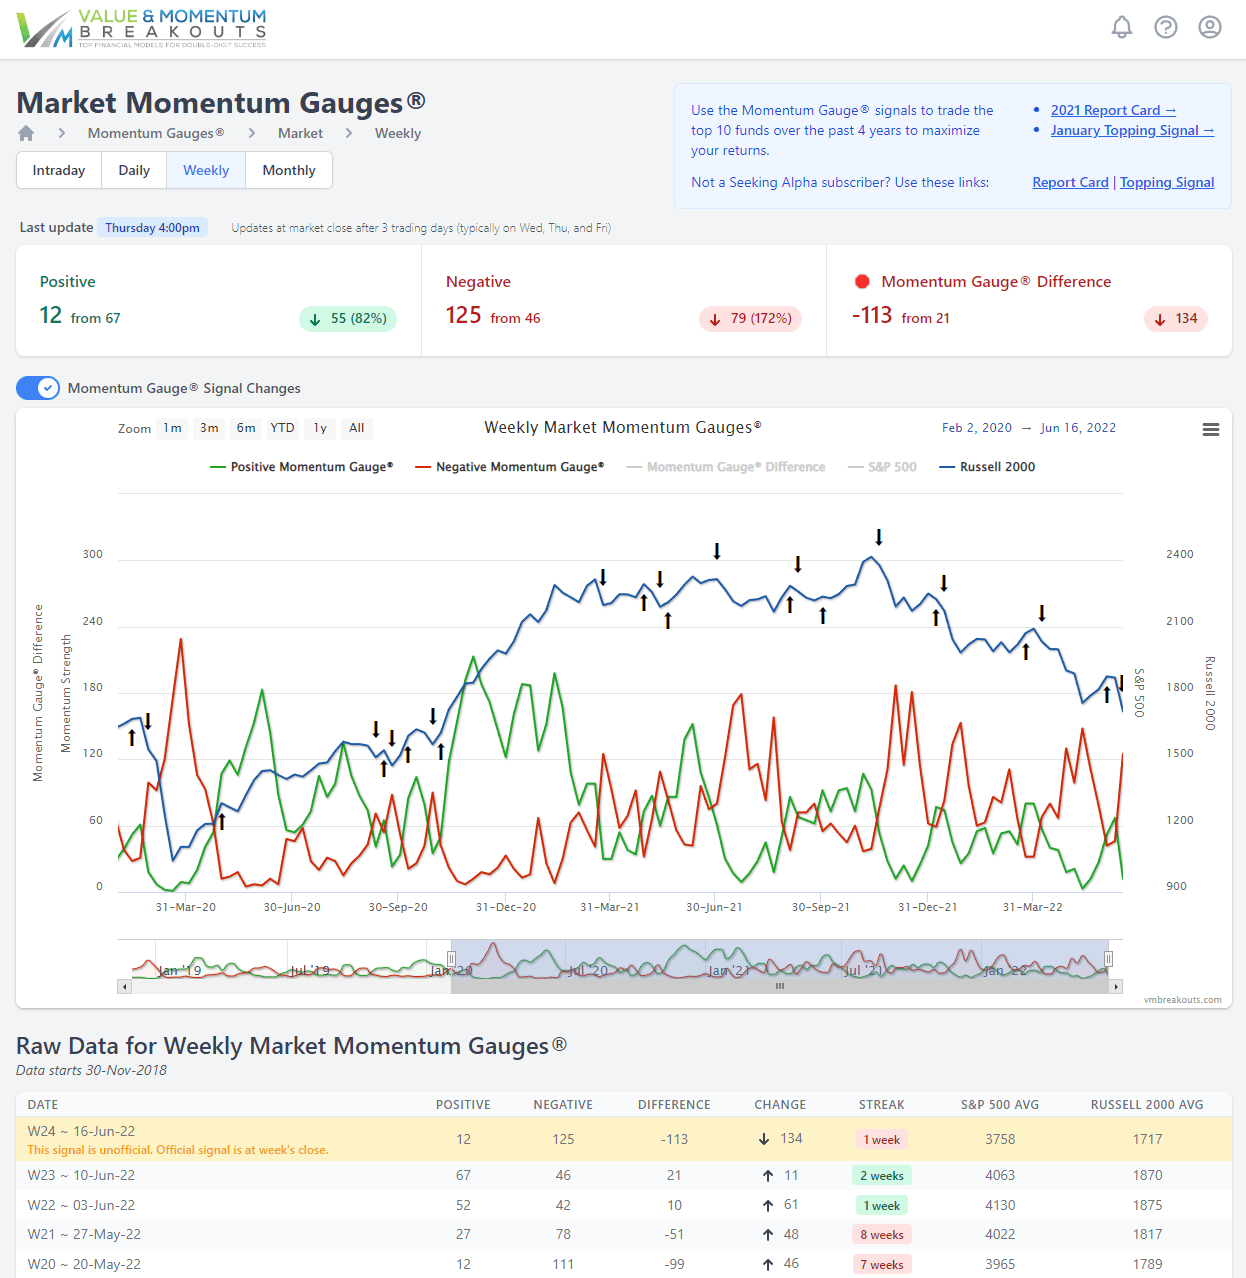
3. The Monthly Market Momentum Gauges have been negative for the past 8 months since November, and the values are rising again for June toward prior highs above 100.
app.VMBreakouts.com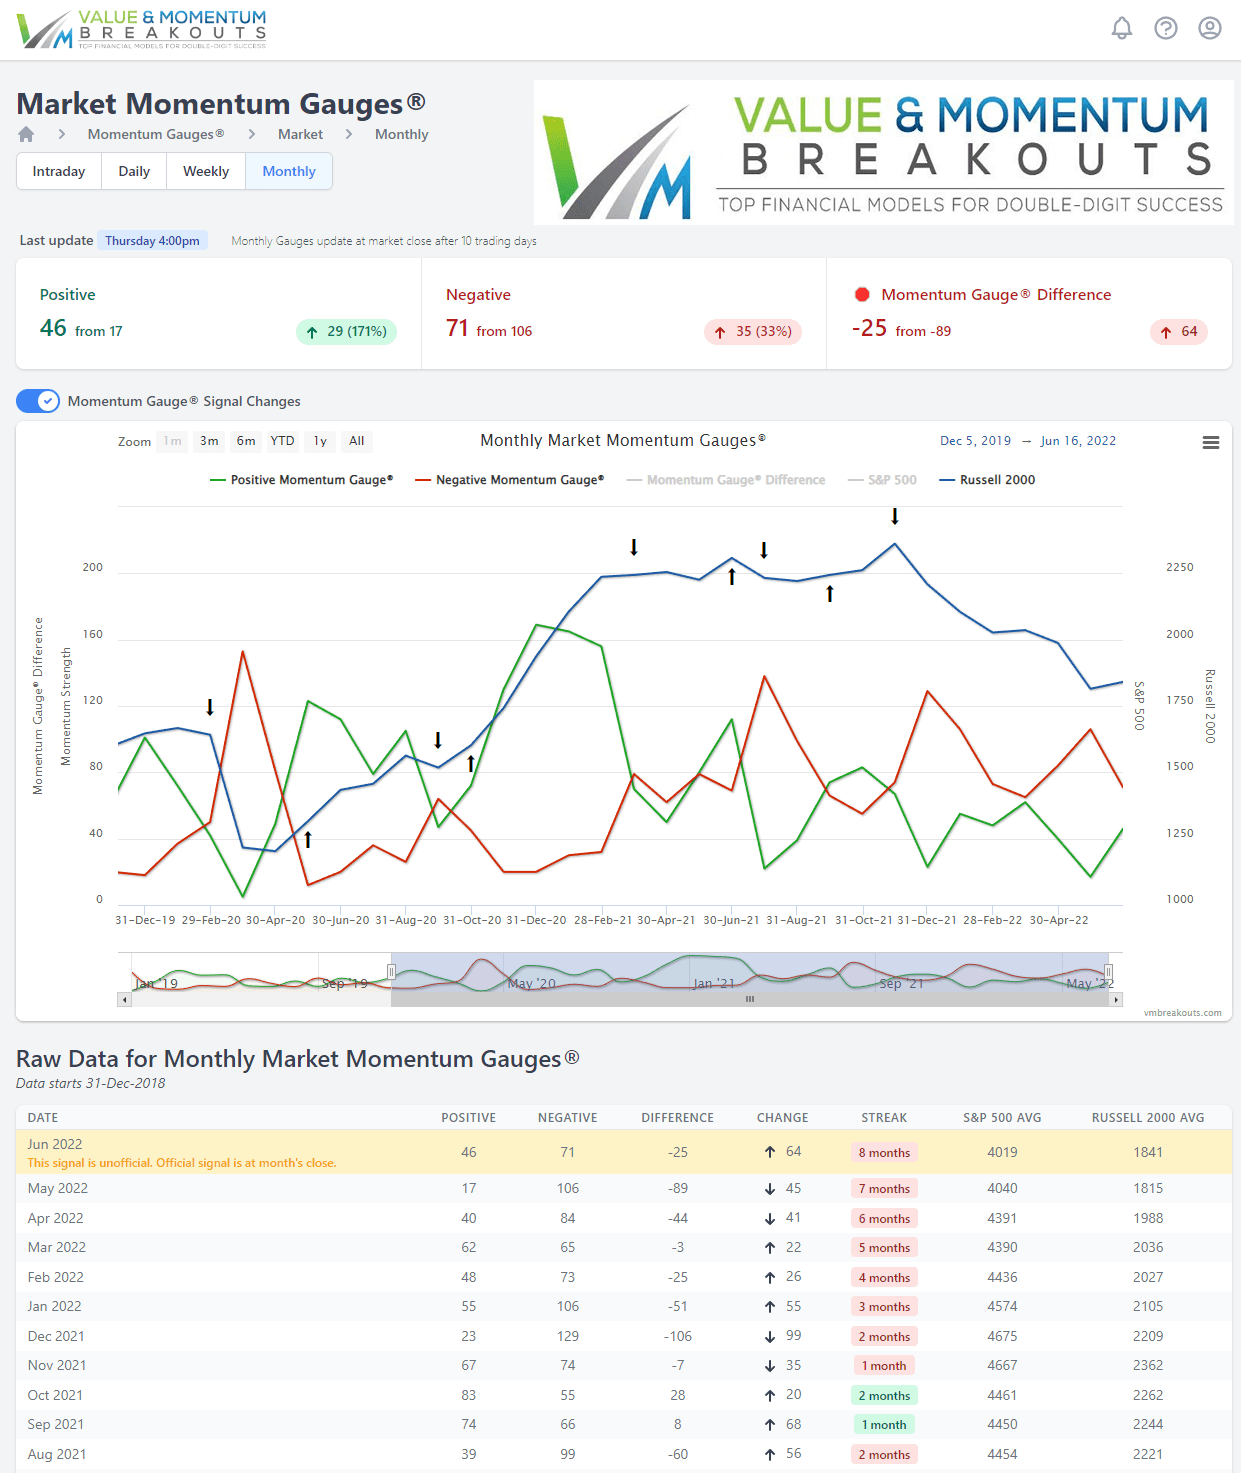
4. Additional confirmation from the S&P 500 Momentum Gauges confirmed a negative market signal a day earlier on June 9th. Of particular significance is how low the positive momentum values have become, even registering a zero value on June 16th for the first time since the Covid Correction.
app.VMBreakouts.com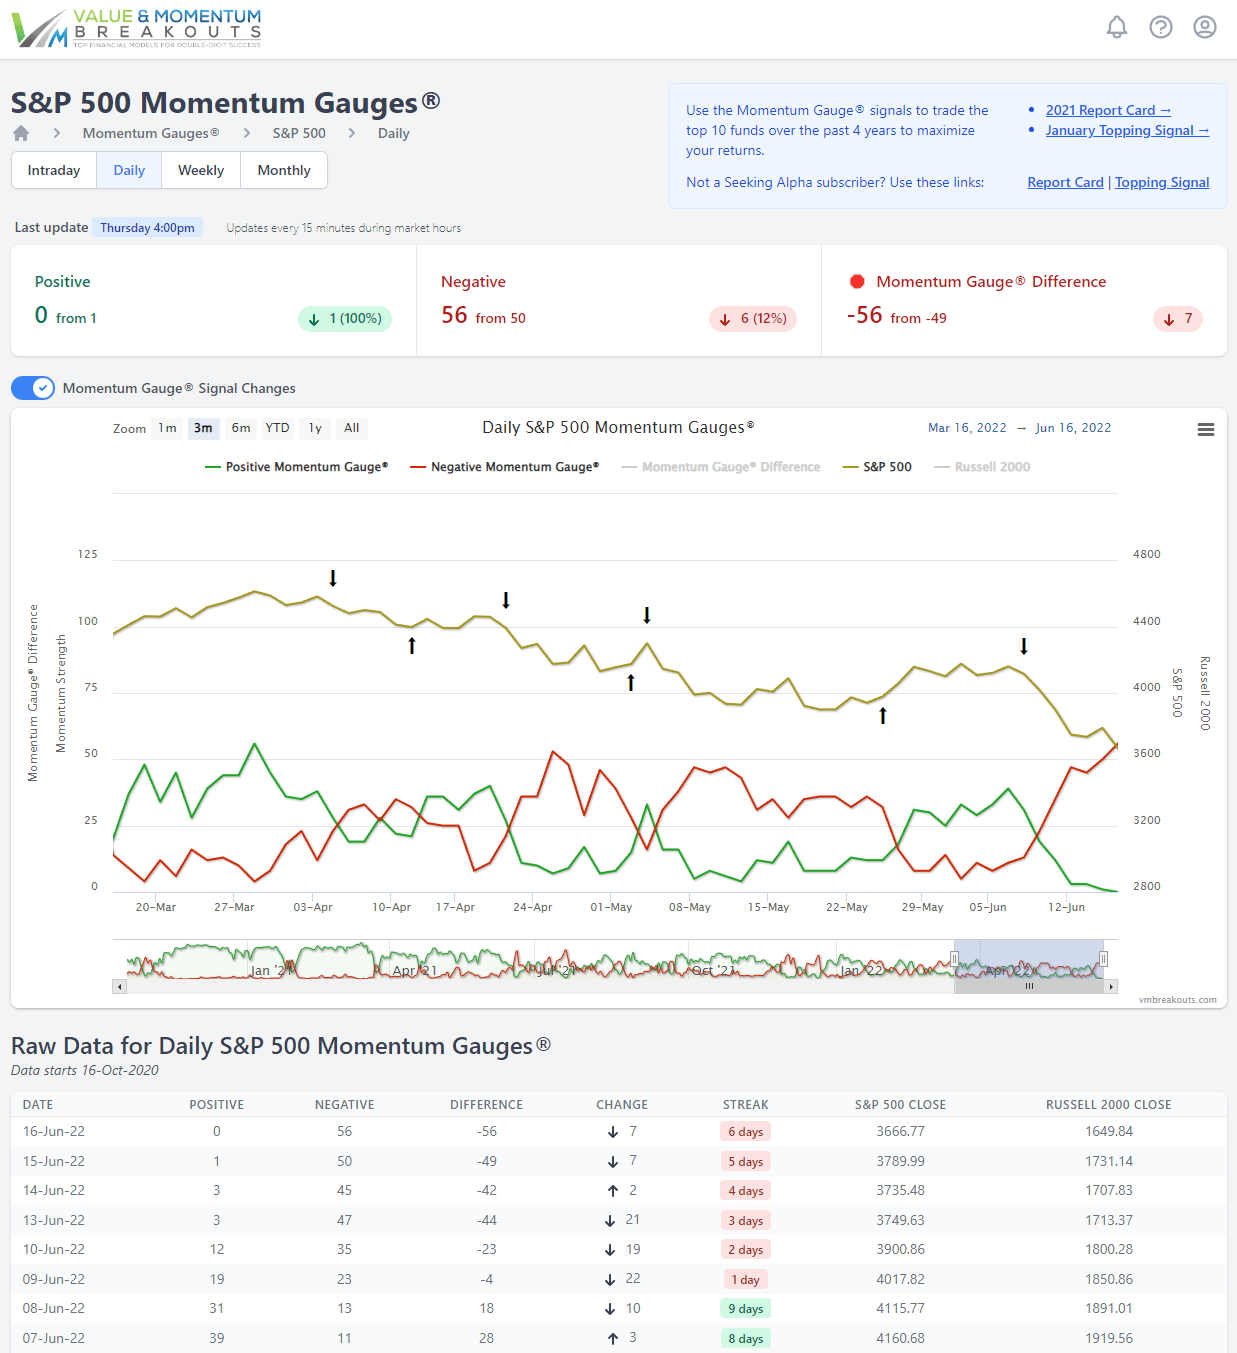
5. The Sector Momentum Gauges measuring 11 sector conditions are all negative, further confirming broad negative market conditions. A majority of the sector gauges turned negative on June 9th. Many of the negative sectors are down to single digit positive momentum, very near the lowest levels when several sectors went to zero in the Covid correction.
VMBreakouts.com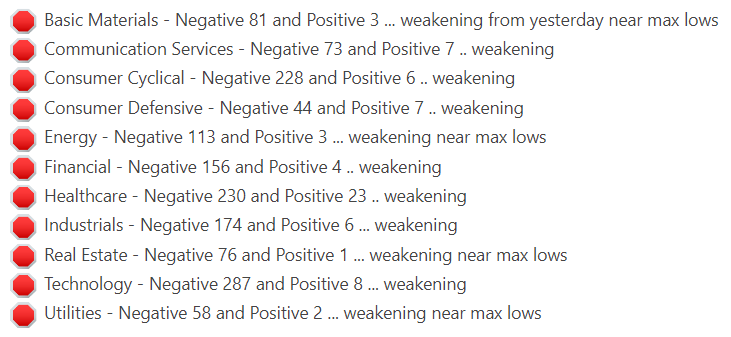
Current Results Of The June 2022 Signal
1. The actively traded Premium Portfolio moved to cash again on June 10th and is down -6.5% YTD and avoiding significant declines in the portfolio while outperforming the S&P 500 by +17.10% to date. The signals can be applied to other long term portfolios for downside protection, but the application of the gauges is directly part of the Premium Portfolio model: Value & Momentum Breakouts For 2022: 11 Models To Beat S&P 500
2. ETF Bull/Bear combination signal changed to bear funds on June 10th with the following bear fund returns in the past week.
VMBreakouts.com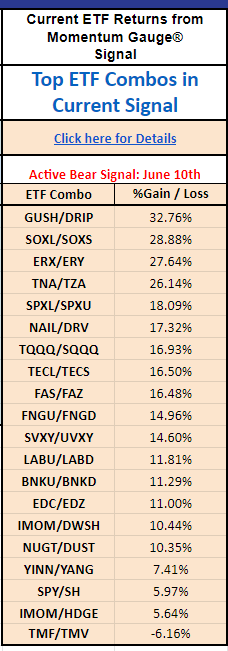
3. The active ETF Portfolio current holdings with +33.4% returns YTD:
VMBreakouts.com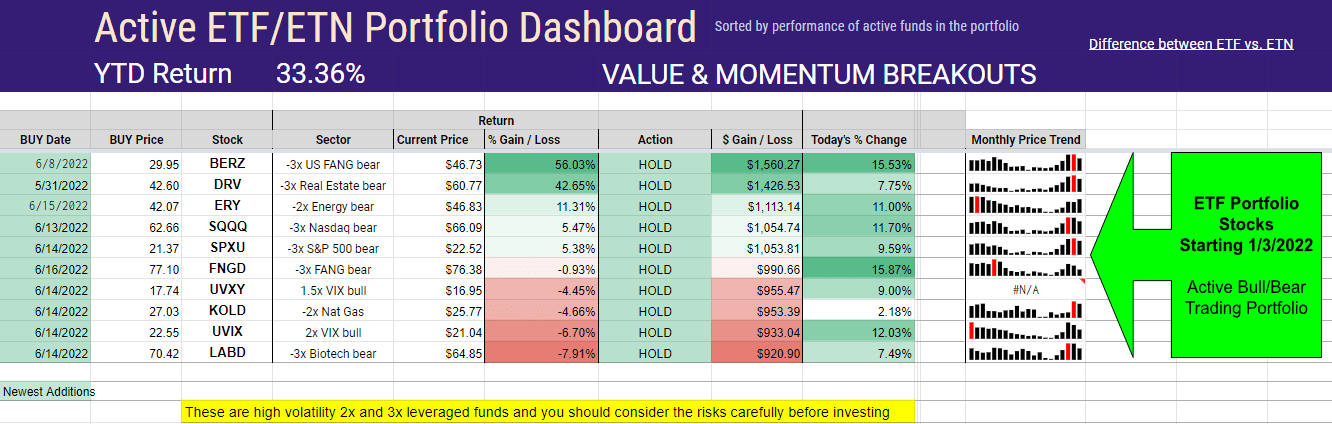
Review Of Current Market Indices
By comparison, YTD all the major indices are sharply lower and breaking key support levels in the past week. This is the worst 5-month start of the year for the stock market since 1973 following the worst 4 months start since 1939.
CNN.Money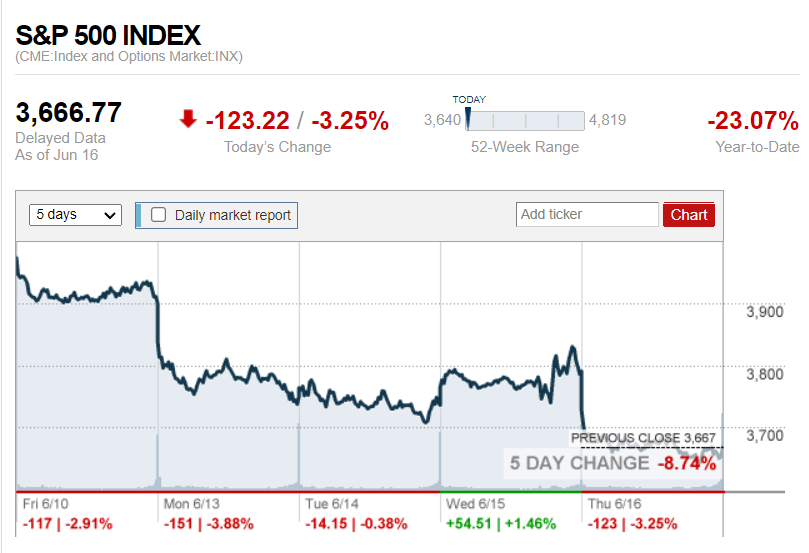
A large number of market indicators are now validating the current S&P 500 decline as potentially the strongest negative signal since February 2020 at the start of the Covid-19 correction. The S&P 500 index fund SPY monthly chart shows a strong technical breakdown back toward support levels in the positive channel from 2009. The powerful effects of the Federal Reserve quantitative easing and tightening programs are illustrated on the chart. It is very likely in my opinion that this June negative signal corresponds to investor anticipation of the June QT start and only our second tightening event since 2018.
- How Markets May React To Fed’s QT Program
- The FED Ends The $6 Trillion QE4: How The Markets May React
VMBreakouts.com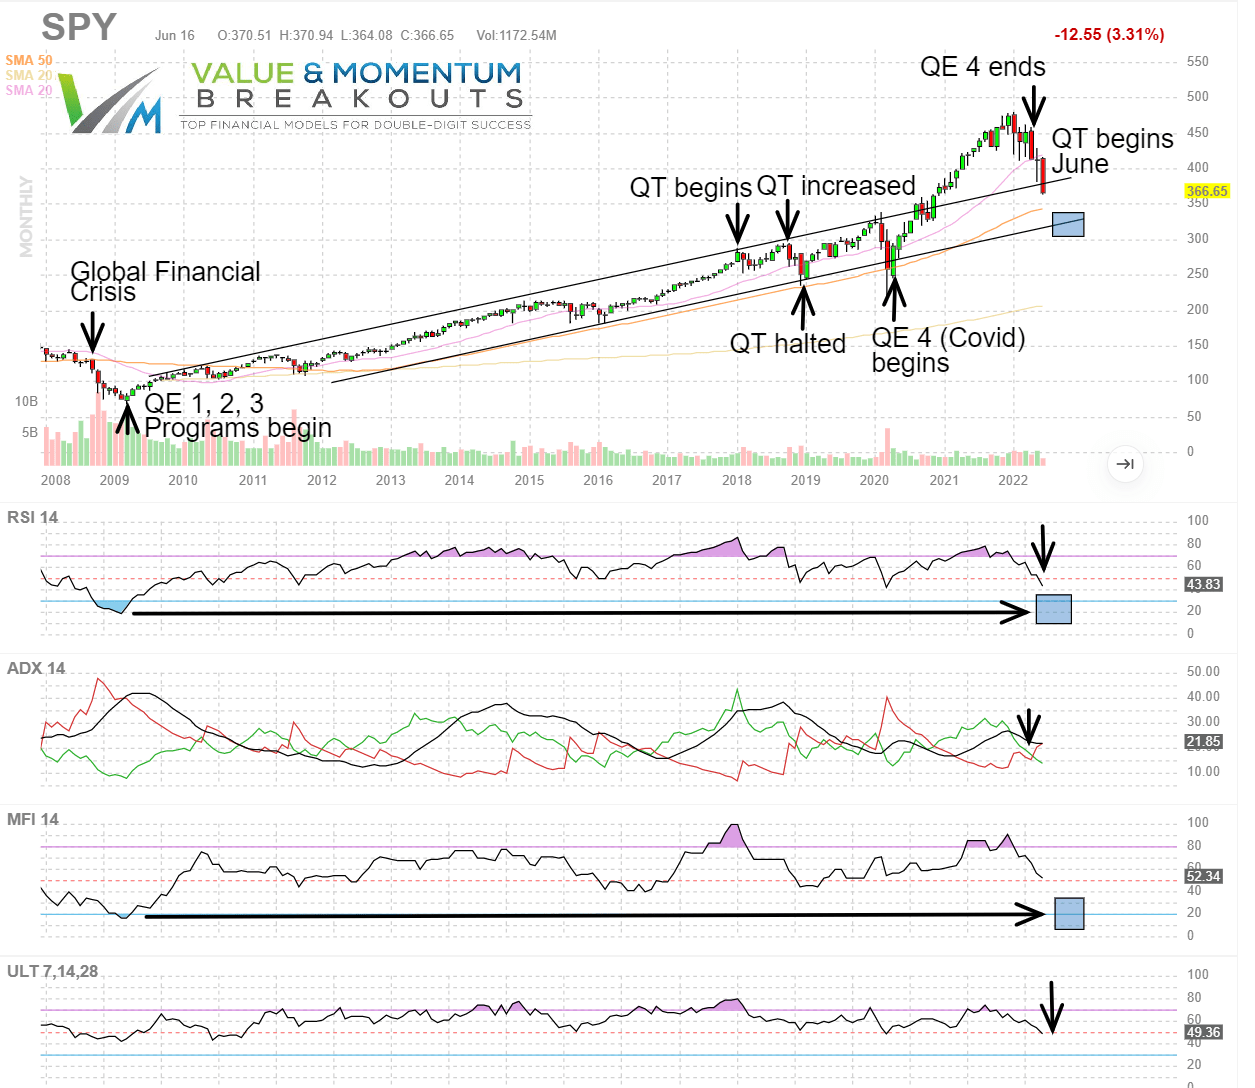
CNN.Money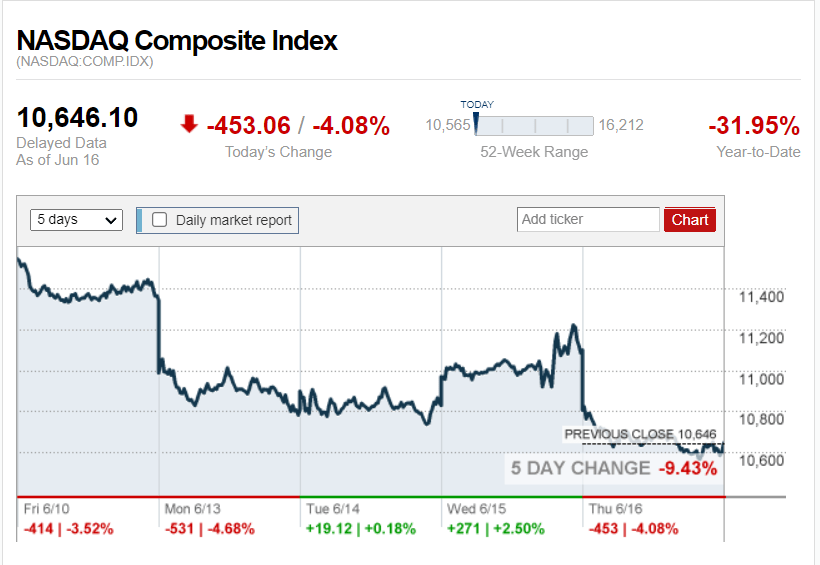
The Nasdaq 100 index is in technical breakdown conditions and below key support of 12,000 level. The daily chart of the Nasdaq 100 index fund (QQQ) shows the most recent Momentum Gauge topping signals, with the index down -9.43% in the past 5 days.
FinViz.com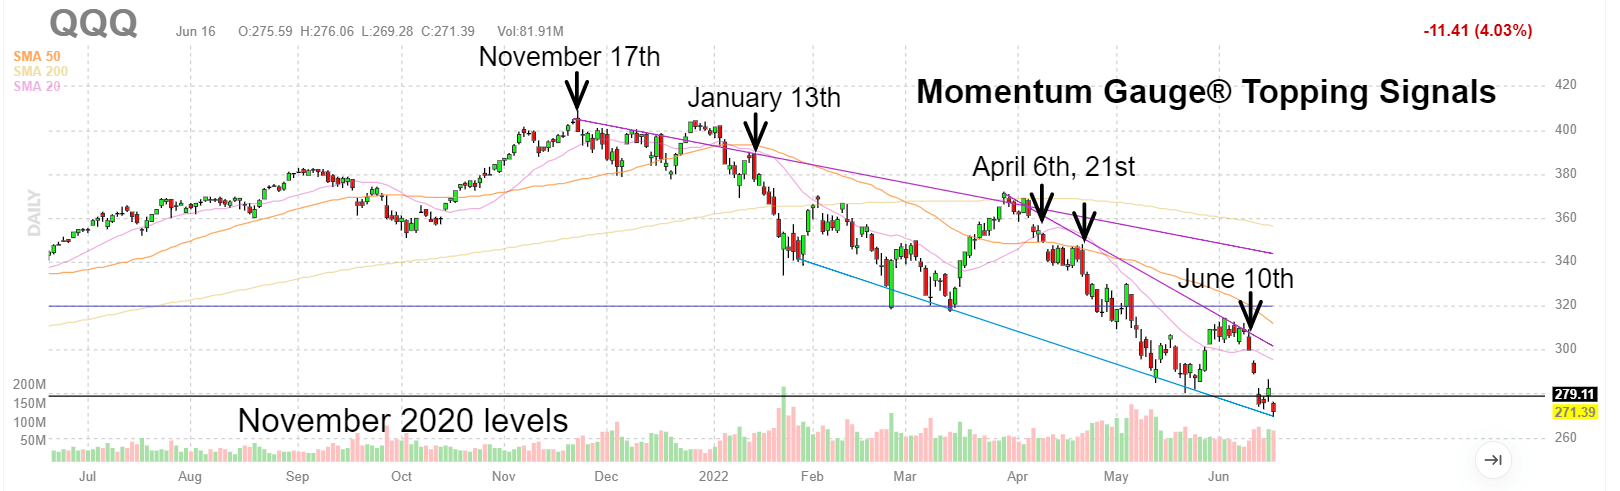
The Prior Negative Signals In Advance Of Major Downturns
Back on November 17th the negative signal marked the 19th major negative Momentum Gauge® signal since publication of the model began in 2018. As the charts and indicators illustrate below, this current January signal is far more negative than the start of the November signal and the largest negative signal of the short 2022 trading year. In fact, the declines after the signal have seen the worst start to January trading since 2009.
VMBreakouts.com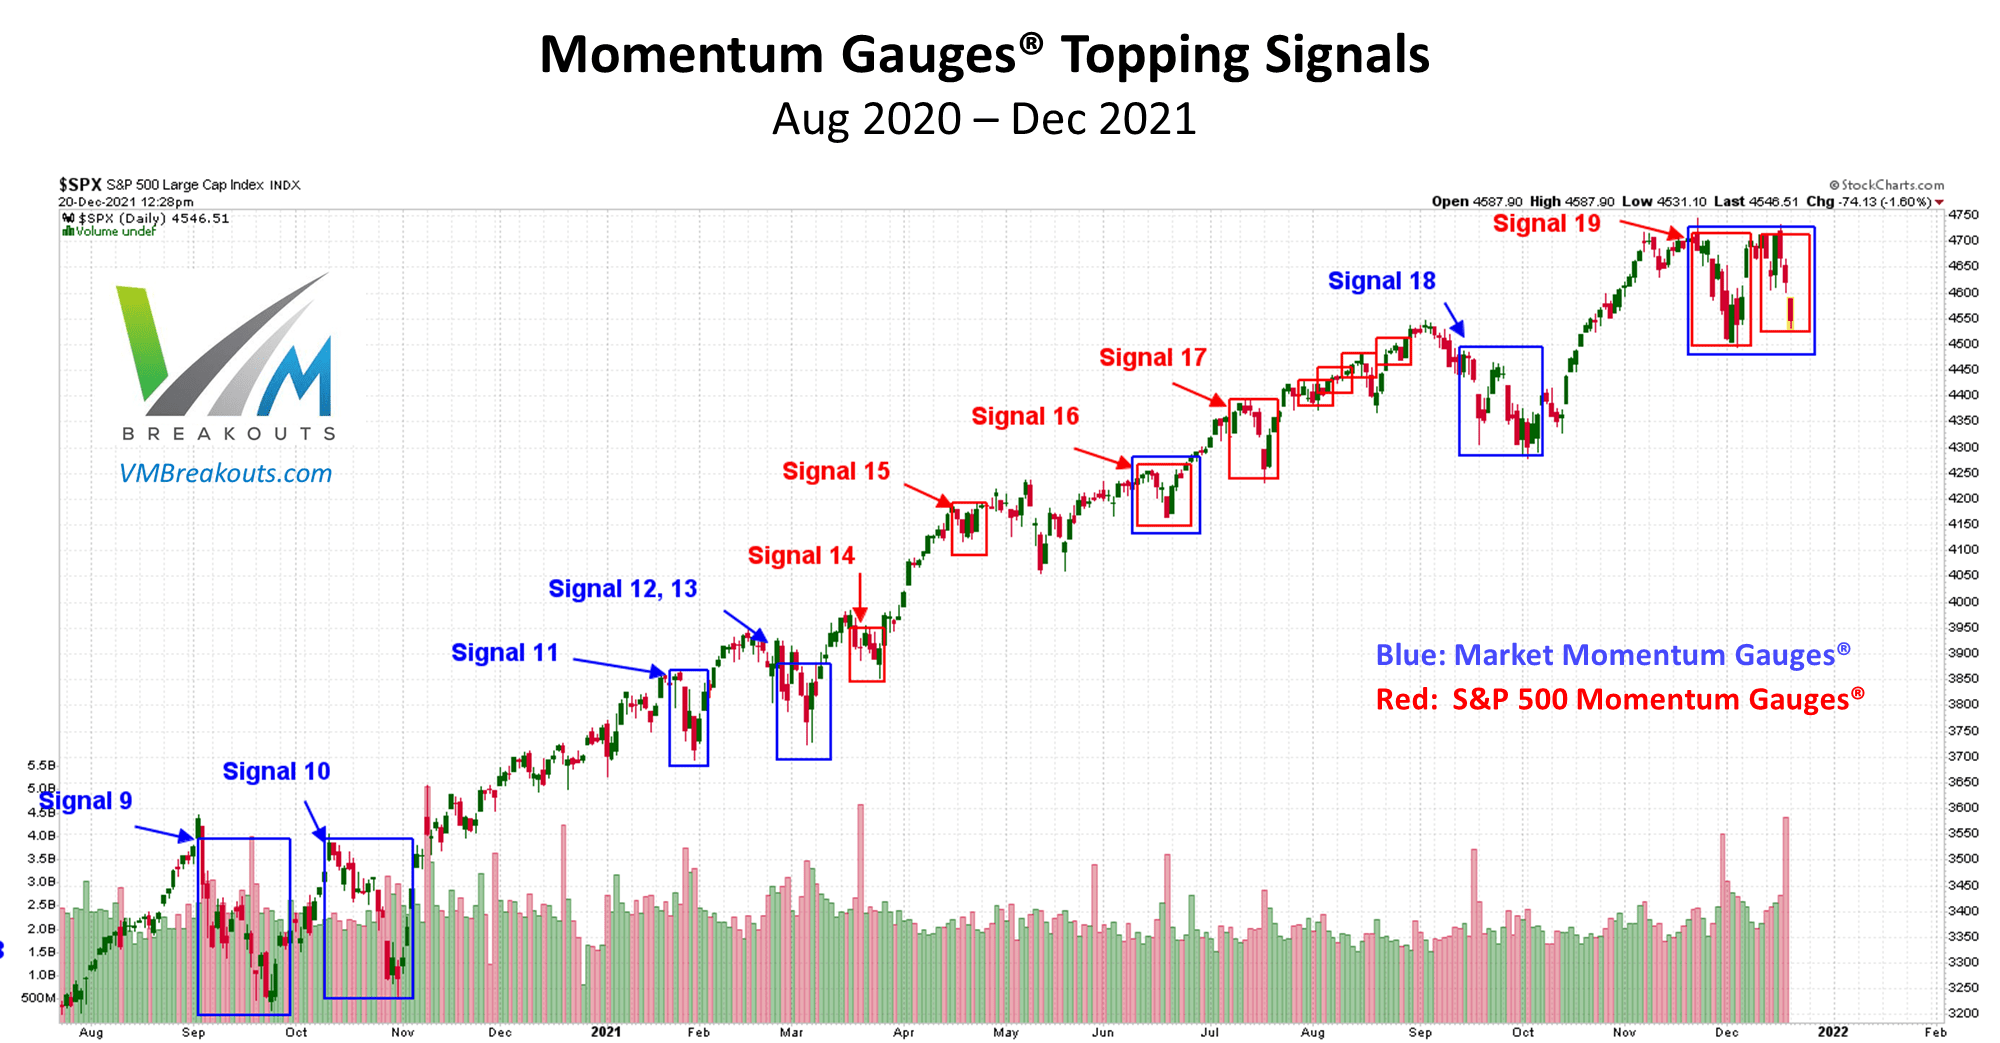
VMBreakouts.com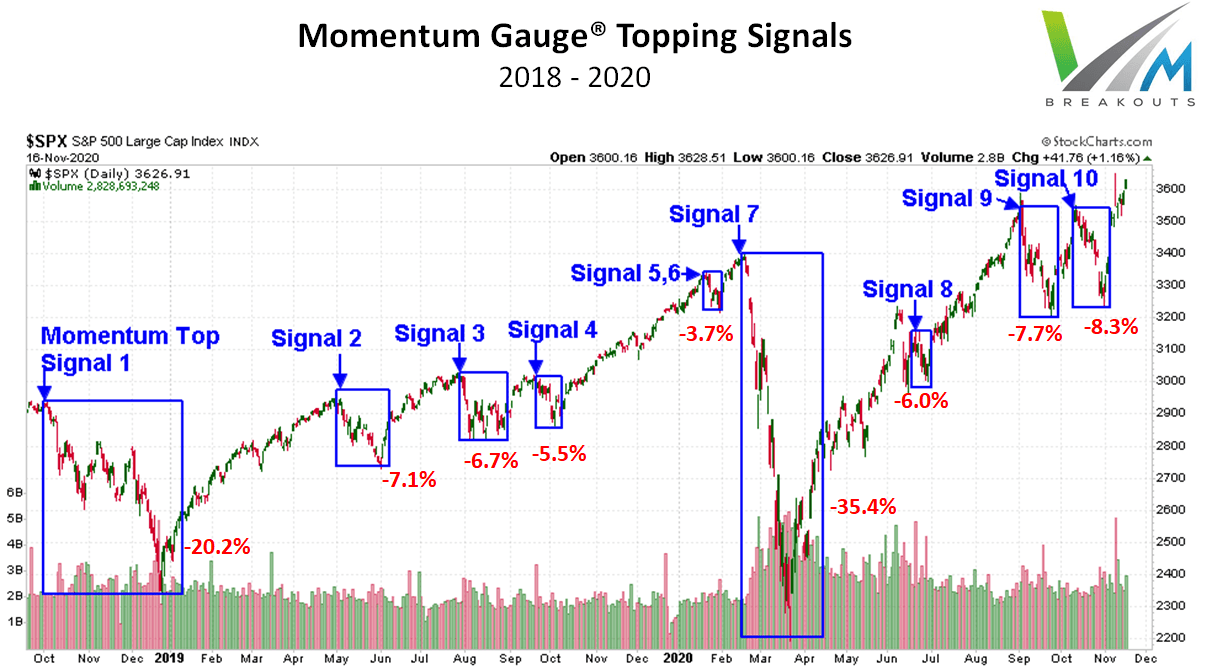
Review Of Prior Signals
- Signal 20 (January 13th, 2022) Momentum Gauge Topping Signal: The First Negative Signal In 2022
-
Signal 19 (November 17th, 2021) Momentum Gauge Topping Signal: The Second Largest 2021 Negative Signal To Date
- Signal 16 (June 17th, 2021) Momentum Gauge Topping Signal June 17: The Largest Negative Signal In 2021
- Signal 11 (January 29, 2021): First Negative Momentum Gauge® Signal For 2021: Reviewing The Signals | Seeking Alpha Marketplace
- Signal 9-10 (September 13, 2020): An Election Year Correction Signal And Only The 3rd Negative Weekly MG Signal In 2020
- Signal 8 (June 24, 2020): Evaluating The 8th Market Correction Signal On June 24th That Has Preceded Every Recent Decline
- Signal 7 (March 23, 2020): Revisiting The Signals That Forecasted Every Recent Decline, In Search Of Early Recovery Indicators
- Signals 4-6 (Jan 28, 2020) : Revisiting The Signals That Forecasted Every Major Downturn Since “Volmageddon”: What’s Next
- Signals 1-3 (Aug 8, 2019): These 3 Measures Forecasted Every Major Downturn Since QT Started: What’s Next
Conclusion
The Momentum Gauges® are part of an active research project that has delivered highly profitable results to many readers of my published financial articles. I continue to enhance the model as we gather more data over many more months and years. The current market conditions with increasing rate hikes and the start of the Fed quantitative tightening program may contribute to weaker than average performance for 2022. Historically from 1950 the sixth month period between May and October averages the worst for the S&P 500 of any six-month period. The current Fed tightening conditions and approach of a potential recession may further increase the market risks this year.
LPL Research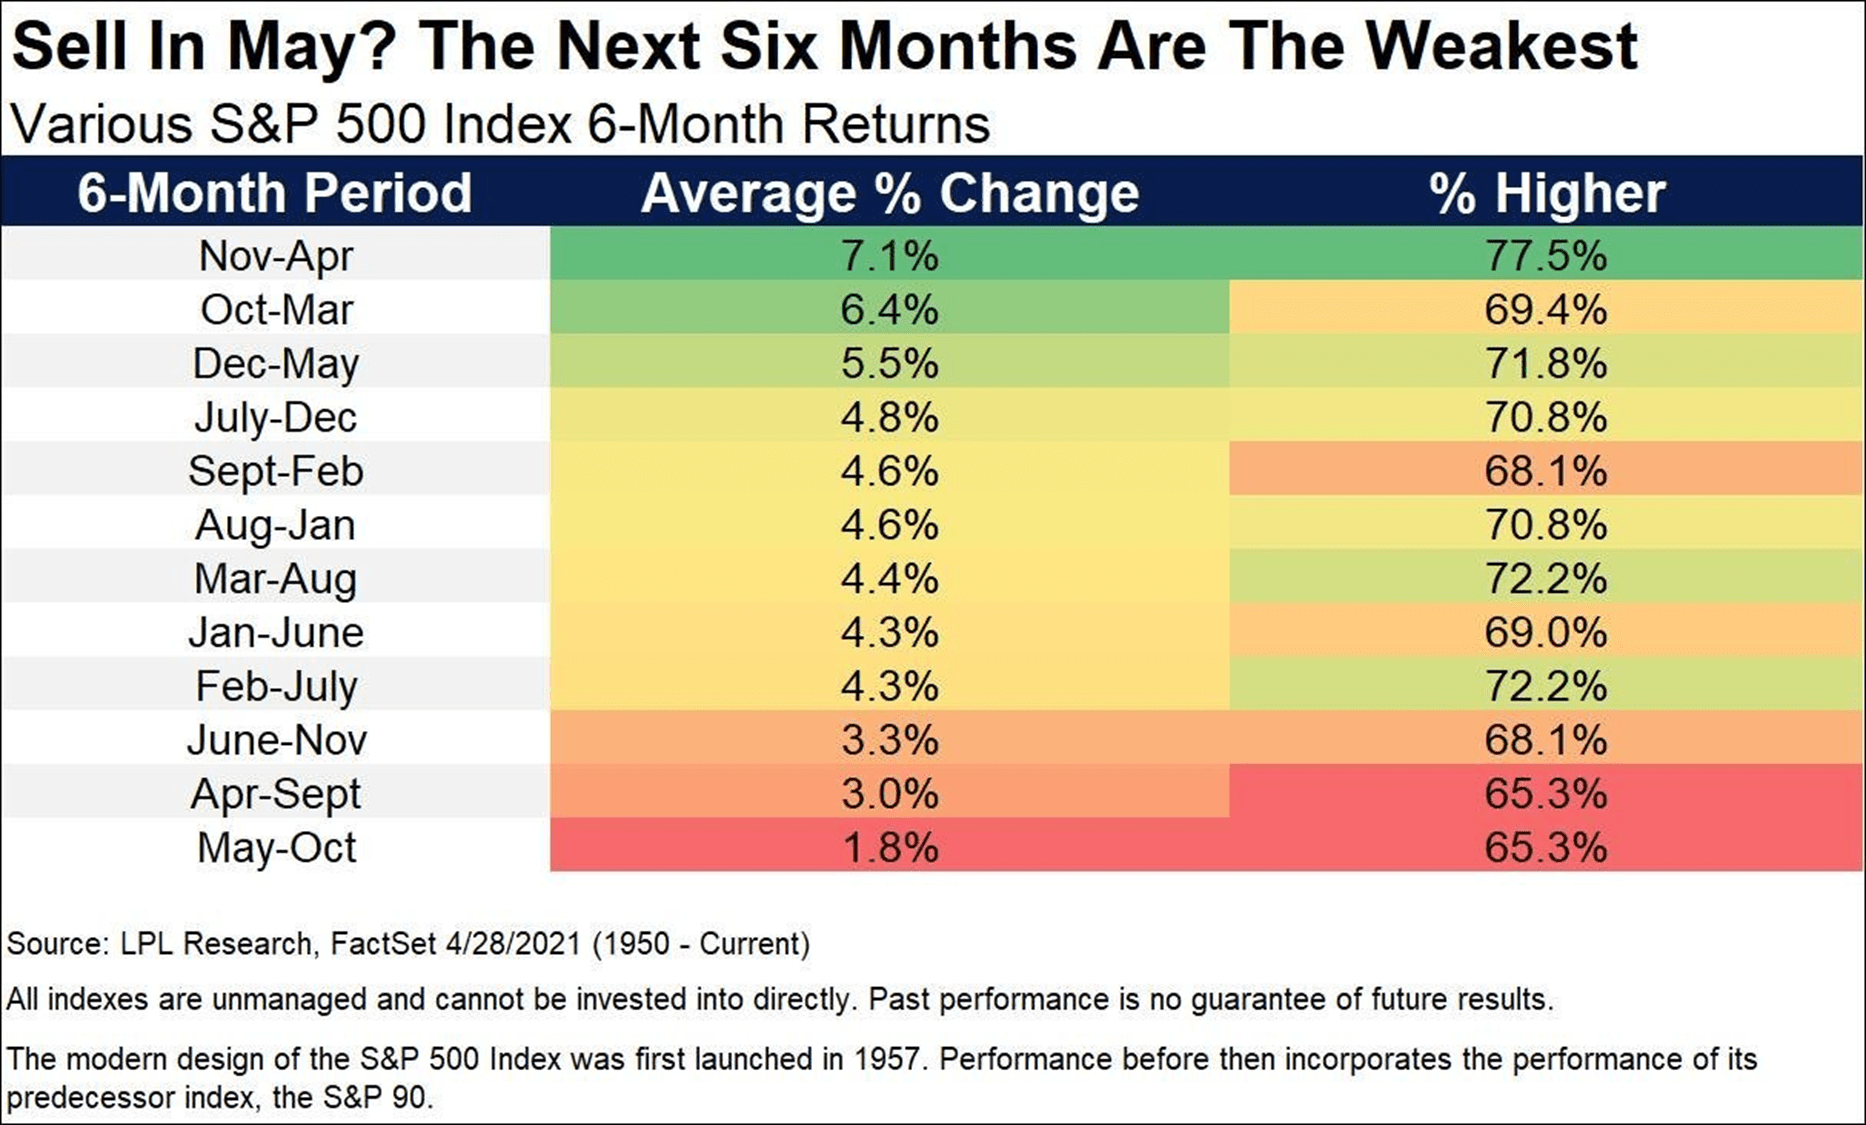
I hope this analysis provides you with additional market insight that benefits your trading in the year ahead.
All the very best to you!
JD Henning, PhD, MBA, CFE, CAMS
Be the first to comment