

jzabloski/E+ via Getty Images
IDEX Corporation (NYSE:IEX) came on my radar during 2021 and I’ve been following it since. IDEX is a diversified industrial company that focuses on highly engineered and specialized equipment across just about every industry you can think of. IDEX is split into 3 segments: (1) Fluid and Metering Technology, (2) Heath & Science Technology, and (3) Fire & Safety / Diversified. For FY 2021 revenues were 36%, 41%, and 23%, respectively with operating margins around 27% for each segment.
What intrigues me about IDEX is that they focus on niche industrial markets that require specialized and engineer solutions. Those solutions in turn should lead to repeat business as their customers and end markets expand.
IDEX Corporation’s share price has fallen over 27% since late 2021 roughly in-line with the broader market. However, the valuation at that time seemed to be quite rich. With the decline in share price I wanted to re-visit IDEX Corporation to see if now could be the time to add this diversified industrial to my portfolio.
Dividend History
Dividend growth investing is the strategy that most appealed to me when I began my investment journey. By focusing on businesses that have a history of both paying and growing their dividends over time you’re more likely to find quality business that has already been through several economic cycles while coming out unscathed.
Idex Corporation Dividend History (IEX Investor Relations)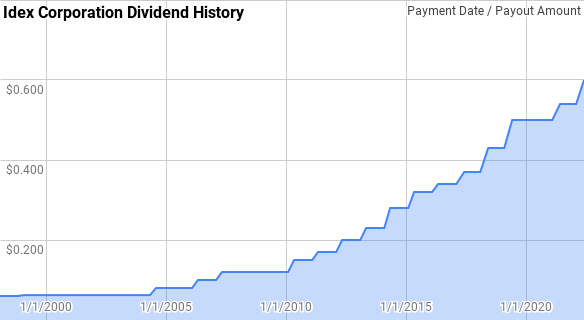
IDEX is a Dividend Contender with 13 consecutive years of dividend growth with raises coming every year since 2010 after a brief pause in 2009 to their dividend growth. In May they announced a solid 11% increase to the quarterly payout.
Dating back to 2003 IDEX has given investors annual raises ranging from 0.0% to 21.1% with an average of 12.7% and a median of 14.5%.
Over that time there’s been 15 rolling 5-year periods with annualized dividend growth ranging from 9.6% to 17.4% with an average of 12.8% and a median of 12.5%.
There’s also been 10 rolling 10-year periods with IDEX’s annualized dividend growth rate spanning 11.8% to 14.9% with an average and median of 13.4%.
The rolling 1-, 3-, 5- and 10-year period annualized dividend growth rates from IDEX since 2003 can be found in the following table.
| Year | Annual Dividend | 1 Year DGR | 3 Year DGR | 5 Year DGR | 10 Year DGR |
| 2003 | $0.25 | ||||
| 2004 | $0.28 | 14.29% | |||
| 2005 | $0.32 | 12.50% | |||
| 2006 | $0.38 | 18.75% | 15.15% | ||
| 2007 | $0.46 | 21.05% | 17.38% | ||
| 2008 | $0.48 | 4.35% | 14.47% | 14.04% | |
| 2009 | $0.48 | 0.00% | 8.10% | 11.03% | |
| 2010 | $0.57 | 18.75% | 7.41% | 12.24% | |
| 2011 | $0.66 | 15.79% | 11.20% | 11.67% | |
| 2012 | $0.77 | 16.67% | 17.06% | 10.85% | |
| 2013 | $0.89 | 15.58% | 16.01% | 13.14% | 13.59% |
| 2014 | $1.07 | 20.22% | 17.48% | 17.39% | 14.17% |
| 2015 | $1.24 | 15.89% | 17.21% | 16.82% | 14.51% |
| 2016 | $1.34 | 8.06% | 14.61% | 15.22% | 13.43% |
| 2017 | $1.45 | 8.21% | 10.66% | 13.49% | 12.17% |
| 2018 | $1.66 | 14.48% | 10.21% | 13.28% | 13.21% |
| 2019 | $1.93 | 16.27% | 12.93% | 12.52% | 14.93% |
| 2020 | $2.00 | 3.63% | 11.32% | 10.03% | 13.37% |
| 2021 | $2.12 | 6.00% | 8.49% | 9.61% | 12.38% |
| 2022 | $2.34 | 10.38% | 6.63% | 10.04% | 11.76% |
Source: Author; Data Source: IDEX Corporation Investor Relations
As a dividend growth investor, the dividend payout ratio is a key metric to track. The payout ratio lets you know much of a business’ earnings or free cash flow has been committed to the dividend and in turn how safe the dividend is from temporary setbacks in the company.
IEX Dividend Payout Ratios (IEX SEC Filings)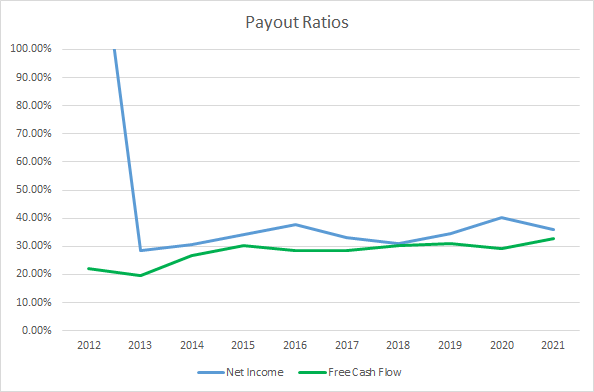
Excluding FY 2012, IDEX has averaged a 34% net income payout ratio over the last 9 years and for the most recent 5 years the average is 35%. The 10-year average fee cash flow payout ratio is 28% with the 5-year average at 30%. Historically, IDEX’s dividend has been well covered by both net income and free cash flow.
Quantitative Quality
As your investment horizon expands the business’ fundamentals become more important to the investment results that you will achieve. As such, before investing in a business, I want to see how it has performed historically to try in order to get an idea of the business quality.
IEX Revenue Profits and Cash Flow (IEX SEC Filings)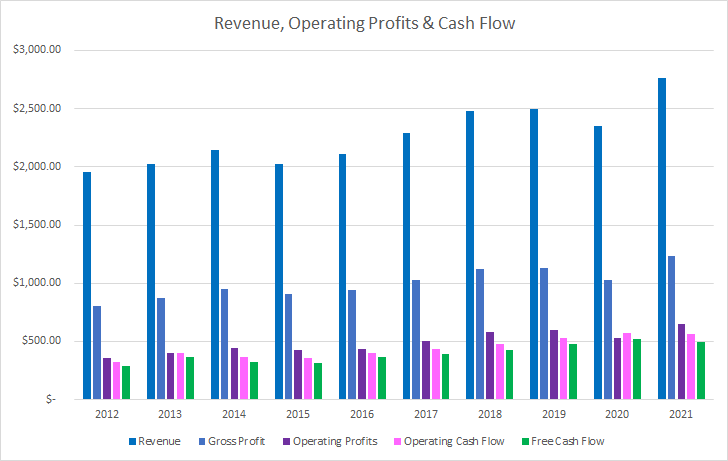
IDEX hasn’t shown impressive revenue growth over the last decade; however, growth has been fairly consistent with only two year over year declines one of which was FY 2020 which is understandable. Over the last decade IDEX has grown revenues 41.5% in total of 3.9% annually.
During that same time, gross profits increased 53.6% in total or 4.9% annually with operating profits rising 79.9% or 6.7% annually. Operating cash flow increased in line with operating profits improving 73.3% or 6.3% annualized. Free cash flow outpaced revenue growth; however, it didn’t quite keep track with operating cash flow. Over that time free cash flow rose 69.6% in total of 6.0% annually.
My expectation is that business that has some kind of competitive advantage will be able to show at a minimum stable and more likely rising margins over time. My preference is to see free cash flow margins greater than 10%.
IEX Margins and CCR (IEX SEC filings)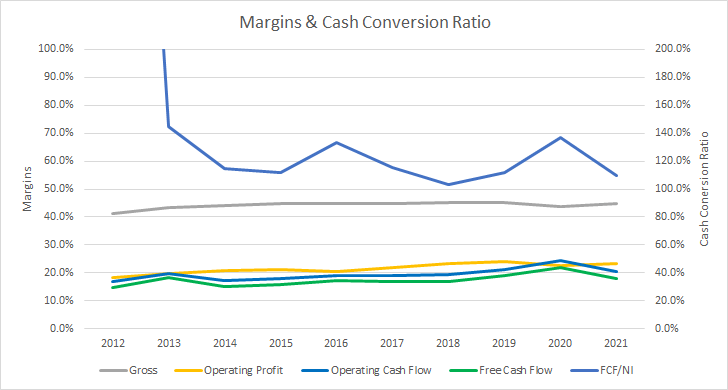
IDEX has maintained consistent gross profit margins during the last decade. The 10-year average is 44.2% with the 5-year average at 44.7%.
Free cash flow margins have also generally been on the rise during that time with a 10-year average of 17.4% and a 5-year average of 18.6%. Those are handily over the 10% threshold that I like to see.
I also monitor how well the business is able to generate free cash flow compared to the capital invested in the business by tracking the free cash flow return on invested capital, FCF ROIC. I want to see the business be able to maintain stable and preferably rising FCF ROIC’s over time.
IEX Free Cash Flow Returns (IEX SEC filings)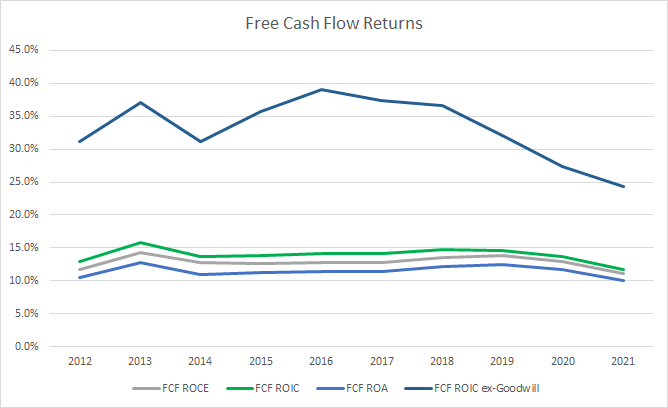
Prior to the pandemic, IDEX has seen a slowly improving FCF ROIC; however, as many businesses faced big headwinds during that time their FCF ROIC has pulled back. That being said, IDEX has sustained a greater than 10% ROIC every year over the last decade. The 10-year average FCF ROIC for IDEX is 13.9% with the 5-year average sitting at 13.8%.
In order to try and understand how IDEX uses its free cash flow I calculate three variations of the metric, defined below:
- Free Cash Flow, FCF: Operating cash flow less capital expenditures
- Free Cash Flow after Dividend, FCFaD: FCF less total cash dividend payments
- Free Cash Flow after Dividend and Buybacks, FCFaDB: FCFaD less net cash used in repurchasing shares
IEX Free Cash Flows (IEX SEC Filings)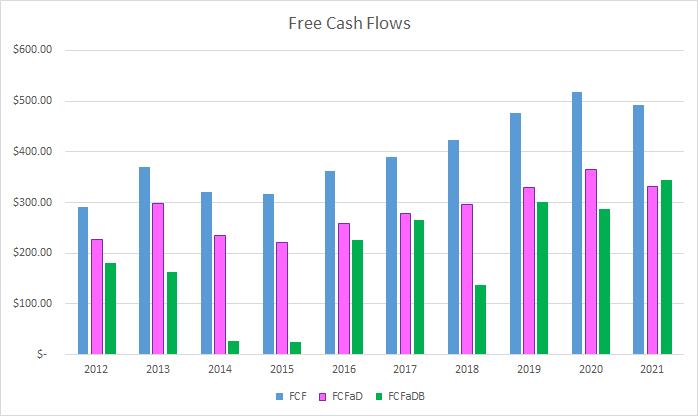
Over the last decade IDEX has generated a total of $4.0 B in FCF, not bad for a company that was trading at a sub-$4.0 B market cap 10 years ago. IDEX has paid out a total of $1.1 B to shareholders in dividends over that time putting the cumulative FCFaD at $2.8 B. IDEX has also spent a net total of $0.9 B on repurchasing shares which has the cumulative FCFaDB at $2.0 B during the last decade.
If a business has plenty of excess cash flow share repurchases can be a great way to return additional cash to shareholders without as much of a commitment as dividends. Share repurchases reduce the pieces of the proverbial business pie in effect making each piece bigger.
IEX Shares Outstanding (IEX SEC filings)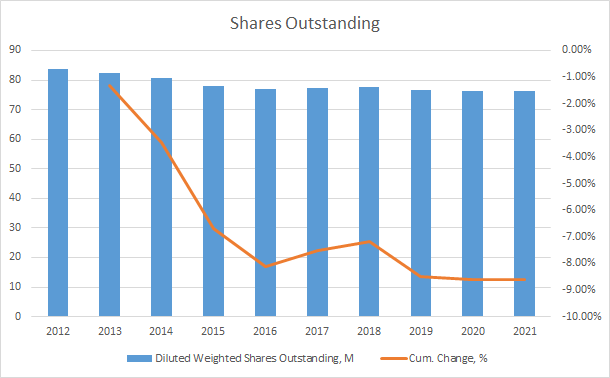
As we saw in the free cash flow chart, IDEX doesn’t commit to regular share repurchases preferring instead a more lumpy allocation to buybacks. In total IDEX’s shares outstanding have fallen 8.6% during the last decade or roughly 1.0% annually. However, nearly all of that reduction came between Fy 2012 and FY 2016 with the share count remaining relatively stable since then.
As an investor in the equity of a business I want to make sure that the business doesn’t carry too much debt as excessive debt could potentially impair my investment. One metric I track is the debt-to-capitalization ratio to see how the business is capitalized. While I prefer to see no debt, a higher priority is for me to see stable debt levels over time.
IEX Debt to Capitalization (IEX SEC filings)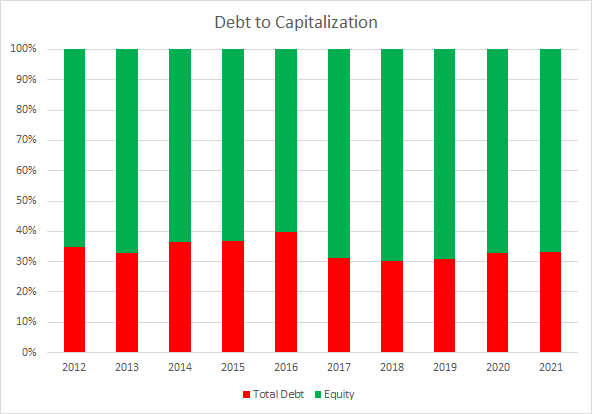
IDEX has maintained steady debt-to-capitalization ratios over time with minor year-to-year fluctuations. The 10-year average ratio is 34% with the 5-year average coming to 32%.
The net debt ratios weigh heavier on the reasonableness of the debt load. The net debt ratios examine the net debt compared to some measure of profits or cash flow. In effect the net debt ratios let you know how quickly the company could de-lever if necessary assuming no drastic impairments to the underlying business.
IEX Debt Ratios (IEX SEC filings)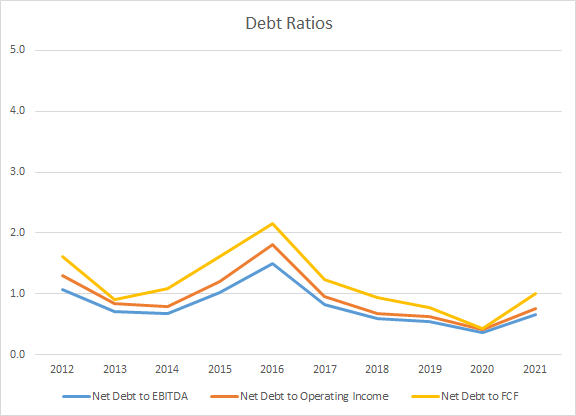
IDEX has maintained fairly conservative net debt ratios during the last decade. The 10-year average net debt-to-EBITDA, net debt-to-operating income, and net debt-to-FCF ratios are 0.8x, 0.9x, and 1.2x, respectively. Likewise the 5-year averages are 0.6x, 0.7x, and 0.9x. IDEX’s debt levels appear to be well in control and pose little risk at this time.
Valuation
For valuing potential investments I use several valuation methods to try and value the business from different perspectives. The methods that I utilize are the minimum acceptable rate of return, MARR, analysis, dividend yield theory, and a reverse discounted cash flow model.
Analysts expect IDEX to have FY 2022 EPS of $7.63 and FY 2023 EPS of $8.21. They also expect IDEX to be able to grow EPS 12.0% annually across the next 5 years. I then assumed that IDEX’s EPS growth would decline to 5.0% annually for the following 5 years. Dividends are assumed to target a 30.0% payout ratio.
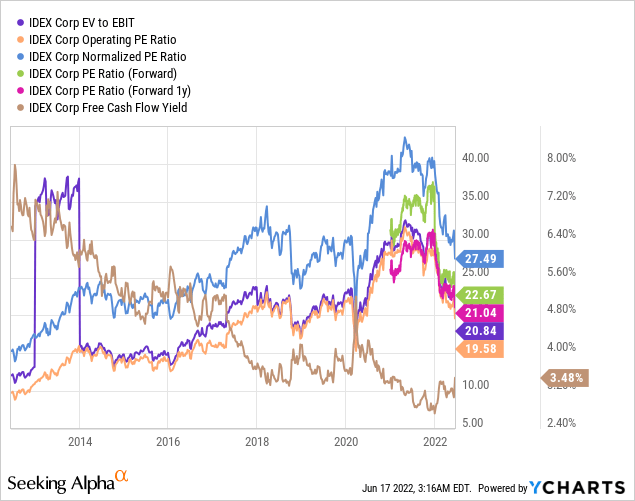
In order to try and determine a reasonable terminal multiple to value the future earnings at I like to see how investors, collectively, have valued IDEX in the past. In the first half of the decade, IDEX was typically valued between ~15x and 25x TTM EPS and over the last half the range has been closer to between 25x and 30x. For the MARR analysis I’ll examine multiples spanning 15x to 30x.
The following table shows the potential internal rates of return that an investment in IDEX could generate provided you believe the growth estimates from above are reasonable forecasts for how the future plays out. Returns assume a purchase price of $173.41, Thursday’s closing price, and that dividends are taken in cash.
| IRR | ||
| P/E Level | 5 Year | 10 Year |
| 30 | 18.4% | 11.9% |
| 25 | 13.9% | 9.9% |
| 22.5 | 11.4% | 8.8% |
| 20 | 8.6% | 7.6% |
| 17.5 | 5.5% | 6.2% |
| 15 | 2.1% | 4.6% |
Source: Author
Alternatively, I use the MARR analysis framework to work backwards in order to determine what price I could pay today in order to generate the returns that I desire from my investments. My base hurdle rate is a 10% IRR and for IDEX I’ll also examine 12% and 8% return thresholds.
| Purchase Price Targets | ||||||
| 10% Return Target | 12% Return Target | 8% Return Target | ||||
| P/E Level | 5 Year | 10 Year | 5 Year | 10 Year | 5 Year | 10 Year |
| 30 | $242 | $204 | $224 | $174 | $262 | $241 |
| 25 | $204 | $174 | $188 | $148 | $221 | $205 |
| 22.5 | $184 | $159 | $170 | $135 | $200 | $187 |
| 20 | $165 | $143 | $153 | $122 | $179 | $168 |
| 17.5 | $146 | $128 | $135 | $110 | $158 | $150 |
| 15 | $126 | $113 | $117 | $97 | $137 | $132 |
Source: Author
Dividend yield theory is a valuation methodology that operates under the premise that investors will value a business around a normalized dividend yield. For IDEX Corporation I’ll use the average 3-year forward dividend yield as a proxy for the fair value.
IDEX Corporation Dividend Yield Theory (IDEX Corporation Investor Relations and Google Finance)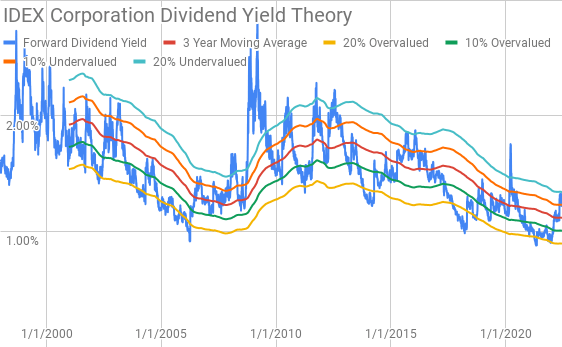
IDEX Corporation currently offers a forward dividend yield of 1.38% compared to the 3-year average forward dividend yield of 1.12%.
A reverse discounted cash flow analysis can be used to figure out what the current market valuation implies about the future growth, margins and cash flows that a business needs to generate. In other words it’s a way to find out what you need to believe about the company in order for it to generate the cash flows to support the current valuation given your hurdle rate.
I use a simplified DCF model based on revenue growth, an initial free cash flow margin of 16.1% that improves to 19.0% during the forecast period, and a terminal growth rate of 3.0%. Inputting those assumptions into the DCF model shows that IDEX Corporation needs to grow revenues 11.6% annually from FY 2022 through FY 2013 in order to generate the requisite cash flows to support a 10% return. Reducing the return threshold to 8% lowers the necessary revenue growth to 6.0% annually.
Conclusion
IDEX Corporation is a company that I’ve had my eye on since I stumbled upon it last year. What intrigues me about the business that (1) they are diversified across several end markets and, (2) many of their products are highly engineered and specialized which creates sticky customers.
IDEX hasn’t been the fastest grower out there, even among their industrial cohorts, with revenues only rising 3.9% annually over the last decade. However, thanks to improving profitability free cash flow has grown at a 6.0% pace over that same time.
IDEX has also been able to maintain strong free cash flow margins in the upper teens with free cash flow ROIC’s around 14%.
Dividend yield theory suggests a fair value range between $195 and $238. The MARR analysis assuming a 10% return target 5 years out and an exit multiple between 17.5x and 22.5x puts the fair value range between $146 and $184. Lowering the return threshold to 8% increases the fair value range to between $158 and $200.
The reverse DCF shows that 10% returns will likely be hard to come by from here as it requires a massive improvement in IDEX corporations growth and/or margins. Even 8% returns could be difficult to reach as it requires revenue growth that has outpaced what IDEX has achieved over the last decade.
Share repurchases could be a potential lever that IDEX could employ to improve the per share value. Using the 3-year average FCFaD of $342 M IDEX could retire approximately 2.5% of the outstanding shares at current levels. However, IDEX has not consistently used share repurchases so I’m skeptical that management would commit to a significant and consistent buyback program. Although, I would expect to see share repurchases increase if the share price continues to retreat. In Q1 IDEX repurchased approximately 148k shares for $28 M which works out to around $189 per share.
I would also expect M&A activity to increase should valuations continue to move lower as calls for a recession get louder. IDEX has the balance sheet and cash flow to support M&A given attractive valuations.
While I’m interested in IDEX the business I couldn’t really get behind the valuation. The share price, and in turn valuation, has pulled back significantly sitting over 27% off the high from late 2021. In my opinion that’s moved IDEX to at best the upper end of fair value and still requires a lot to go right from here in order to generate adequate returns.
I’ll continue to monitor IDEX Corporation; however, I wouldn’t feel comfortable adding shares to my portfolio until the share price retreats to somewhere in the mid-to-low $150s. At that level I believe that forward returns would be much more attractive.
Be the first to comment