undefined undefined/iStock via Getty Images
Two points on inflation:
Paul Krugman argues that inflation is about to decrease, arguing that the “bullwhip effect” is in play:
Beyond that, there are growing indications that the bullwhip is about to flick back.
What? The bullwhip effect is a familiar issue for products that are at the end of long supply chains: Changes at the consumer end can lead to greatly exaggerated changes farther up the chain. Suppose, to take a non-random example, that a shift to working from home — then, coronavirus panic — leads to increased purchases of supermarket toilet paper (which is a somewhat different product from the stuff used in offices). Consumers, seeing a shortage, rush to stock up; supermarkets, trying to meet the demand, overorder; distributors who supply the supermarkets overorder even more; and suddenly there are no rolls to be had.
The Cleveland Fed released its latest median and 16% trimmed mean CPI indexes, which are designed to show the inflation rate independent of outlier components. As the bank explains:
Benefits: By omitting outliers (small and large price changes) and focusing on the interior of the distribution of price changes, the median CPI and the 16 percent trimmed-mean CPI can provide a better signal of the underlying inflation trend than either the all-items CPI or the CPI excluding food and energy (also known as core CPI).
Here’re the charts:
Cleveland Fed CPI Indexes (Cleveland Fed)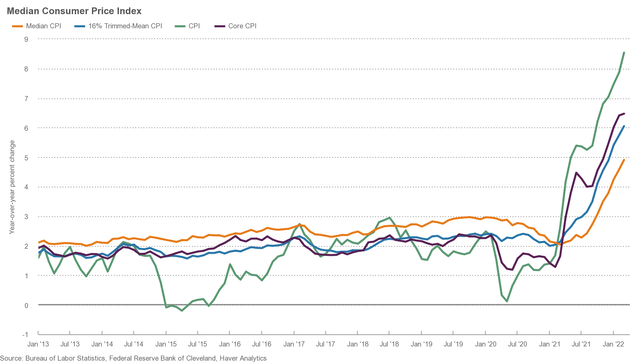
Median CPI is right below 5% while the 16% trimmed mean CPI is slightly above 6%. Both still have a strong, upward trajectory.
Consider the following two tables:
EMA picture of defensive and aggressive ETFs (Data from StockCharts; author’s calculations)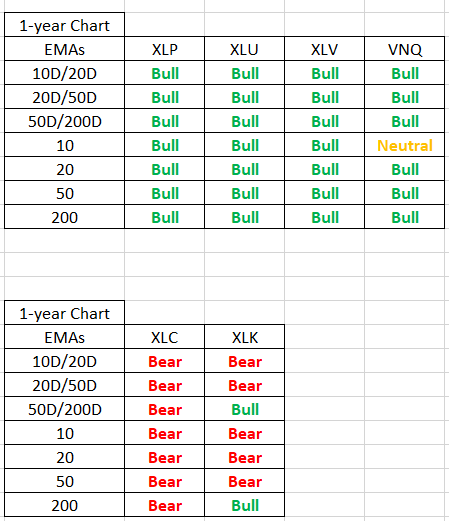
The EMA alignment for defensive sector ETFs is very bullish while the EMA alignment for tech and communication services (two aggressive sectors) is negative. This means the market is pretty bearish.
JPMorgan increased its reserves:
JPMorgan Chase & Co. added $902 million to its reserves for bad debt, saying the odds of a recession were slightly higher because of rising inflation and the war in Ukraine.
The increase, the bank’s first since the depths of the pandemic in 2020, included about $300 million linked to Russia, Chief Financial Officer Jeremy Barnum said Wednesday on a conference call with analysts. The rest reflects recession concerns.
The possibility of an economic downturn sparked by Federal Reserve interest-rate hikes moved from “low” to “slightly less low,” Barnum said.
Add this to an increasing number of concerning negative credit market developments, which typically precede a recession by 12-18 months.
Let’s take a look at three sets of charts:
IWM 3-month, 1-month, and 2-week (StockCharts)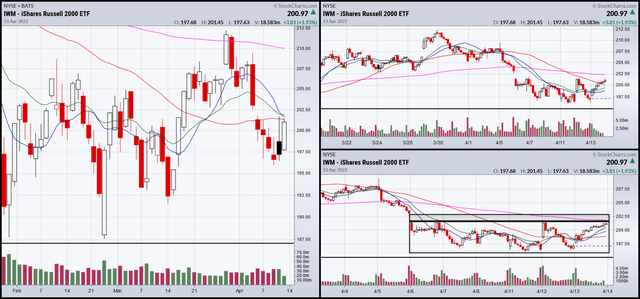
The IWM is trying to bottom. The lower right chart shows that prices are consolidating. There’s a second shaded area above that which shows the breadth of the gap lower. A solid move through that box and above the 200-minute EMA would be a strong, potentially bullish move.
3-month, 1-month, and 2-week QQQ chart (StockCharts)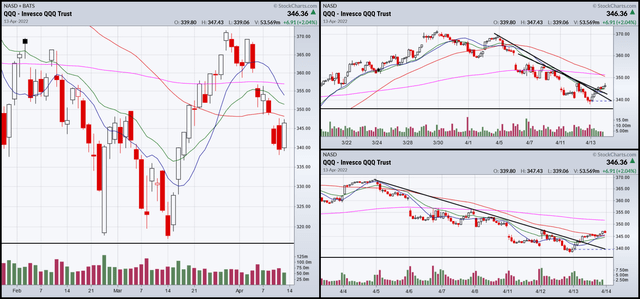
The QQQ has broken through resistance on the 1-month and 2-week charts.
3-months, 1-month, and 2-week charts (StockCharts)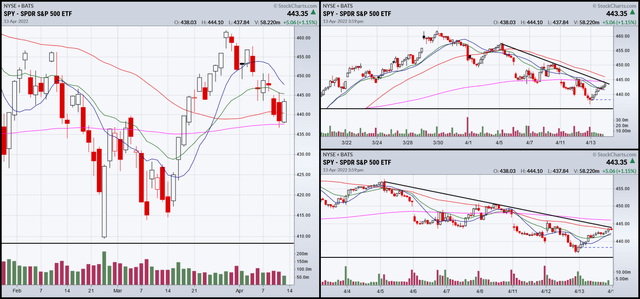
The SPY is still consolidating in a downward sloping pattern (two charts on the right).
At mid-week, things are fair. The market is trying to improve but hasn’t made significant bullish technical progress yet.


Be the first to comment