

Microsoft (MSFT), Earnings, FAANG, Tech, Nasdaq 100 and Dow Talking Points:
- The Market Perspective: Nasdaq 100 Range from 11,600 to 10,600
- While tech-giant Microsoft reported a better-than-expected $2.32 EPS, its revenues fell approximately $700 million short of consensus estimates
- Despite the mixed basic financial performance, MSFT shares rallied as much as 5.3 percent higher from Tuesday’s official close – bringing the market close to the 200-day SMA at 256
Recommended by John Kicklighter
How to Trade FX with Your Stock Trading Strategy
The US equity market looks as if it could use some tangible fundamental backing to make a genuine run at an earnest bull run. There have been a few provocative technical moves lately that have stirred some speculative appetite for a more determined bullish charge: such as the Nasdaq 100’s charge through 11,700 or the S&P 500’s close above 4,000. Yet, these accomplishments (from Monday) have been immediately cast in doubt with the markets stalling out the subsequent trading day. While the market’s broader trend can ultimately prove a hodgepodge of motivations and influences, conviction is better suited by a clear and dominant fundamental drive. Shy of a systemic view on risk trends, an update on US recession risks (4Q US GDP is due Thursday) or definitive update on monetary policy (the FOMC decision in next Wednesday), what can offer traction? Perhaps earnings.
Thus far in the earnings season, we have absorbed some interesting updates and even more remarkable market responses. Last week, the top focus was Netflix which leveraged its surprise subscriber numbers to a bullish breakout and charge that has extended through Wednesday’s close. In the week prior, the focus was the top bank earnings which have been mixed and peppered with ‘recession’ warnings. Among tickers like JPM, C and GS; the market performance has been much more uneven. After this past session’s close, the focus is more firmly shifting into the dominant tech space. Microsoft beat on EPS (earnings per share), but feel shy on analysts’ revenue forecasts.
The hard numbers from Microsoft:
- EPS: $2.32 versus $2.27 expected
- Revenue: $52.75 Bln versus $53.48 Bln expected
- Cloud Revenue: $21.5 Bln versus $21.4 Bln expected
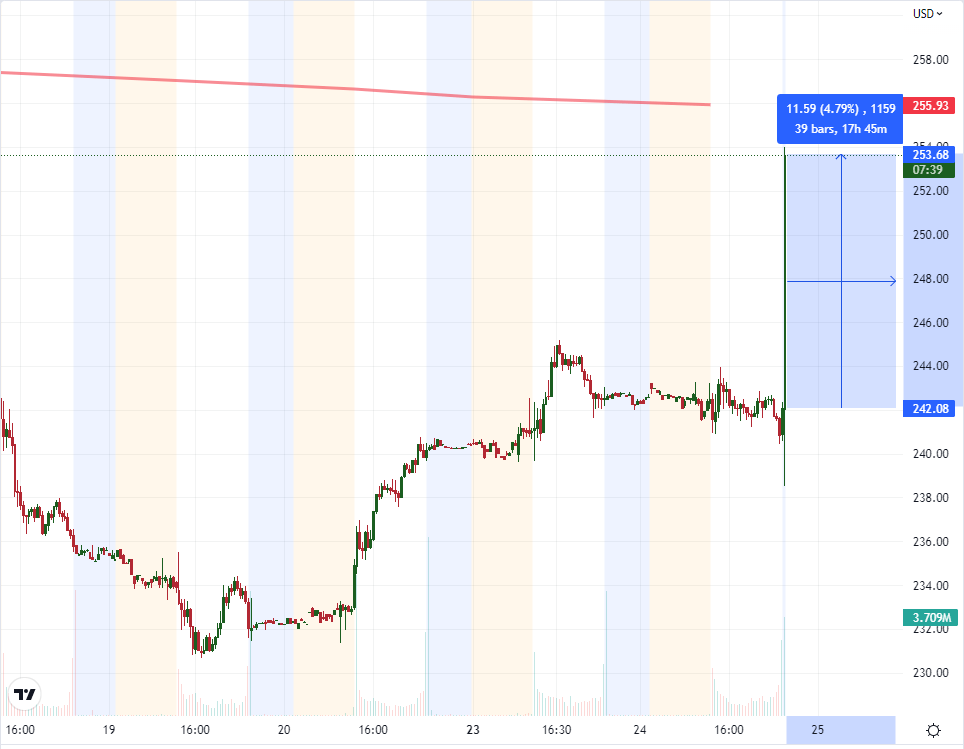
Chart of MSFT with Pre- and Post-Exchange Trading (15 Minutes)
Chart Created on Tradingview Platform
Despite the mixed picture on the accounting front, the market response was fairly straightforward in its support for the MSFT shares in afterhours trade. The stock rallied as much as 5.3 percent in the first 15 minutes after the report. This charge will draw considerable attention from technical traders for Wednesday’s open as the progress brings us very close to the 200-day simple moving average of 256. There have been two very prominent tests and rejections of this overhead technical figure in the past five months. Will it be three or the motivation for a ‘blue chip’ ground swell. Below, MSFT is overlaid with the Dow Jones Industrial Average. Microsoft is the 7th largest weighting in the Dow while also representing the second largest market cap at approximately $1.80 trillion. Confidence will be difficult to inspire for the market however considering that concerns over a US recession and tech layoffs (including from Microsoft) have maintained a negative pallor to confidence.
Chart of MSFT Overlaid with the Dow Jones Industrial Average with 20-Day Correlation (Daily)
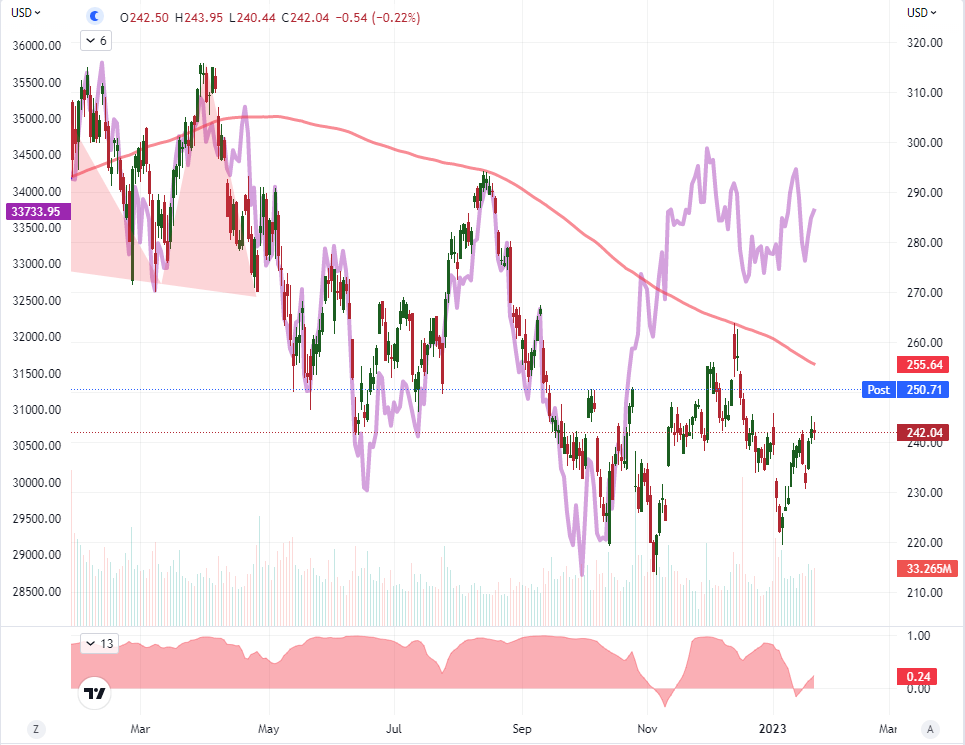
Chart Created on Tradingview Platform
Among the major US indices, the Dow remains in the best overall position relative to its record highs and the trough of its total losses through the third quarter of this past year. There seems to be a premium afforded to the ‘value’ stocks. That said, MSFT’s correlation is the most tightly drawn to the tech-heavy Nasdaq 100. Below, the 20-day correlation between stock and index is clear both visually and statistically. Is this the stock that finally gives the tech sector lift follow so much exaggerated bearish pressure and months of cost shedding from the corporations? For me, the bigger question is what happens if MSFT’s favorable response can’t offer genuine lift for the wider stock market?
Chart of MSFT Overlaid with the Nasdaq 100 with 20-Day Correlation (Daily)
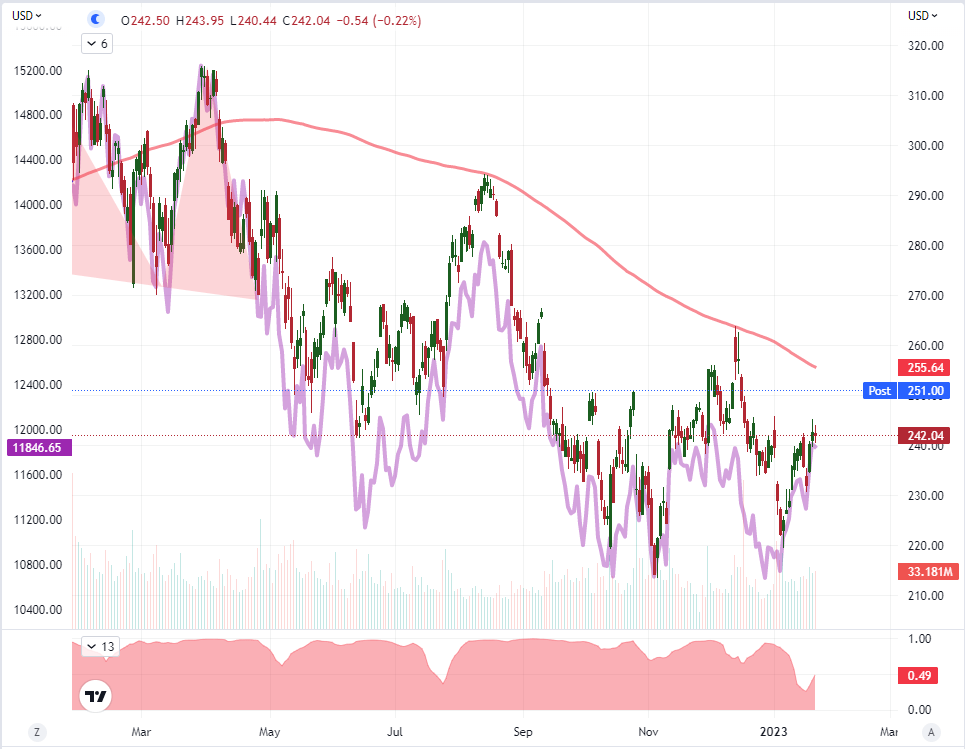
Chart Created on Tradingview Platform

Be the first to comment