

Sean Gallup/Getty Images News
Introduction and Background
What a difference a few days can make. Thursday’s incredible rally took many of the stocks on my watchlist from compelling valuations to above fair value. The market may go up, and the market may go down, and stocks within that market will become more and less favorably valued over time. That is why I like to maintain a watchlist of the highest quality dividend growth companies that I regularly track, so that regardless of what is happening in the market, I can have an idea of fair valuation and can take advantage of favorable valuations when they inevitably occur.
So, with the recent exuberance in the market, is it possible that there are still reasonably priced stocks out there? I decided to filter my watchlist by companies that have recently reported earnings and that are trading at less than 40% of their 52-week range (52-week low being 0% and 52-week high being 100%). This is obviously somewhat arbitrary, in that it is very possible that companies are trading near 52-week lows for good reason, and companies could be above my threshold, and still be reasonably valued, however, I’ve found historically, that this is one filter that has yielded good ideas for further exploration for me.
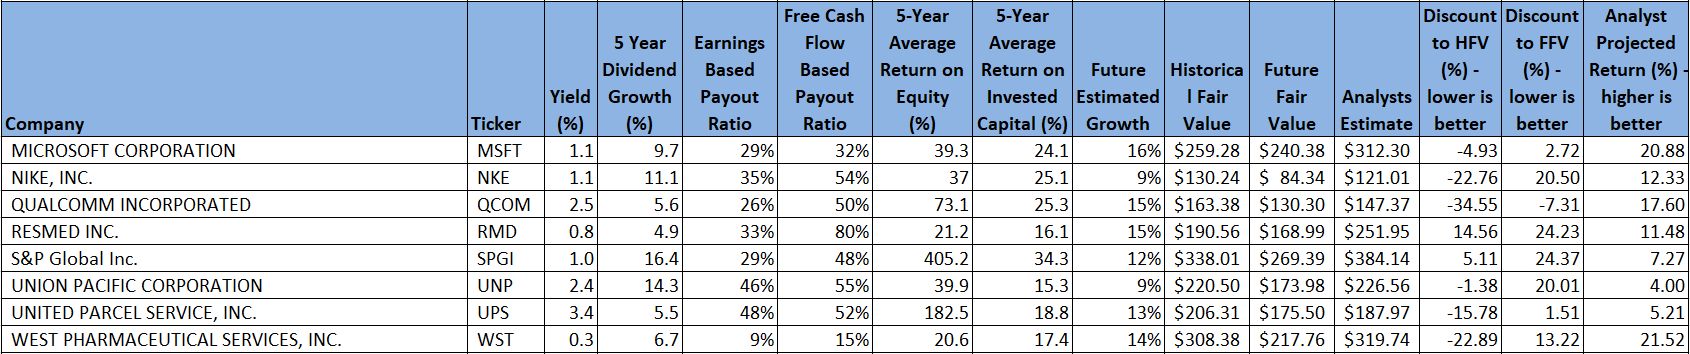
Using this first pass criteria, we will be looking at the following list of companies:
Finbox, Seeking Alpha, Author’s Analysis Finbox, Seeking Alpha, Author’s Analysis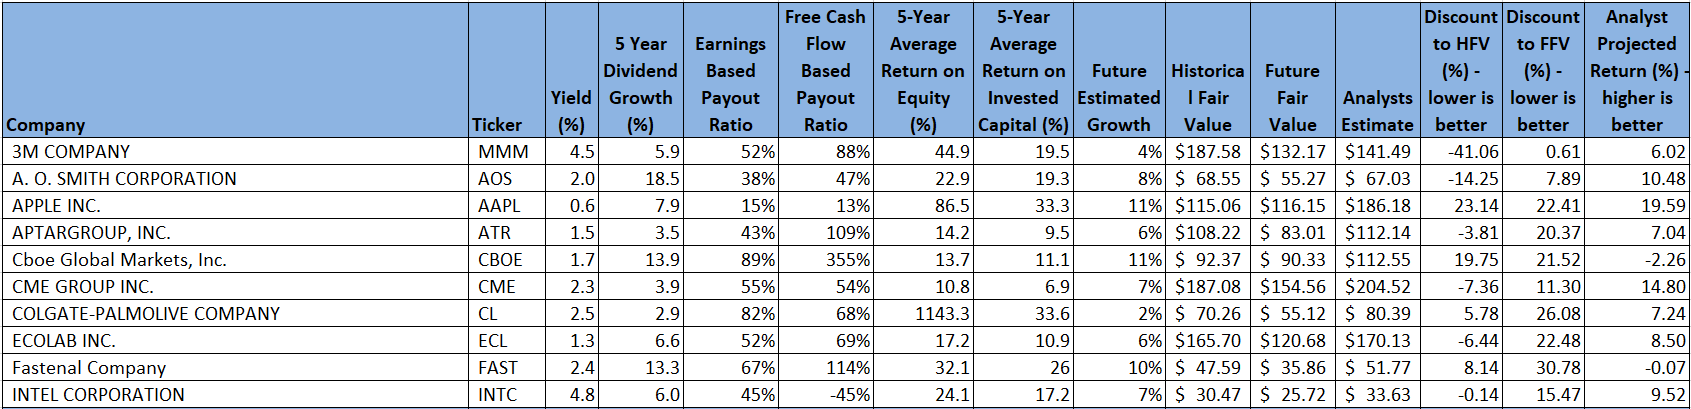
Fair Value Estimation
As I’ve described in previous articles, I like to calculate a fair value in two ways, using a Historical fair value estimation, and a Future fair value estimation. The Historical Fair Value is simply based on historical valuations. I compare 5-year average: dividend yield, P/E ratio, Shiller P/E ratio, P/Book, and P/FCF to the current values and calculate a composite value based on the historical averages. This gives an estimate of the value assuming the stock continues to perform as it has historically. I also want to understand how the stock is likely to perform in the future so utilize the Finbox fair value calculated from their modeling, a Cap10 valuation model, FCF Payback Time valuation model, and 10-year earnings rate of return valuation model to determine a composite Future Fair Value estimate.
I also gather a composite target price from multiple analysts including Reuters, Morningstar, Value Line, Finbox, Morgan Stanley, and Argus. I like to see how the current price compares to analyst estimates as another data point, and as somewhat of a sanity check to my own estimates.
Plotting three variables on one plot is tricky but using a bubble plot allows us to visualize three variables by plotting the Historical fair value versus the Future Fair Value on a standard x-y chart, and then use bubbles to represent the size of discount relative to analyst estimates.
Author calculation of Historical and Future Fair Value, analyst estimates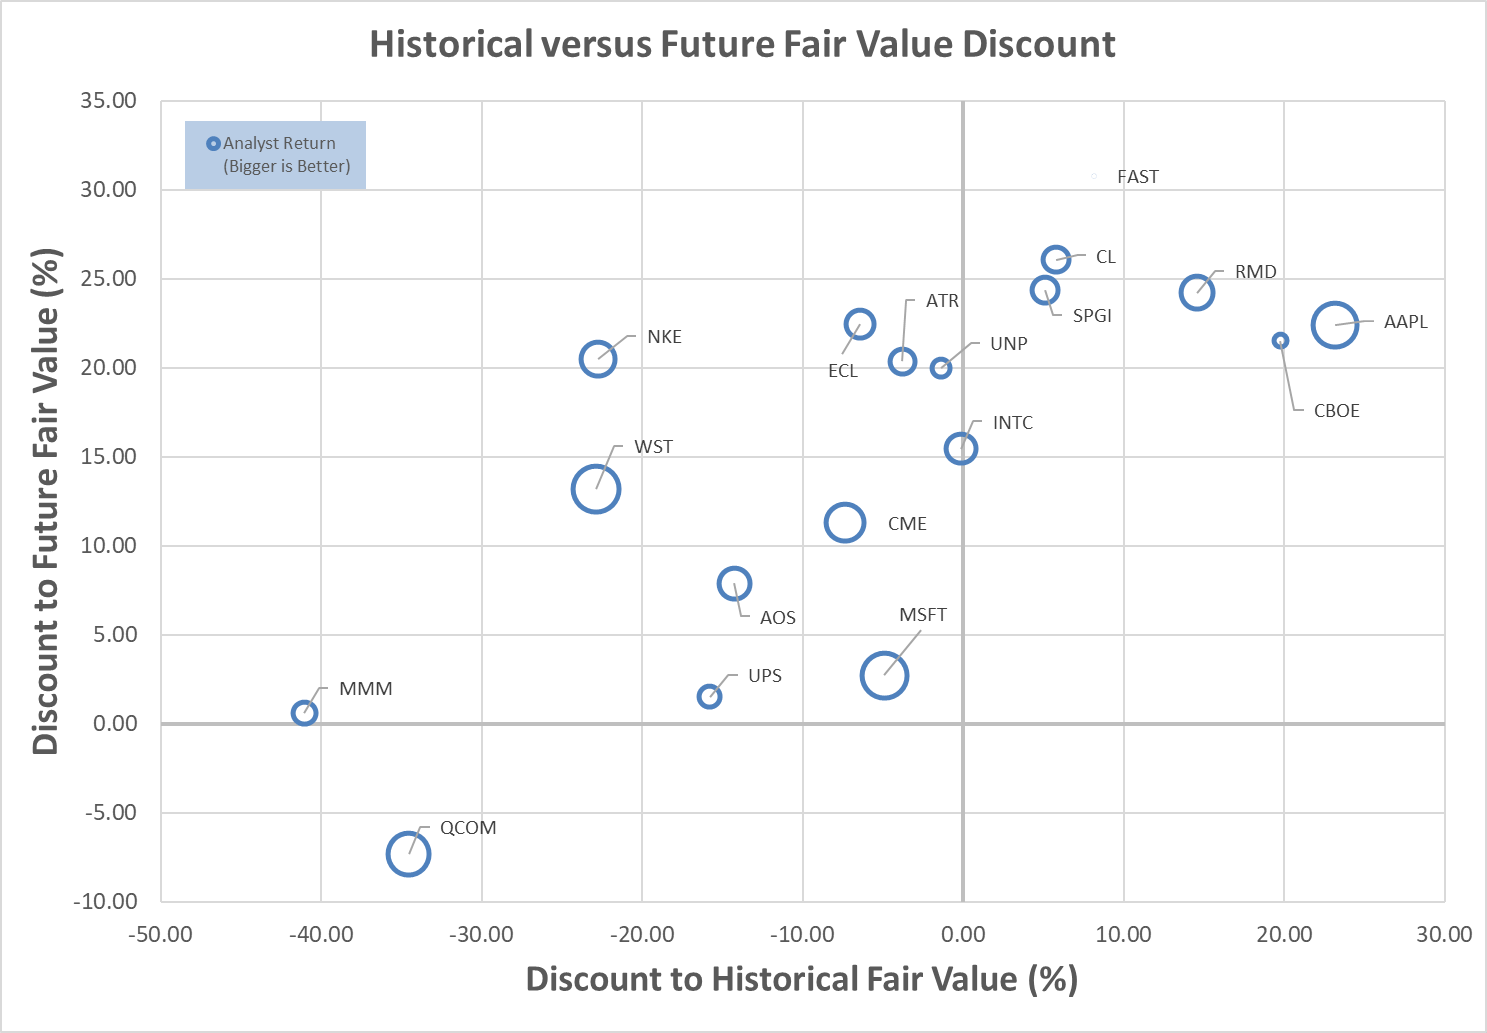
This chart is insightful once you understand how to interpret it. What we are looking for are stocks that are trading at a discount to both the Historical Fair Value and the Future Fair Value. So, those stocks that are farther to the left, and farther to the bottom, are potentially the stocks trading at the largest discount to fair value. This would be the bottom left quadrant of the graph. Additionally, those stocks with the biggest bubbles are the stocks that are trading at the largest discount to analyst estimates, so in theory, stocks in the lower left quadrant that also have large bubbles, should be very decent candidates for investment.
Digging into this chart suggests that Qualcomm (QCOM) is currently the only stock, trading near 52-week lows, that looks to be attractively valued based on Historical and Future valuations and has decent upside to analyst estimates. Additionally, 3M Company (MMM), United Parcel Service (UPS), and Microsoft (NASDAQ:MSFT) are attractively valued from a Historical perspective and are close to fair value based on the Future valuation.
I currently own all these stocks and believe that each could be an excellent candidate for further investigation, and potential investment, especially for long-term investors. 3M and UPS are already full positions in my portfolio (I don’t add to any positions that account for more than 3% of my total dividend income). I also recently added to my positions in Qualcomm at $119, and Microsoft at $219, and will continue to add more in the future.
Though Qualcomm may be the obvious choice for further analysis, given its potential greater undervaluation, I actually want to dig deeper into Microsoft for this article. My simple reasons are that I believe Microsoft is one of the highest quality companies for a dividend growth investor but want to ensure myself that the growth of the recent past is likely to continue, to justify the valuations I have calculated. It has also been a while since I have completed a deep dive on Microsoft for myself, even though I recently added to my position (I know, this is not how you’re supposed to do it, but I had an older limit order that triggered that I hadn’t been expecting).
Microsoft Preliminary Analysis
I like to start simple when analyzing companies. Microsoft has a 5-year average Return on Equity of 39% and Return on Invested Capital of 24%. The recent figures are even higher at 43% and 31% respectively. These excellent values, and do not suggest any kind of degradation at play. The RoE and RoIC are also relatively close together, suggesting management are not using excess leverage to goose RoE. Morningstar’s Wide Moat and Exemplary capital management ratings further add to the confidence that this is a quality company with excellent future prospects, additionally, Microsoft is currently 4-star rated at Morningstar, suggesting it could be undervalued. Now, looking at the dividend, Microsoft’s 29% Earnings-based payout ratio and 32% Free Cash Flow-based payout ratios suggest the dividend is very comfortably covered and sustainable. The 5-year dividend growth rate of close to 10% is also impressive. With my estimated growth rate for Microsoft being above the dividend growth rate, I feel this is a very safe, attractive investment option for the dividend growth investor.
Microsoft Strategy Update
A key part of long-term investing is ensuring that a company’s strategy is solid over the long term, and that the company is executing well against that strategy. Under Satya Nadella’s leadership, performance has been stellar. The shift from product focus to subscription focus has resulted in significant recurring revenue and reduced much of the cyclicality of the past. The market has rewarded the shift, and the results significantly, but this has led to times, in hindsight, of overvaluation. Now that the stock has corrected, and appears to be trading at attractive valuations again, can we identify some of the causes of the correction, and evaluate them against the strategy to see if there is anything of concern in the long term?
Looking at the most recent earnings report, there are some clues as to the worries.
Microsoft Q1FY23 Earnings Report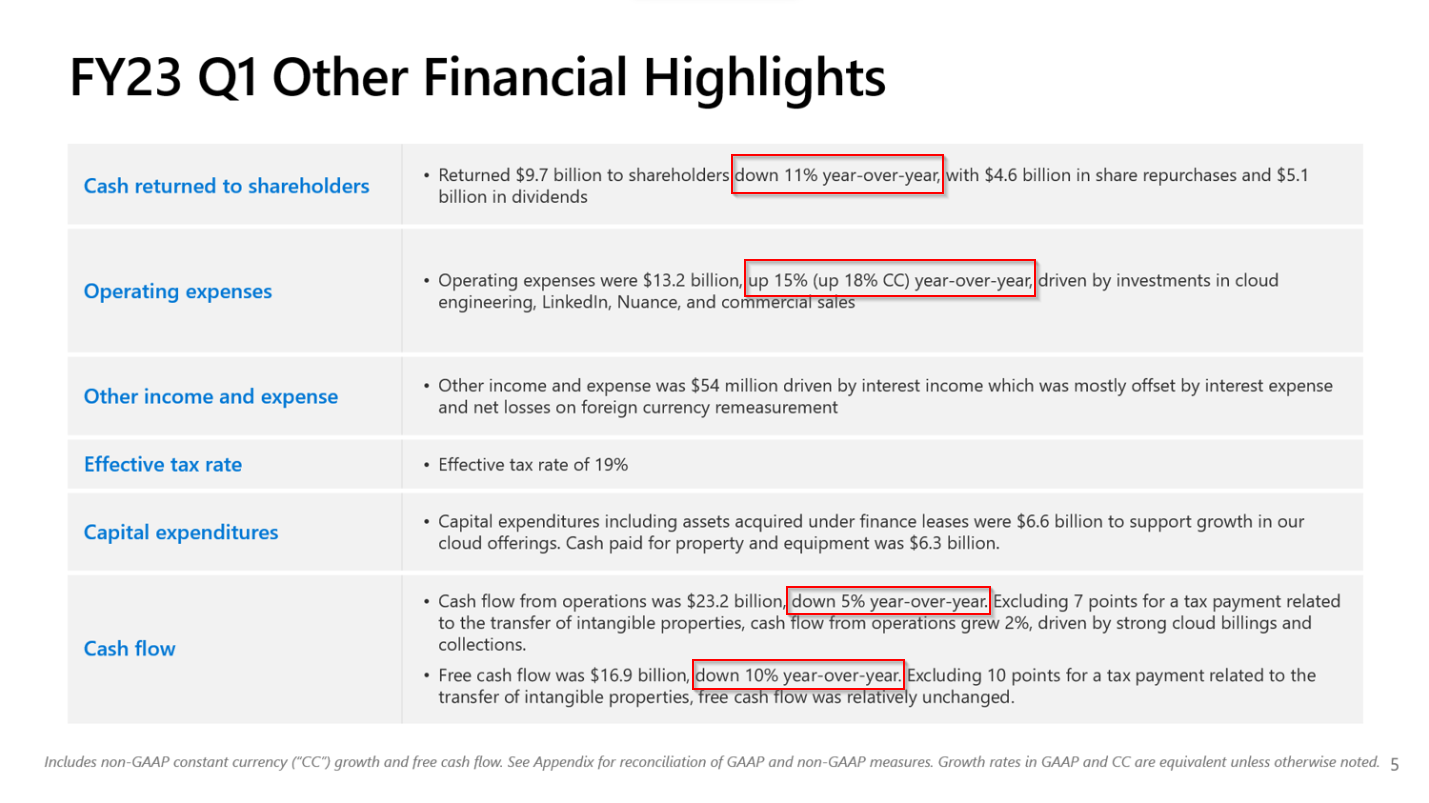
Year over year declines in cash returned to shareholders, cash flow from operations and free cash flow, with increases to operating expenses tend to be red flags for many shareholders, especially when the stock is trading at a premium. Let’s consider a few points related to these. First, shareholders don’t like to be given less, however, with expenses up, and cash flows down, this is a good sign of financial prudence. As we’ve seen previously, the dividend is safe, so Microsoft is moderating business fluctuations with cash returns. Additionally, even though cash flows were down, it appears that these were due to accounting, taxes, and currency. So, the underlying strategy does not seem to be the cause of the declines.
A few more data points to consider:
Microsoft Q1FY23 Earnings Report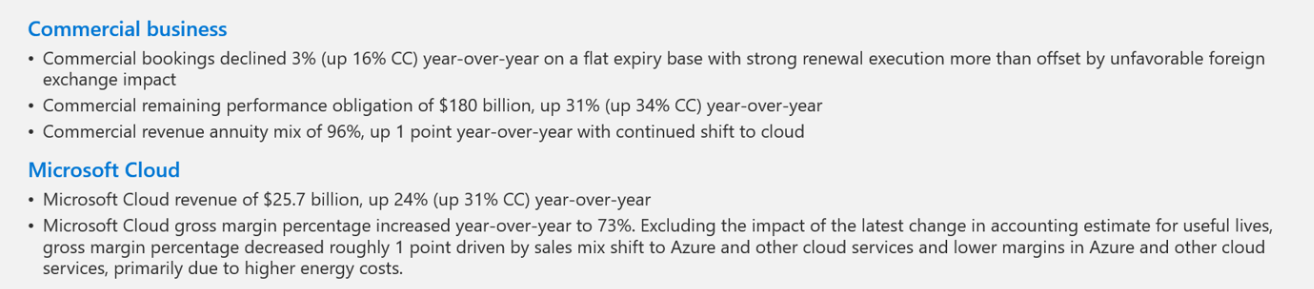
Continuing to answer the question about the health of the strategy, at face value a decline in commercial bookings seems like a bad thing but is actually up 16% on a constant currency basis. Cloud continues to perform very well, up 24%, which is amazing, and 31% on a constant currency basis. So, at a top level, the underlying strategy again appears to be solid, though the strong dollar is causing short term pain.
Microsoft Q1FY23 Earnings Report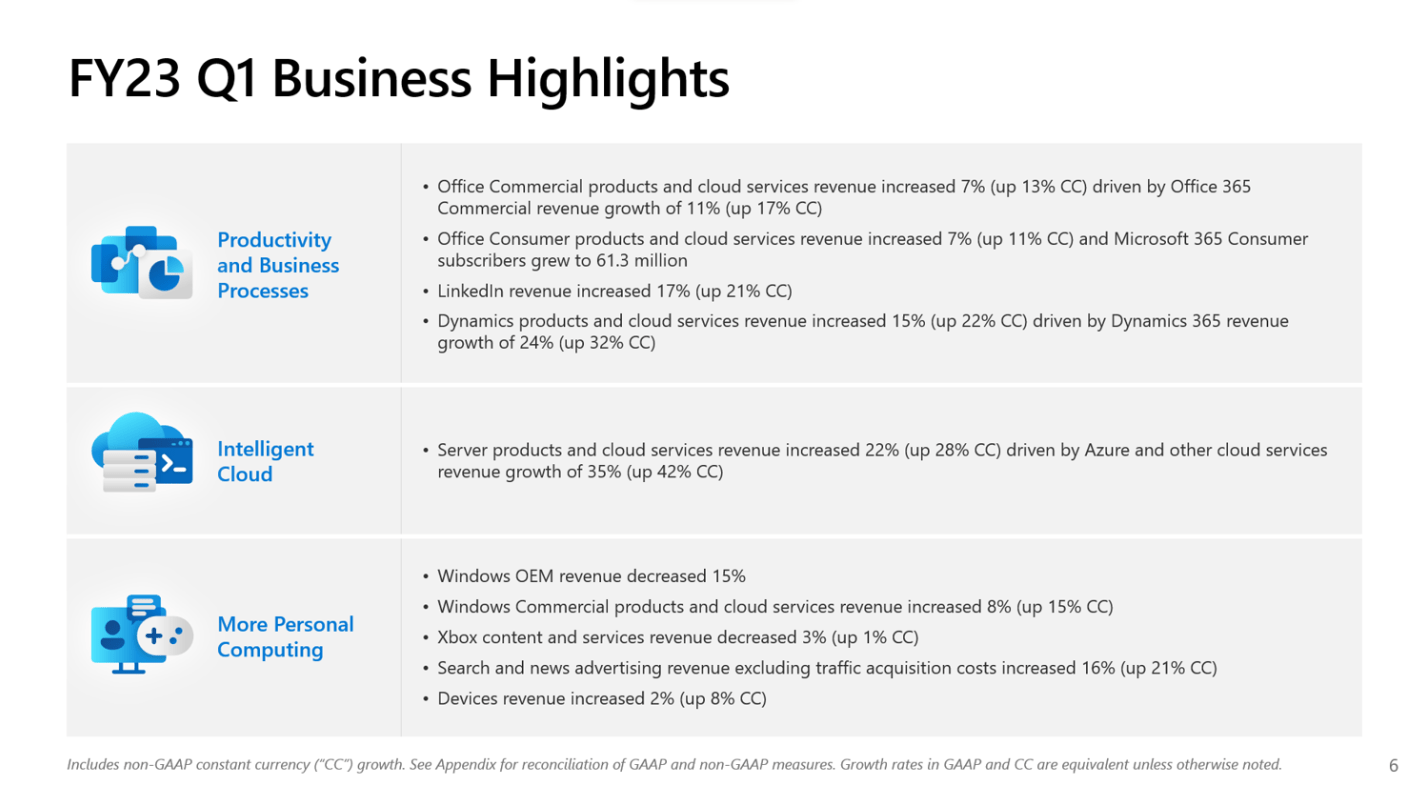
Digging deeper into the business segments, we see growth across the board in the Productivity and Business Process unit, with nice growth reported in each key area, and exceptional growth on a constant currency basis. Cloud continues to be a true gem, and one of the most compelling reasons for investment in Microsoft from my perspective, with amazing overall growth, especially in constant currency terms. The one minor chink in the armor, and likely the second reason for some of the angst of late with Microsoft is in the More Personal Computing space. Windows revenues are down, in line with decreases in personal computer sales (not necessarily a strategy flaw, since market share doesn’t appear to be impacted, just overall market), and gaming also appears to be continuing to decline from COVID, stay-at-home highs.
So, is the strategy in decline, or are there other issues at play? In my opinion, which seems to be aligned with the general feeling from other analysts, the strategy continues to be solid. Microsoft’s moat is intact, and execution continues to be excellent. It is likely that Microsoft’s valuation got ahead of itself, especially exacerbated by recent COVID, supply chain, and market irregularities. The recent angst is mostly due to currency fluctuations, which aren’t indicative of strategy, and market fluctuations, which again, aren’t necessarily indicative of strategy. So, if the strategy is still solid, execution continues apace, the valuation looks to be more favorable, and the issues that have been identified are likely immaterial to the long-term investment thesis, I believe Microsoft continues to be a very attractive, high-quality, long-term investment candidate.
Microsoft Historical Valuation Analysis
Though we’ve all heard that past performance is no guarantee of future results, I think we also all realize that past performance can be somewhat indicative of the quality of the company. So, let’s start with how Microsoft has performed for shareholders in the past:
Seeking Alpha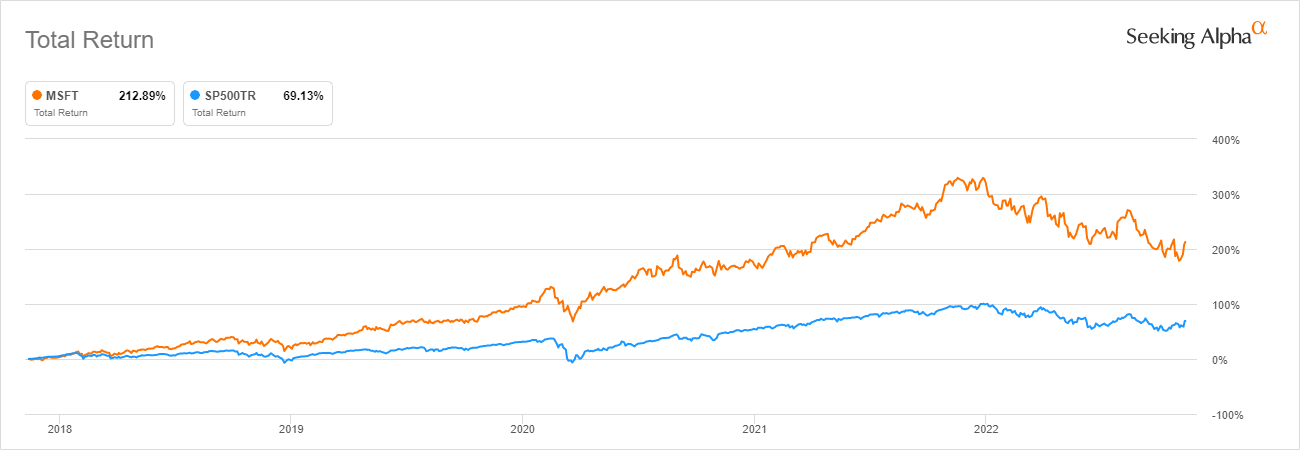
Microsoft has fairly consistently outperformed the S&P 500. It is interesting to see that it does appear to follow many of the ups and downs of the market, but at the same time, has generally outperformed.
Outperformance in the past is one thing, but as we’ve hinted at already, maybe that outperformance was just due to valuation multiples. That’s why valuation is important. To know if we should consider investment, we want to be sure we are buying fundamentals, not just exuberance. Two of my favorite initial indicators of valuation are P/E and yield.
Finbox Finbox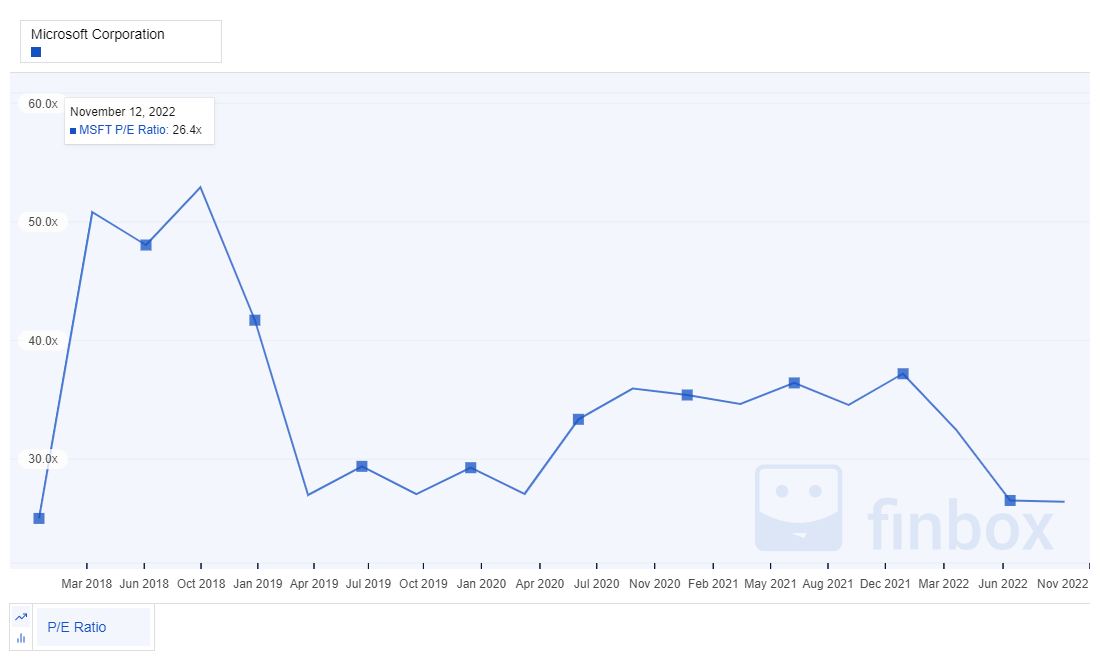
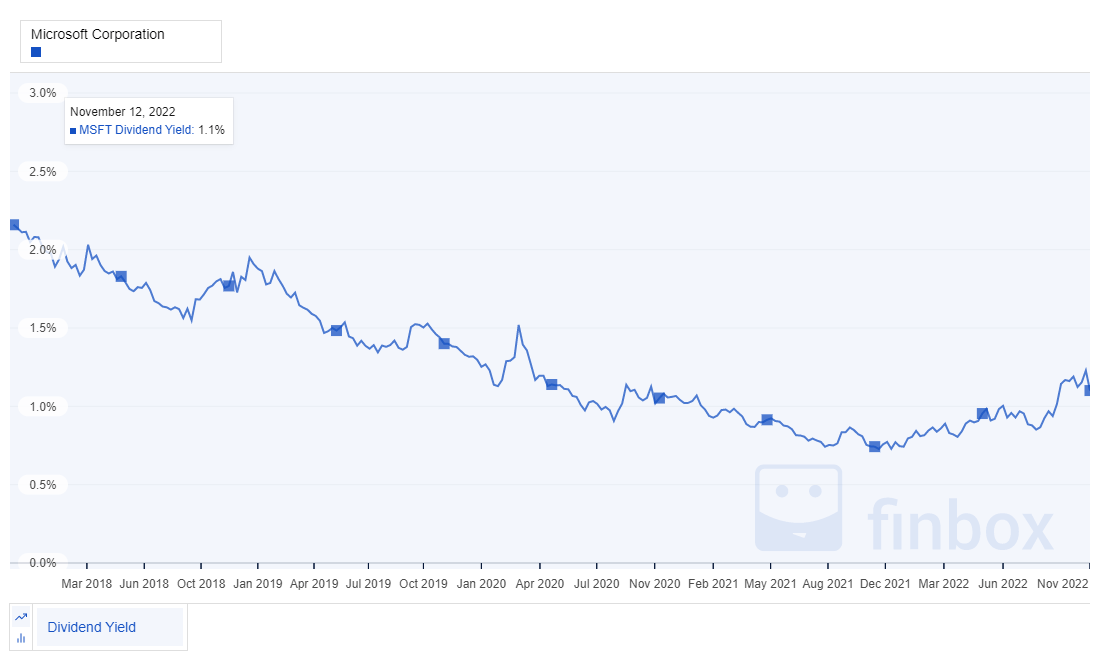
Microsoft’s P/E ratio isn’t exactly low currently at 26.4, however, compared to the 5-year average of 34.5, this could indicate that it is currently more fairly valued. Ignoring the higher P/Es from the 2018-2019 period, it also looks favorable, and on the lower end of the past five years. Yield is also a nice indicator for dividend paying stocks. The current yield is still below the 5-year average of 1.3% but is trending higher. Some of this is due to the new-found growth under Nadella’s leadership but could also be indicative of overvaluation. At a minimum, yield doesn’t suggest that the stock is vastly undervalued, but likely closer to fair value.
A key part of the Total Shareholder Return includes stock buybacks, which are also important to dividend growth sustainability. Microsoft shows a nice downward trajectory in shares outstanding. They are more than offsetting dilution from equity-based compensation, and returning more money to shareholders through buybacks, in addition to the dividend.
Finbox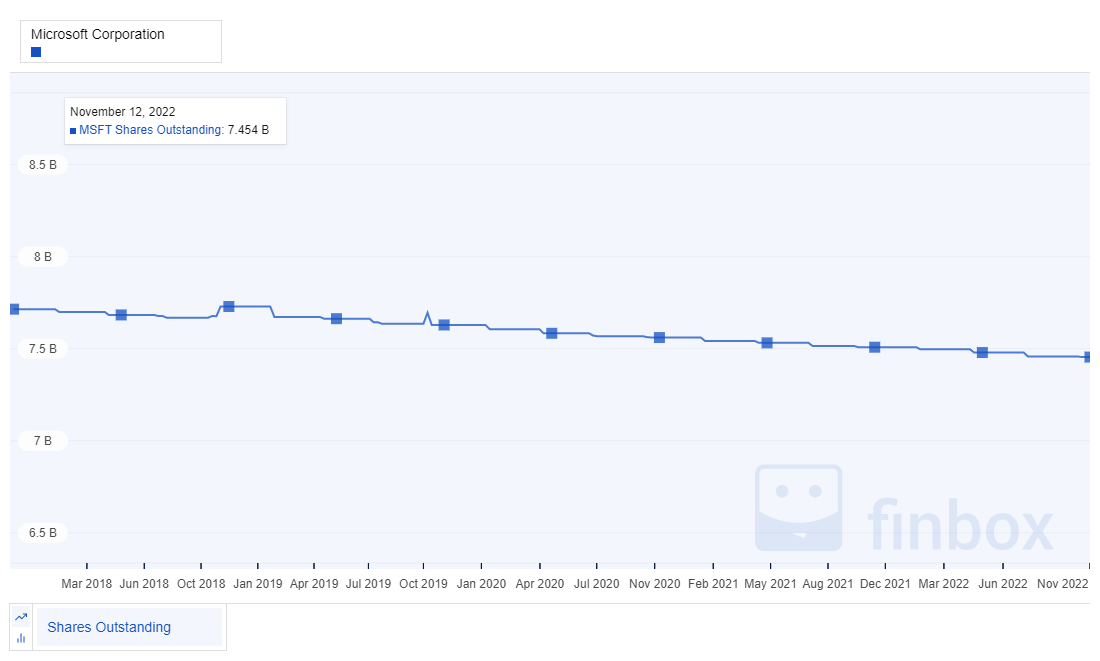
We pointed out earlier from the RoE and RoIC that Microsoft does not appear to be using leverage to inflate RoE. Looking at their revenue versus net debt, tells a great story. Microsoft is debt free and has a strong net cash position. As one of the only AAA credit rated companies, this isn’t a big surprise. This is not very common in today’s day and age, and something I like seeing as a long-term investor counting on that compounding dividend growth far into the future.
Finbox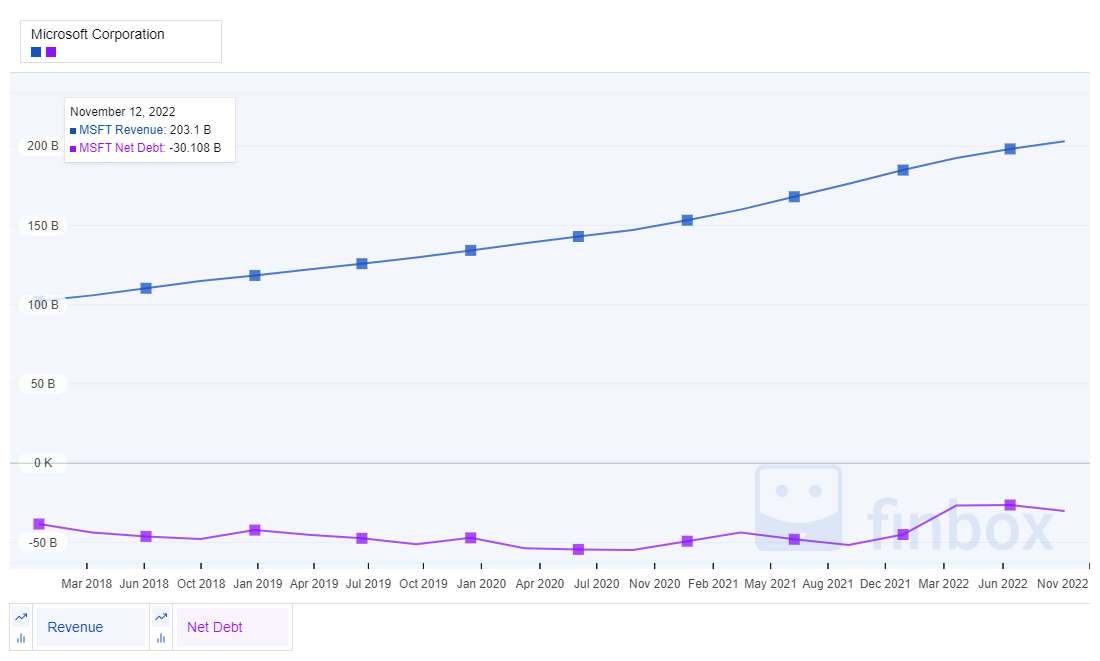
Microsoft has been paying a growing dividend for almost 21 years. Their growth has been solid and sustainable. The 9.7% recent dividend growth is well in line with the average 5-year dividend growth. Since the yield is not that high currently, as a dividend growth investor it is encouraging to see the consistent, strong, sustainable growth in the dividend.
Finbox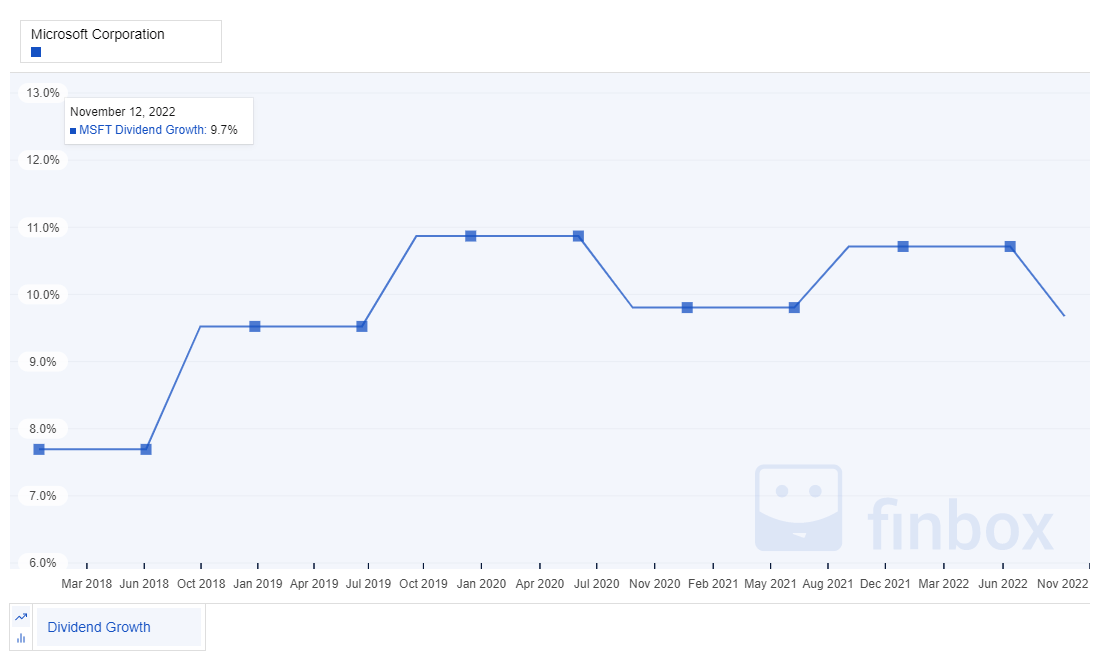
Obviously, dividend growth doesn’t do any good if the growth is not sustainable. In this case, Microsoft’s earnings and free cash flow-based payout ratios, if anything, have been decreasing. This is another indication that the long-term dividend payout and growth should be sustainable. With payout ratios of 29% based on earnings, and 32% based on free cash flow, there is a lot of margin to protect the dividend. Add on top of that the generous share buy-backs, and the dividend, and dividend growth appear very safe to me.
Finbox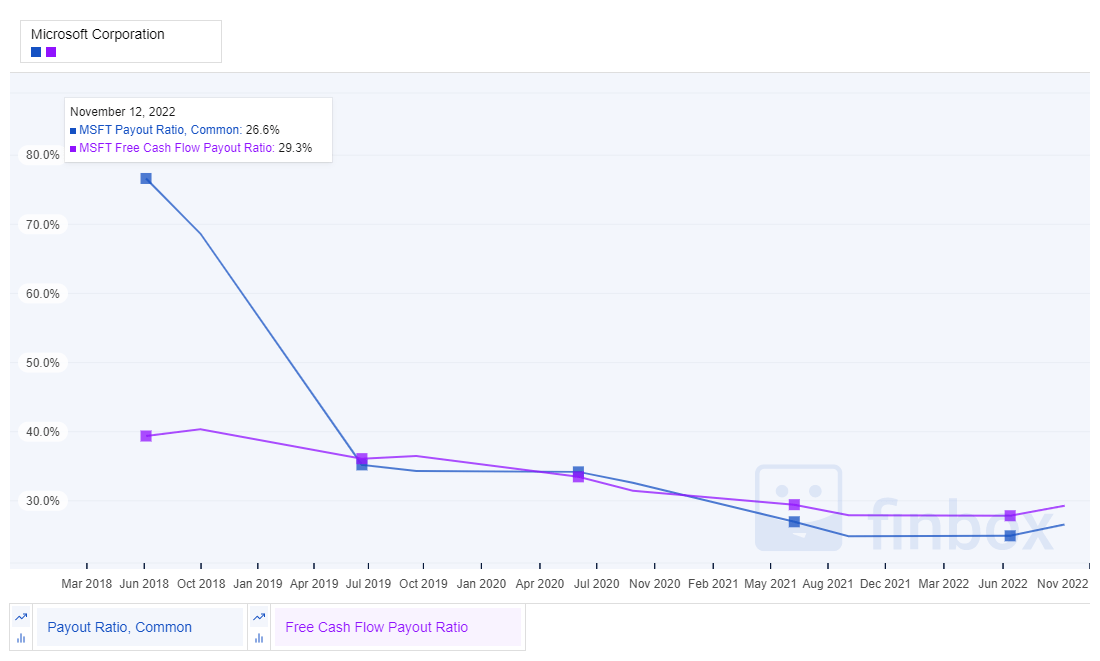
Microsoft Future Valuation Analysis
Because we want our dividends to grow in the future, not just the past, we need confidence that the results the company has already achieved will likely continue. This is one of the questions we set out to answer at the beginning of the article.
Largely due to currency, as well as a downturn in PC orders, earnings growth next year is projected to be down. After next year, earnings are projected to rebound significantly. Even projecting out several years, the growth is projected to continued, though potentially at a subdued rate.
Finbox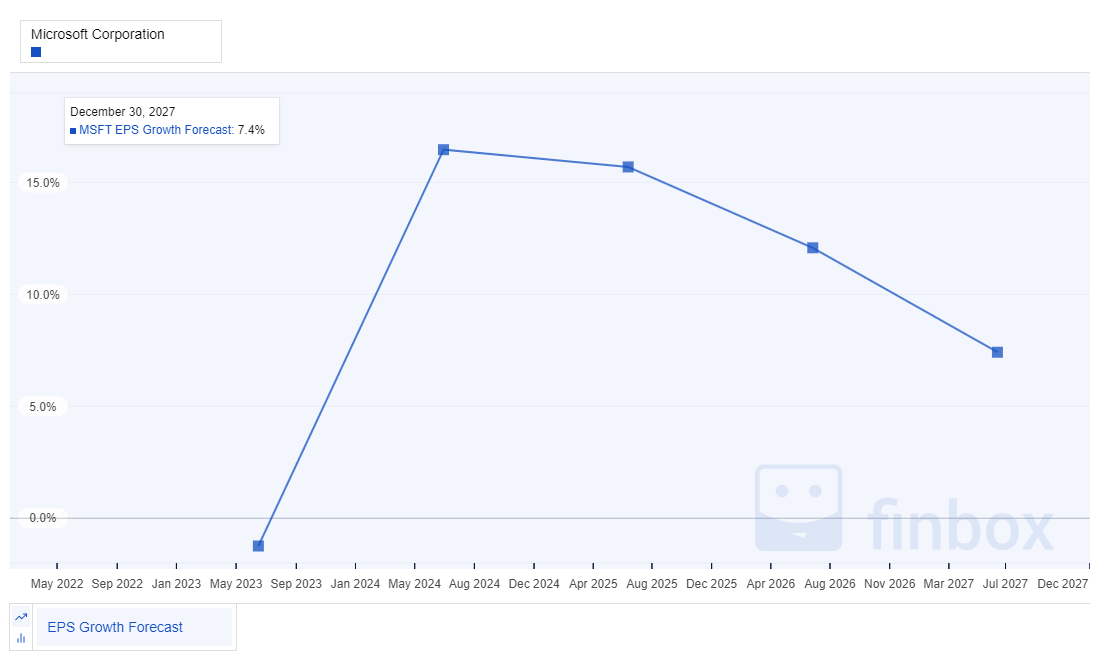
Growth is one of the hardest things to predict in investing, otherwise, investing would be much simpler. Future growth projects a downturn of sorts. In the case of growth, I do like to look at historical growth estimates. In the case of Microsoft, generally growth projections have been well above 10%.
Finbox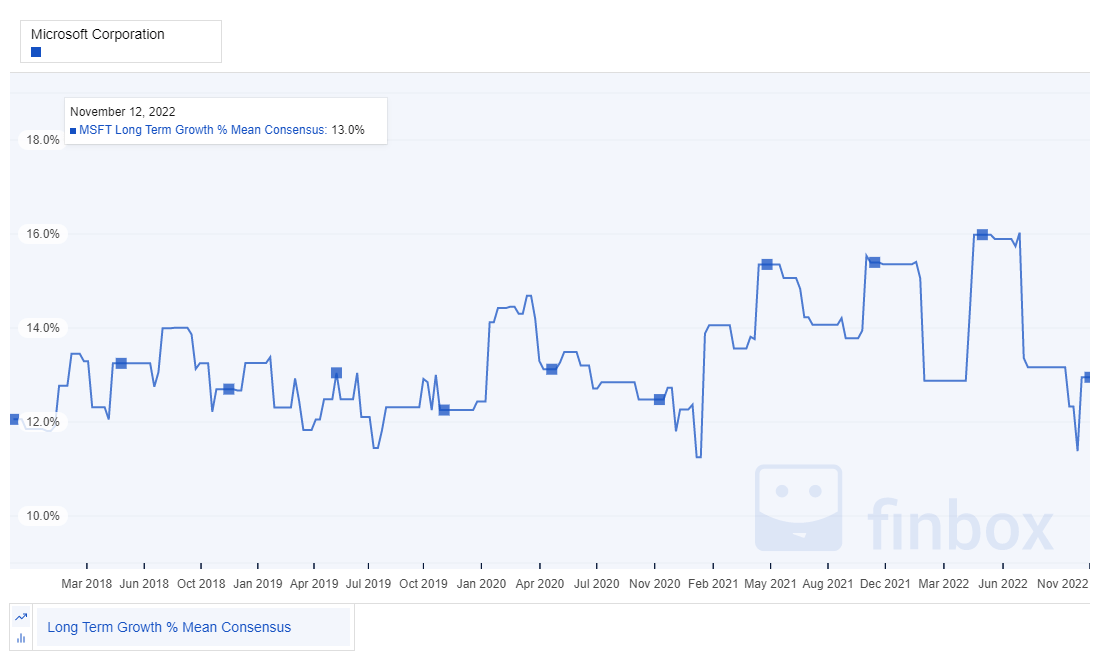
My own estimate for Microsoft’s forward growth is around 16%. I derive this from a combination of various growth projections and growth models. This feels likely optimistic to me, however, past earnings per share growth has achieved these levels.
Finbox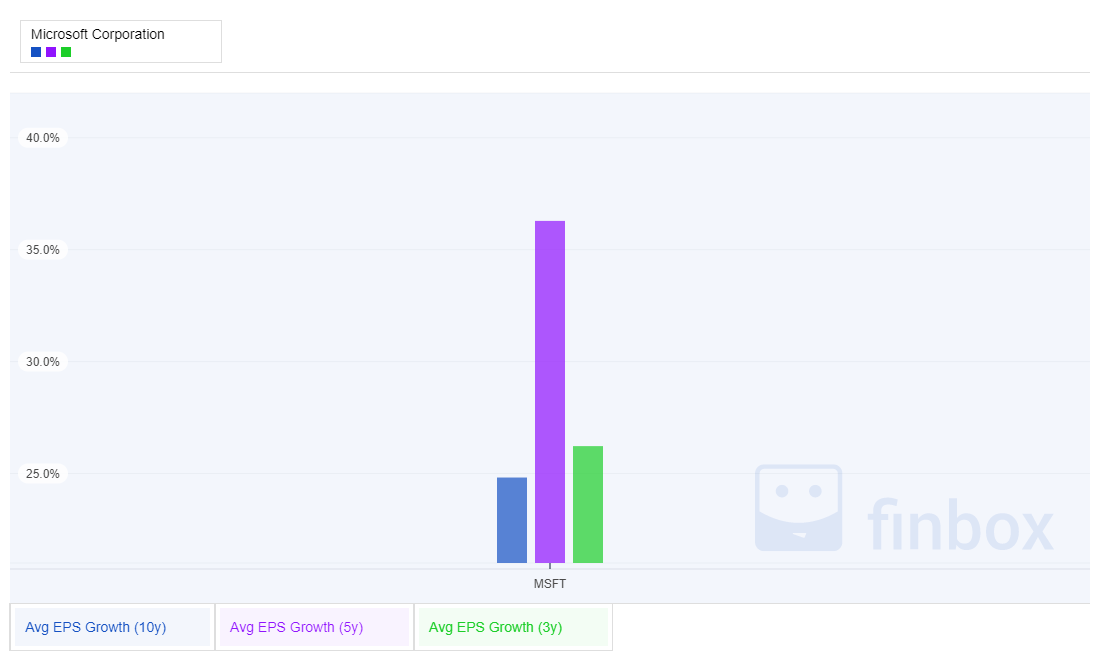
For a dividend growth investor, understanding future dividend growth potential is also important, especially in as much as it is sustainable. Here are the long-term dividend growth projections for Microsoft. The forecast growth looks very consistent. At least for the next few years, it seems likely that Microsoft will continue solid dividend growth.
Finbox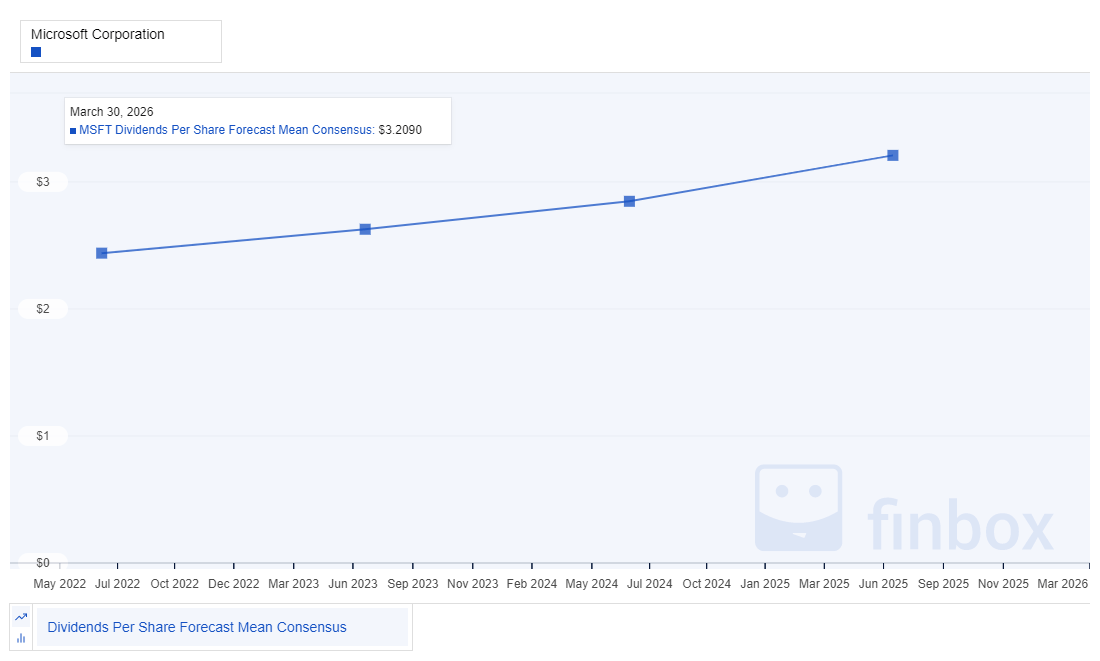
Based on this forecast, and what we’ve seen already as far as earnings growth and projected dividends, it shouldn’t come as a surprise that the earnings payout ratio is also forecast to be well controlled for the near future. If anything, the payout ratios may decline in the future, leaving room for incremental investment back into the business, increased dividend payouts beyond the forecasts, or incremental share buy-backs. All of these are positive for the investor looking for sustained dividend growth.
Finbox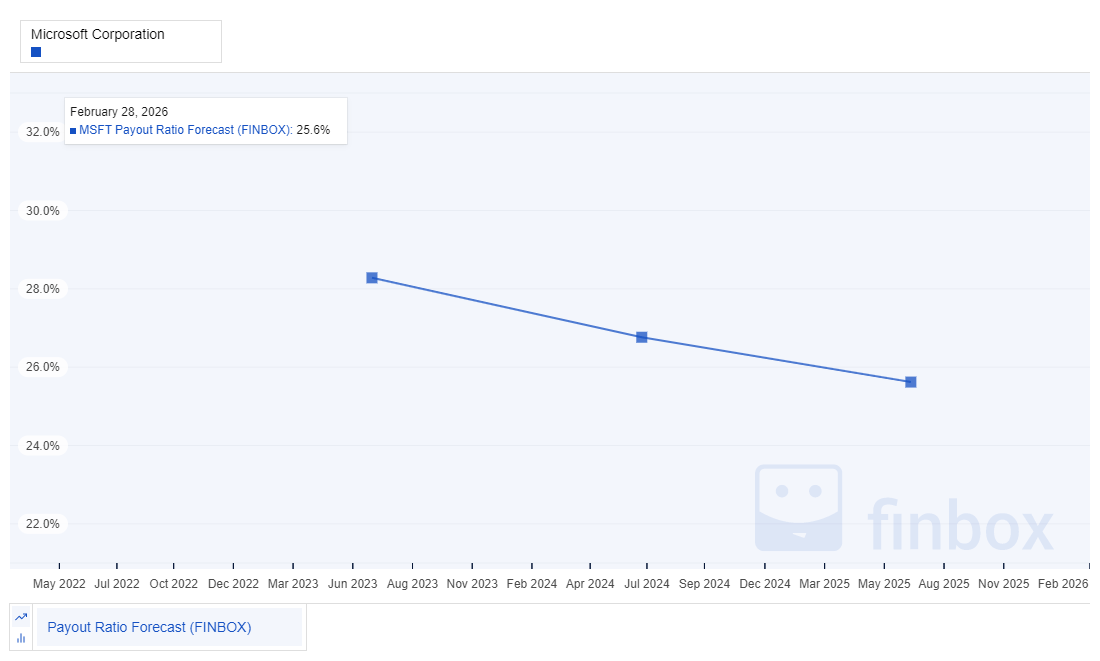
As already covered, the growth in expected revenue for the next several years, should allow for continued strong dividend growth as well, without impacting the financial health of the company. The projected growth is nothing, if not exciting, for an investor in this great company.
Finbox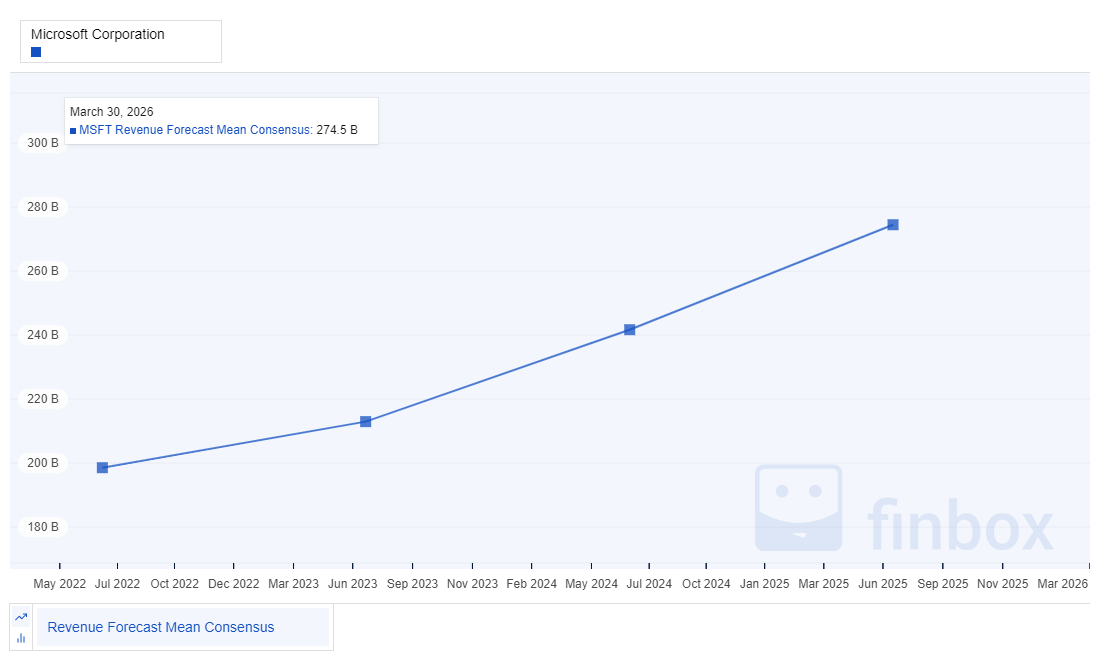
Microsoft Risk
Let’s be honest, Microsoft provides a lot of margin to risk. It is a safe investment. The perfect credit ratings, A++ Value Line Financial Strength rating, and Wide Moat and Exemplary capital allocation ratings from Morningstar, all attest to the quality of this company.
That aside, there are a few risks to discuss. Subscription growth, which has been such a significant driver for recent performance, will continue to saturate and subside at some point, as with most subscription-based business models. There is also a lot of competition in the cloud. Ensuring that the cloud is not just a commodity service, but something that drives unique value to customers through integration, analytics, and proprietary technologies, will be key to sustaining margins, growth, and fending off competition. Also, Microsoft still has many monopolistic appearances, and there is always risk that business practices will draw the attention of regulators, such as has been reported recently in Europe. Microsoft has a long history of fending off these inquisitions, however, the risk should be acknowledged. There are not too many direct competitors to Microsoft, however, this, if anything, could attract disruption.
Shorter-term, valuation is always a risk as well. If the stock is over-valued when you purchase it, it could lead to poor investment results over a long period of time. This has happened in the past with Microsoft. This is why I always pay attention to valuation, even when purchasing the highest quality stocks. One more indirect indication of this valuation risk, and short-term investment risk I like to look at is the short interest.
Seeking Alpha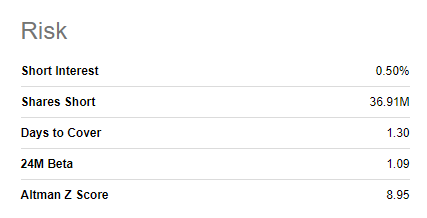
Based on the very low short interest currently in Microsoft, this would not make me hesitate to initiate or add to my position in this quality company.
Summary
So, where do I stand after that deeper dive into Microsoft? Microsoft hasn’t gone on sale that often in the past several years. I have desperately wanted to invest in it but have held back due to valuation. At this point, my valuation models suggest that it looks fairly valued, and as such, I did recently add to my position at $219 per share. I personally think that at the current trading price, it is likely still a fair entry point, especially for the long term, but if I were looking to add more, I would want to add some margin of safety, and would likely look for a price lower than $230. Additionally, I do not see anything fundamentally wrong to make me concerned with future results. There are some short-term currency headwinds, and some cyclicality in the PC and gaming areas, however, I don’t view these as fundamental strategic flaws. I also believe the other risks discussed are manageable. This is a high-quality company that continues to execute well, and is one of my favorite, high-quality dividend growth investments.
The initial analysis in this article also highlighted that 3M Company, Qualcomm, and United Parcel Service also appear to be attractively valued. These would be excellent candidates for further analysis and potential investment.
Be the first to comment