

anyaberkut
Microsoft (NASDAQ:MSFT) and Amazon (NASDAQ:AMZN) are two of earth’s most important and beloved companies.
- they make up 8% of the S&P
- they make up 18% of the Nasdaq
- they are the two largest and most dominant cloud computing giants on earth
- they are two of the greatest performing stocks in history
I’m a big fan of both companies, which I consider world-beater tech titans that deserve to be in almost any diversified dividend portfolio.
- 4 Reasons Dividend Investors Should Buy Amazon And Alphabet Today
- Buy Microsoft Today And Your Retirement Will Thank You
But with earnings now behind us and new information available, I wanted to provide an update on these amazing growth legends, including four critical facts investors need to know.
Fact One: Both Companies Delivered Great Earnings
Microsoft’s earnings might not have impressed the market that much, but they were excellent where it matters most.
Cloud revenue was up 33% YOY in constant currency, with bookings up 35% and growth margins of 69% and 69% of sales from recurring revenue.
- LinkedIn revenue up 29% YOY
- Azure up 40% YOY
- other cloud revenue up 46% YOY
- Office 365 customers up 14%
- Office 365 revenue up 12%
In 2024, Azure is still expected to grow by 35%.
Why is the cloud so important to Microsoft? Because it’s the lynchpin to Microsoft’s wide moat ecosystem. Cloud computing isn’t just about data storage but data analytics.
In other words, the more companies use Azure and Microsoft cloud, the more data Microsoft has to improve its machine-learning AI algorithms and make its cloud computing offering even more useful.
This is why Alphabet (GOOG) is so dominant in search. The more people search on Google, the better it becomes, and the more people use it.
It’s a virtuous cycle that all the great world-beater tech giants have used to become the most profitable companies in history.
IoT Analytics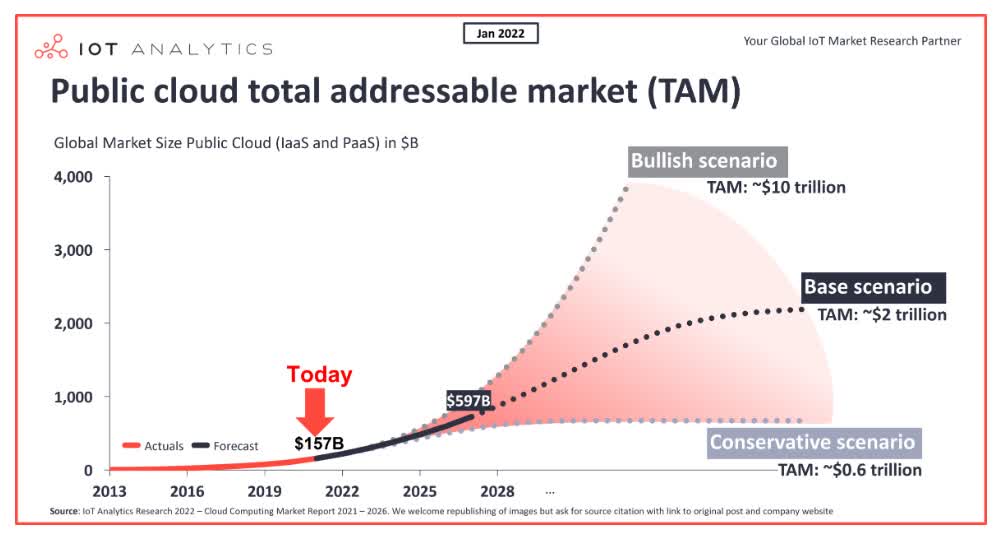
By 2035 IOT analytics thinks the cloud computing market will grow into a $600 billion to $10 trillion global industry. And Microsoft and Amazon are the kings of cloud computing with a 55% global market share.
Statista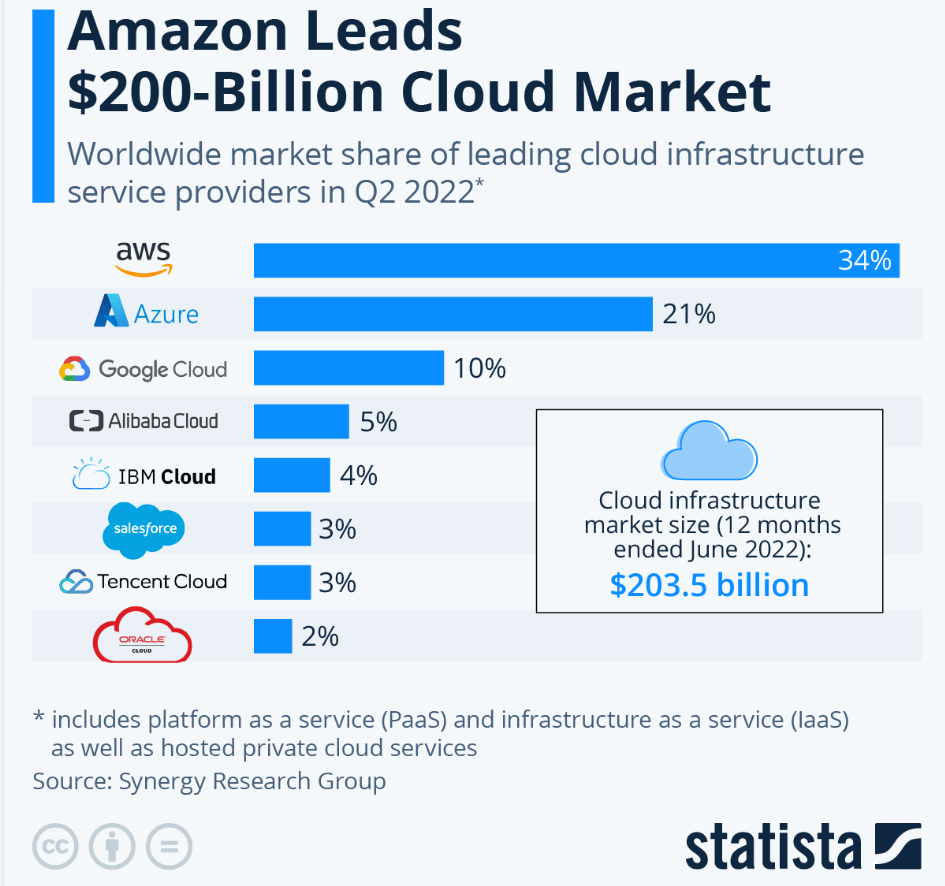
This is now mostly a three-way race between AMZN, MSFT, and GOOG, who together command 2/3 of the global cloud market share.
What about Amazon? There the results were more mixed but still very good.
Amazon reported good second-quarter top-line and bottom-line results ahead of FactSet consensus expectations and provided an encouraging revenue outlook for the third quarter. While AWS remains a tremendous opportunity and performed well again, the more important takeaway this quarter is that retail-related businesses, especially third-party seller services, are coming back and even delivered some upside compared with our expectations. We are not ready to declare victory for the company just yet. Still, we are encouraged by the results and note that the pandemic-fueled growth surge is now removed from prior-year comparisons, so growth should optically improve.” – Morningstar
Amazon is in its 2nd worst bear market in history, getting almost cut in half during this inflation/interest rate-induced techpocalypse.
YCharts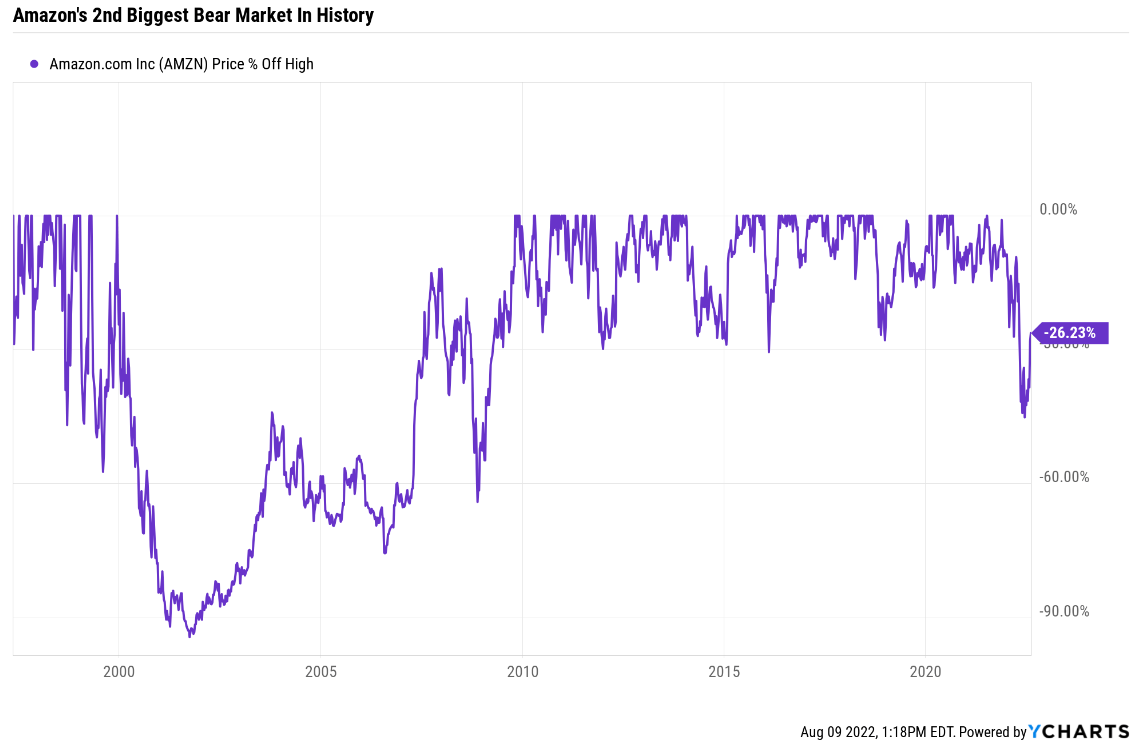
Whether or not Amazon sets new lows later this year or in 2023 will largely come down to how bad of a recession is already priced into the stock.
This brings us to the second critical fact all current and potential MSFT and AMZN investors need to know.
Fact Two: Both Are Growing Well But Amazon Is The Far Better Growth Stock
What does the long-term outlook look like for these tech titans now that every analyst covering them has had time to digest earnings and update their models?
FactSet Research Terminal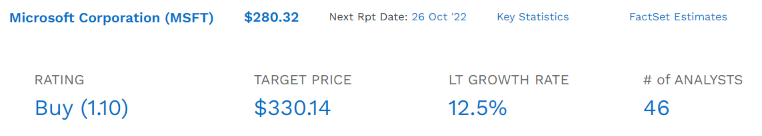
Microsoft’s median long-term growth forecast fell from 16% to 12.5% after earnings.
- perfectly normal growth outlook fluctuation, especially going into a likely a recession
What about Amazon, which has far more exposure to consumer retail?
FactSet Research Terminal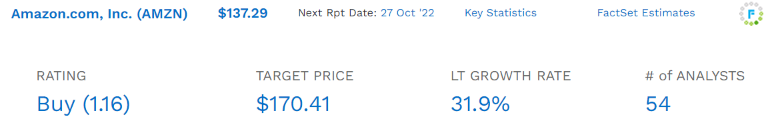
It might surprise you that after management reiterated its plans for strategic growth and updated its short and medium-term guidance, Amazon’s growth consensus jumped from 20% to 32%.
- 20% to 36% is the growth consensus range of the last few years
What about the medium-term growth outlook for both companies?
Microsoft Medium-Term Growth Consensus Forecast
| Year | Sales | Free Cash Flow | EBITDA | EBIT (Operating Income) | Net Income |
| 2022 | $198,270 | $65,149 | $97,843 | $83,383 | $69,447 |
| 2023 (this year) | $220,724 | $71,749 | $109,199 | $93,214 | $75,692 |
| 2024 | $251,686 | $86,096 | $126,510 | $107,763 | $88,724 |
| 2025 | $289,196 | $104,381 | $148,391 | $128,102 | $105,393 |
| 2026 | $322,254 | $100,311 | $168,539 | $136,958 | $113,846 |
| 2027 | $358,849 | $112,230 | $187,499 | $152,511 | $126,763 |
| Annualized Growth | 12.60% | 11.49% | 13.89% | 12.84% | 12.79% |
| Cumulative Next 3 Years | $1,442,709 | $474,767 | $740,138 | $618,548 | $510,418 |
(Source: FactSet Research Terminal)
Microsoft isn’t expected to deliver Pandemic-era hyper-growth, but it’s still expected to grow at a healthy double-digit rate in its top and bottom line.
It’s expected to convert 93% of earnings into free cash flow totaling $475 billion in FCF over the next five years.
- MSFT’s free cash flow this year is expected to be larger than the GDP of all but 69 countries on earth
Microsoft Profit Margin Consensus Forecast
| Year | FCF Margin | EBITDA Margin | EBIT (Operating) Margin | Net Margin | Return On Capital Expansion |
Return On Capital Forecast |
| 2022 | 32.9% | 49.3% | 42.1% | 35.0% | 1.01 | |
| 2023 | 32.5% | 49.5% | 42.2% | 34.3% | TTM ROC | 108.18% |
| 2024 | 34.2% | 50.3% | 42.8% | 35.3% | Latest ROC | 98.30% |
| 2025 | 36.1% | 51.3% | 44.3% | 36.4% | 2027 ROC | 109.32% |
| 2026 | 31.1% | 52.3% | 42.5% | 35.3% | 2027 ROC | 99.34% |
| 2027 | 31.3% | 52.3% | 42.5% | 35.3% | Average | 104.33% |
| 2028 | NA | NA | NA | NA | Industry Median | 13.13% |
| 2029 | NA | NA | NA | NA | MSFT/Industry Median | 7.95 |
| Annualized Growth | -0.98% | 1.15% | 0.21% | 0.17% | Vs. S&P | 7.15 |
(Source: FactSet Research Terminal)
MSFT’s margins are expected to remain stable over time, among the most profitable companies on earth.
- free cash flow margins in the top 10% of all global companies
- 35% net margins
- 104% returns on capital = 7X more than the S&P 500 and 8X its industry peers
Amazon Medium-Term Growth Consensus Forecast
| Year | Sales | Free Cash Flow | EBITDA | EBIT (Operating Income) | Net Income |
| 2021 | $469,822 | -$9,069 | $71,994 | $24,879 | $33,364 |
| 2022 | $522,413 | -$2,055 | $72,993 | $15,971 | $2,635 |
| 2023 | $603,326 | $28,891 | $90,474 | $31,559 | $25,810 |
| 2024 | $692,112 | $60,709 | $114,684 | $52,750 | $40,742 |
| 2025 | $776,921 | $81,769 | $143,649 | $73,124 | $56,827 |
| 2026 | $889,751 | $131,325 | $188,067 | $102,413 | $82,455 |
| 2027 | $1,011,010 | $169,607 | $238,396 | $141,889 | $115,019 |
| Annualized Growth | 13.62% | 55.66% | 22.09% | 33.67% | 22.91% |
| Cumulative Next 2022-2027 | $4,495,533 | $470,246 | $848,263 | $417,706 | $323,488 |
(Source: FactSet Research Terminal)
Due to heavy growth spending, Amazon is expected to generate negative free cash flow this year on top of -$9 billion last year. However, between 2022 and 2027, it’s expected to generate $470 billion in free cash flow, 145% of its net income.
- $1 trillion in sales by 2027 would be the first $1 trillion sales company in history
- $169 billion in free cash flow by 2027 = larger than the GDP of all but 53 countries on earth
Amazon’s free cash flow from 2023 through 2027 is expected to grow 56% annually, while its other bottom line estimates “just” grow from 22% to 34%.
Sales growth of 14% per year through 2027 is a growth rate that most companies would envy, and Amazon is on track to become the largest company by sales on earth by 2024.
How can Amazon be expected to grow quickly when it’s already so large? Two words, margin expansion.
Amazon Profit Margin Consensus Forecast
| Year | FCF Margin | EBITDA Margin | EBIT (Operating) Margin | Net Margin |
| 2021 | -1.9% | 15.3% | 5.3% | 7.1% |
| 2022 | -0.4% | 14.0% | 3.1% | 0.5% |
| 2023 | 4.8% | 15.0% | 5.2% | 4.3% |
| 2024 | 8.8% | 16.6% | 7.6% | 5.9% |
| 2025 | 10.5% | 18.5% | 9.4% | 7.3% |
| 2026 | 14.8% | 21.1% | 11.5% | 9.3% |
| 2027 | 16.8% | 23.6% | 14.0% | 11.4% |
| Annualized Growth | 36.81% | 7.45% | 17.64% | 8.17% |
(Source: FactSet Research Terminal)
Amazon’s consensus margin growth rates are faster than most companies in the S&P 500.
Amazon’s free cash flow margin from 2023 to 2027 is expected to grow at 37% annually, quadrupling in four years to 17%.
The secret to Amazon’s margin expansion potential is AWS and advertising.
- AWS EBITDA margin in 2021 was 50%
- AWS operating margin in 2022 was 30%
- AWS EBTIDA margin consensus in 2025 is 46%
- AWS operating margin consensus in 2025 is 30%
Despite fierce competition from MSFT, GOOG, and many other cloud rivals, AWS is expected to maintain its margins while growing at 23% CAGR through 2027.
(FactSet Research Terminal)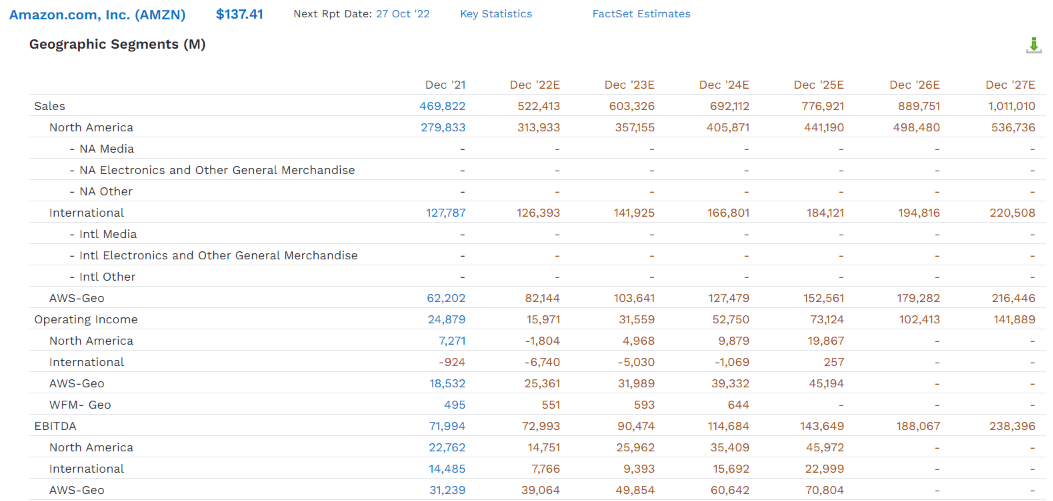
By 2027 AWS is expected to be a $216 billion sales giant, generating $142 billion in pre-tax profit to Amazon.
- AWS is very possibly worth more than AMZN’s entire market cap today
Even more impressive than these tech titans’ double-digit growth and sizes is how profitable they are expected to become despite truly epic growth spending.
Microsoft Growth Spending Consensus Forecast
| Year | SG&A (Selling, General, Administrative) | R&D | Capex | Total Growth Spending | Sales | Growth Spending/Sales |
| 2022 | $27,725 | $24,512 | $23,886 | $76,123 | $198,270 | 38.39% |
| 2023 | $31,573 | $26,898 | $27,097 | $85,568 | $220,724 | 38.77% |
| 2024 | $35,331 | $29,786 | $31,200 | $96,317 | $251,686 | 38.27% |
| 2025 | $38,719 | $33,626 | $35,214 | $107,559 | $289,196 | 37.19% |
| 2026 | $45,116 | $38,993 | $44,576 | $128,685 | $322,254 | 39.93% |
| 2027 | $50,238 | $43,421 | $49,521 | $143,180 | $358,849 | 39.90% |
| Annualized Growth | 12.62% | 12.12% | 15.70% | 13.47% | 12.60% | 0.77% |
| Total Spending 2023-2027 | $200,977 | $172,724 | $187,608 | $561,309 | $1,442,709 | NA |
(Source: FactSet Research Terminal)
MSFT’s growth spending last year was $76 billion, and in 2027 it’s expected to double to $143 billion.
- over the next five years, MSFT’s average growth spending is expected to surpass the US government’s infrastructure spending
But as impressive as Microsoft’s growth spending is expected to become, it pales in comparison to the growth spending juggernaut that is Amazon.
Amazon Growth Spending Consensus Forecast
| Year | SG&A (Selling, General, Administrative) | R&D | Capex | Total Growth Spending | Sales | Growth Spending/Sales |
| 2021 | $41,374 | $49,407 | $55,396 | $146,177 | $469,822 | 31.11% |
| 2022 | $49,381 | $65,531 | $62,109 | $177,021 | $522,413 | 33.89% |
| 2023 | $56,017 | $74,924 | $61,405 | $192,346 | $603,326 | 31.88% |
| 2024 | $62,035 | $82,891 | $62,642 | $207,568 | $692,112 | 29.99% |
| 2025 | $65,397 | $84,249 | $66,159 | $215,805 | $776,921 | 27.78% |
| 2026 | $72,791 | $94,139 | $61,000 | $227,930 | $889,751 | 25.62% |
| 2027 | $79,455 | $104,313 | $61,829 | $245,597 | $1,011,010 | 24.29% |
| Annualized Growth | 11.49% | 13.26% | 1.85% | 9.03% | 13.62% | -4.04% |
| Total Spending 2022-2027 | $385,076 | $506,047 | $375,144 | $1,266,267 | $4,495,533 | 173.44% |
(Source: FactSet Research Terminal)
In 2021 AMZN spent $146 billion on growth, including almost $50 billion on R&D.
For context, the $53 billion CHIPs bill was just signed into law.
In 2022 Amazon will spend more on R&D than the government will over a decade in this bill.
In 2021 Congress passed a $1.2 trillion infrastructure bill.
Over the next five years, Amazon is expected to spend more on growth than the US government will on infrastructure in the next decade.
And despite all this growth spending, Amazon is expected to see its free cash flow margins quadruple from 2023 to 2027.
Fact Three: Microsoft Is The Slightly Higher Quality Company While Amazon Is The Better Investment
Microsoft is a higher quality company, but Amazon is the better long-term growth investment.
| Company | Microsoft | Amazon | MSFT Wins | AMZN Wins |
| Yield | 0.9% | 0.0% | 1 | |
| LT Growth Consensus | 12.5% | 31.9% | 1 | |
| Total Return Potential | 13.4% | 31.9% | 1 | |
| LT Risk-Adjusted Expected Return | 9.4% | 22.2% | 1 | |
| Inflation & Risk-Adjusted Expected Return | 7.2% | 20.0% | 1 | |
| Years To Double | 10.1 | 3.6 | 1 | |
| Historical Total Return | 14.3% | 34.7% | 1 | |
| 12-Month Consensus Total Return Potential | 21% | 24% | 1 | |
| 12-Month Fundamentally Justified Total Return Potential | -3% | 51% | 1 | |
| 5-Year Consensus Return Potential | 10% to 18%% | 34% to 39%% | 1 | |
| Discount To Fair Value | -4% | 34.0% | 1 | |
| PE or P/cash flow | 29.1 | 22.6 | 1 | |
| DK Rating | Hold | Very Strong Buy | 1 | |
| Dividend King’s Automatic Investment Decision Score | 86% B Satisfactory |
100% A+ Excellent |
1 | |
| Quality Score | 100% | 97% | 1 | |
| Safety Score | 100% | 100% | 1 | 1 |
| Dependability Score | 100% | 97% | 1 | |
| Long-Term Risk-Management Industry Percentile | 85% Very Good | 52% Average | 1 | |
| Credit Rating | AAA Stable | AA Stable | 1 | |
| 30-Year Bankruptcy Risk | 0.07% | 0.51% | 1 | |
| Dividend Growth Streak (Years) | 18 | NA | 1 | |
| 5-Year Dividend Growth Rate | 10% | NA | 1 | |
| Return On Capital (12-Months) | 108% | 6% | 1 | |
| Return On Capital Industry Percentile | 79% | 41% | 1 | |
| Return On Capital (13-Year Median) | 125% | 15% | 1 | |
| Return On Capital (5-Year trend) | -2.8% | 8.0% | 1 | |
| Sum | 12 | 15 |
(Source: Dividend Kings Zen Research Terminal)
Microsoft is the quality king of tech and arguably the world’s best company.
- the best credit rating in corporate America, AAA from all three agencies
- returns on capital of over 100%
- a dividend growth streak that’s 2 years from the Ben Graham standard of excellence (18 years)
- becomes a dividend aristocrat in 2029
- 85th percentile long-term risk management according to six rating agencies
But while Microsoft is a 100% quality, very low-risk 13/13 ultra-SWAN (sleep well at night) blue-chip, Amazon makes the far better investment today.
- 34% historically undervalued
- 22.6X cash flow
- 18.5X cash-adjusted earnings = 0.58 PEG – hyper-growth at a wonderful price
- 24% 12-month consensus total return forecast
- 51% 12-month fundamentally justified total return potential
- about 2X the long-term consensus total return potential
Fact Four: Amazon Is The Better Buy Today
I value companies by using the approach recommended by Ben Graham, the father of value investing and securities analysis.
- before he died in 1976, Graham recommended this approach over book value because book value doesn’t account for patents and the intellectual value of brands
- in the long-term, the market always correctly “weighs the substance of a company.”
- so use historical market-determined fair value (dividends, earnings, and cash flow multiples) over statistically significant periods
- assuming fundamentals are similar (regulatory environments, growth rates, etc.)
Microsoft Historical Market Determined Fair Value
| Metric | Historical Fair Value Multiples (10-Years, Nadella Era, New Business Model) | 2021 | 2022 | 2023 | 2024 | 2025 |
12-Month Forward Fair Value |
| Earnings | 25.74 | $221.36 | $249.42 | $284.68 | $284.68 | $345.95 | |
| Average | $221.36 | $249.42 | $284.68 | $284.68 | $345.95 | $271.12 | |
| Current Price | $282.30 | ||||||
|
Discount To Fair Value |
-27.53% | -13.18% | 0.84% | 0.84% | 18.40% | -4.12% | |
|
Upside To Fair Value (NOT Including Dividends) |
-21.59% | -11.65% | 0.84% | 0.84% | 22.55% | -3.96% (-3% including dividend) | |
| 2022 EPS | 2023 EPS | 2022 Weighted EPS | 2023 Weighted EPS | 12-Month Forward EPS | 12-Month Average Fair Value Forward PE |
Current Forward PE |
|
| $9.69 | $11.06 | $3.73 | $6.81 | $10.53 | 25.7 | 26.8 |
(Source: Dividend Kings Research Terminal)
Historically in the Nadella era, with MSFT adopting a subscription revenue business model, it’s worth about 26X earnings. Today it trades at 27X, a 4% historical premium.
- 16.6X cash-adjusted earnings
|
Analyst Median 12-Month Price Target |
Morningstar Fair Value Estimate |
| $330.14 (31.4 PE) | $352.00 (33.4 PE) |
|
Discount To Price Target (Not A Fair Value Estimate) |
Discount To Fair Value |
| 14.49% | 19.80% |
|
Upside To Price Target (Not Including Dividend) |
Upside To Fair Value (Not Including Dividend) |
| 16.95% | 24.69% |
|
12-Month Median Total Return Price (Including Dividend) |
Fair Value + 12-Month Dividend |
| $332.62 | $354.48 |
|
Discount To Total Price Target (Not A Fair Value Estimate) |
Discount To Fair Value + 12-Month Dividend |
| 15.13% | 20.36% |
|
Upside To Price Target ( Including Dividend) |
Upside To Fair Value + Dividend |
| 17.83% | 25.57% |
(Source: Dividend Kings Research Terminal)
Morningstar’s discounted cash flow model values MSFT at 33.4X earnings, which is not necessarily wrong, just historically speculative.
FAST Graphs, FactSet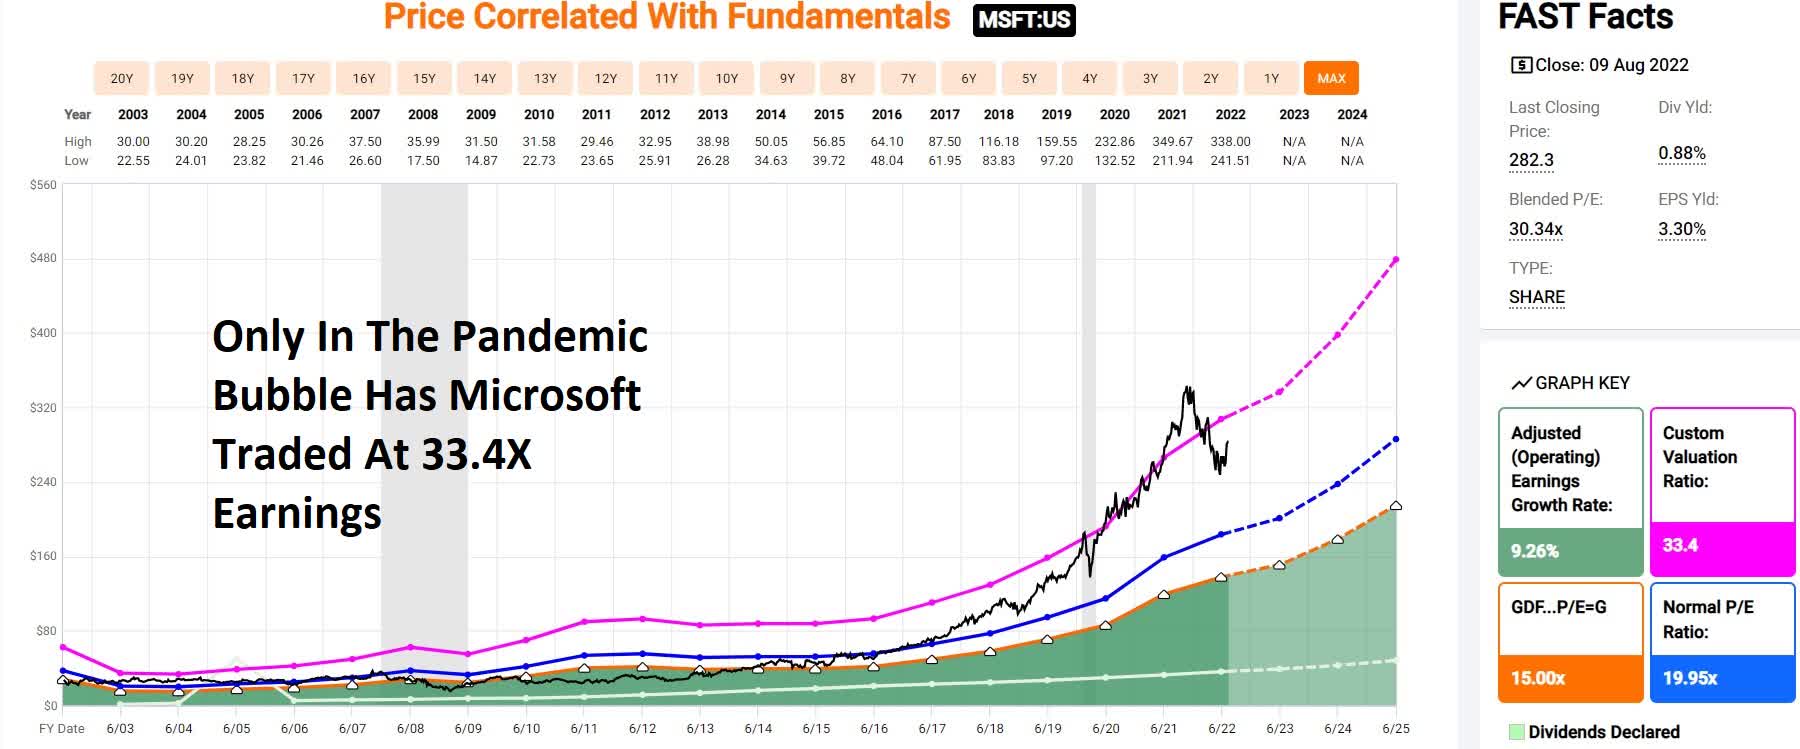
The only time in the last 20 years when MSFT traded at Morningstar’s fair value multiple was in the Pandemic bubble.
Is it possible that MSFT will be priced at 33.4X in the future? Sure. But that’s speculation, not historical market fact.
Analysts expect MSFT to trade at 31.4X earnings in 12 months. So does that mean analysts think MSFT is worth 31.4X earnings? No, it doesn’t.
| Time Frame (Years) |
Total Returns Explained By Fundamentals/Valuations |
| 1 Day | 0.01% |
| 1 month | 0.25% |
| 3 month | 0.75% |
| 6 months | 1.5% |
| 1 | 3% (Why 12-Month Price Targets Are Meaningless) |
| 2 | 6% |
| 3 | 23% |
| 4 | 31% |
| 5 | 39% |
| 6 | 47% |
| 7 | 55% (the max duration of most blue-chip bear markets or bubbles) |
| 8 | 62% |
| 9 | 70% |
| 10 | 78% |
| 11+ | 90% to 91% (Long-term) |
| 30+ | 97% (very long-term) – retirement time frame |
(Sources: JPMorgan Asset Management, Fidelity, Bank of America, RIA, Princeton)
- in the short-term, luck is 33X as powerful as fundamentals
- in the long-term, fundamentals are 33X as powerful as luck
12-month consensus return forecasts have zero bearing on my recommendations.
- I do like to compare 12-month fundamentally justified total return potential to 12-month consensus return forecasts though
- the total return potential if a company grows as expected and returns to mid-range historical market-determined fair value
Analyst upgrades/downgrades tend to be based on 12-month forecasts and nothing else.
Thus they are 97% driven by luck/sentiment, and I focus on fundamentals because, over the time frame that matters, fundamentals are 33X as powerful as luck.
Amazon Historical Market Determined Fair Value
| Metric | Historical Fair Value Multiples (14-Years) | 2021 | 2022 | 2023 | 2024 | 2025 |
12-Month Forward Fair Value |
| Operating Cash Flow | 25.98 | $116.91 | $158.74 | $239.02 | $308.38 | $340.08 | |
| Average | $116.91 | $158.74 | $239.02 | $308.38 | $340.08 | $208.14 | |
| Current Price | $137.83 | ||||||
|
Discount To Fair Value |
-17.89% | 13.17% | 42.33% | 55.31% | 59.47% | 33.78% | |
| Upside To Fair Value | -15.18% | 15.17% | 73.41% | 123.74% | 146.74% | 51.01% | |
| 2022 OCF | 2023 OCF | 2022 Weighted OCF | 2023 Weighted OCF | 12-Month Forward OCF | 12-Month Average Fair Value Forward P/OCF |
Current Forward P/OCF |
|
| $6.11 | $9.20 | $2.35 | $5.66 | $8.01 | 26.0 | 17.2 |
Historically, Amazon is worth 26X cash flow; today, it trades at 17.2X.
- 18.5X cash-adjusted earnings
- 0.58 PEG = hyper-growth at a wonderful price
|
Analyst Median 12-Month Price Target |
Morningstar Fair Value Estimate |
| $170.41 (21.3X cash flow) | $192.00 (24X cash flow) |
|
Discount To Price Target (Not A Fair Value Estimate) |
Discount To Fair Value |
| 16.36% | 25.77% |
|
Upside To Price Target |
Upside To Fair Value |
| 19.56% | 34.71% |
(Source: Dividend Kings Research Terminal)
Morningstar considers AMZN worth 24X cash flow, slightly below its historical norm. Analysts expect a 20% gain in the next year, returning to a still undervalued 21.3X cash flow
What does this mean for investors in Microsoft and Amazon?
Microsoft 2025 Consensus Total Return Potential
(FAST Graphs, FactSet)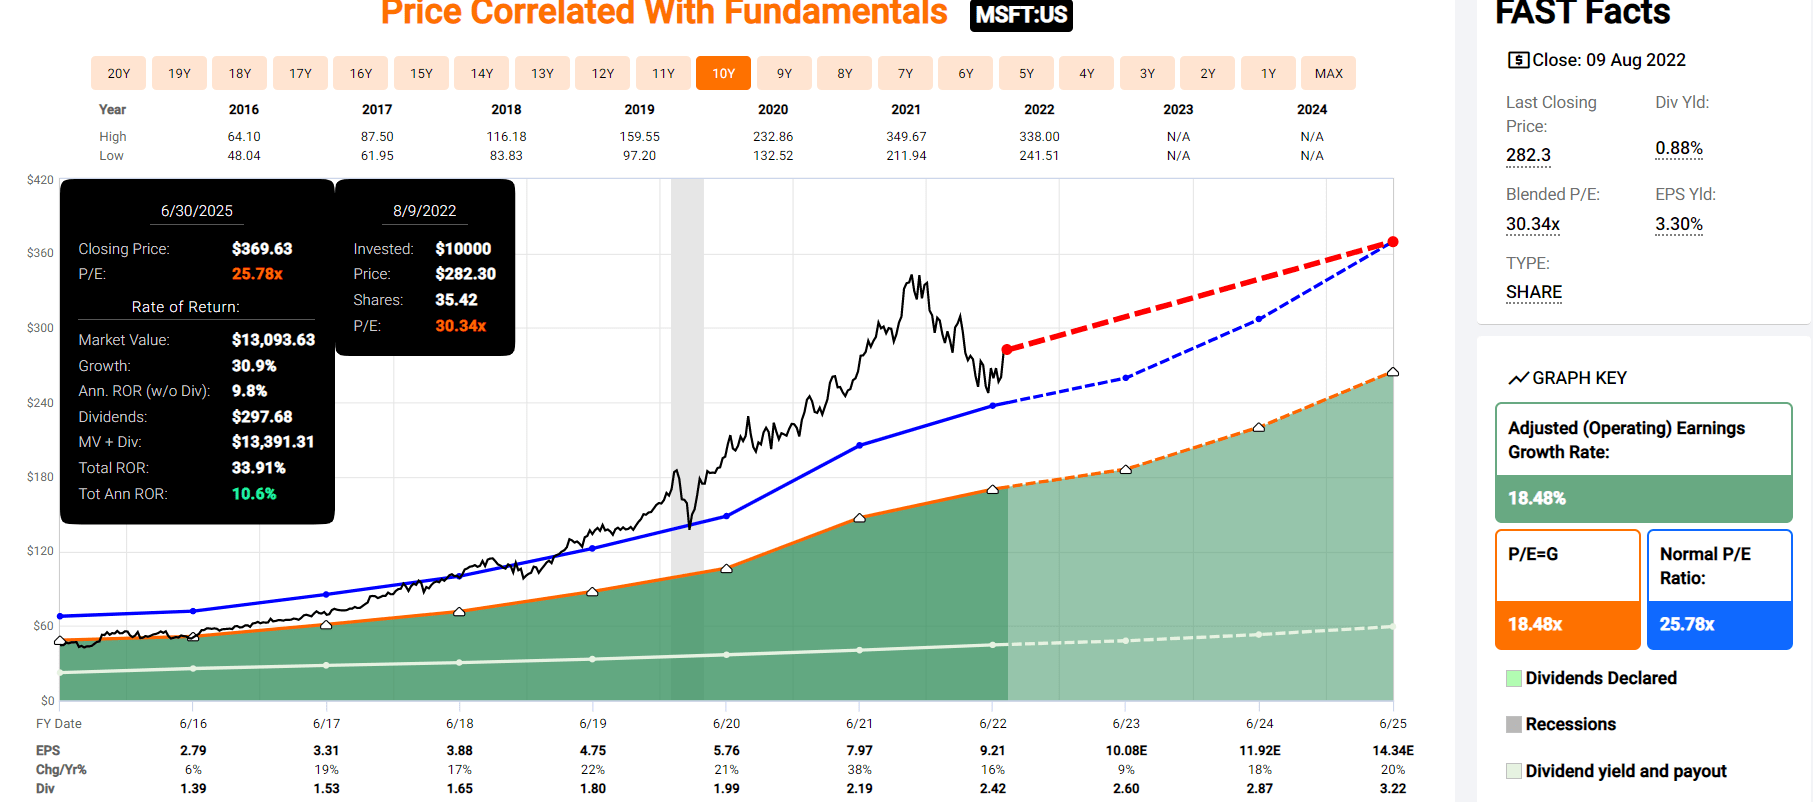
Microsoft is growing fast enough that even though it’s modestly overvalued, it could still deliver very solid 11% returns over the next three years.
Amazon 2024 Consensus Total Return Potential
(FAST Graphs, FactSet)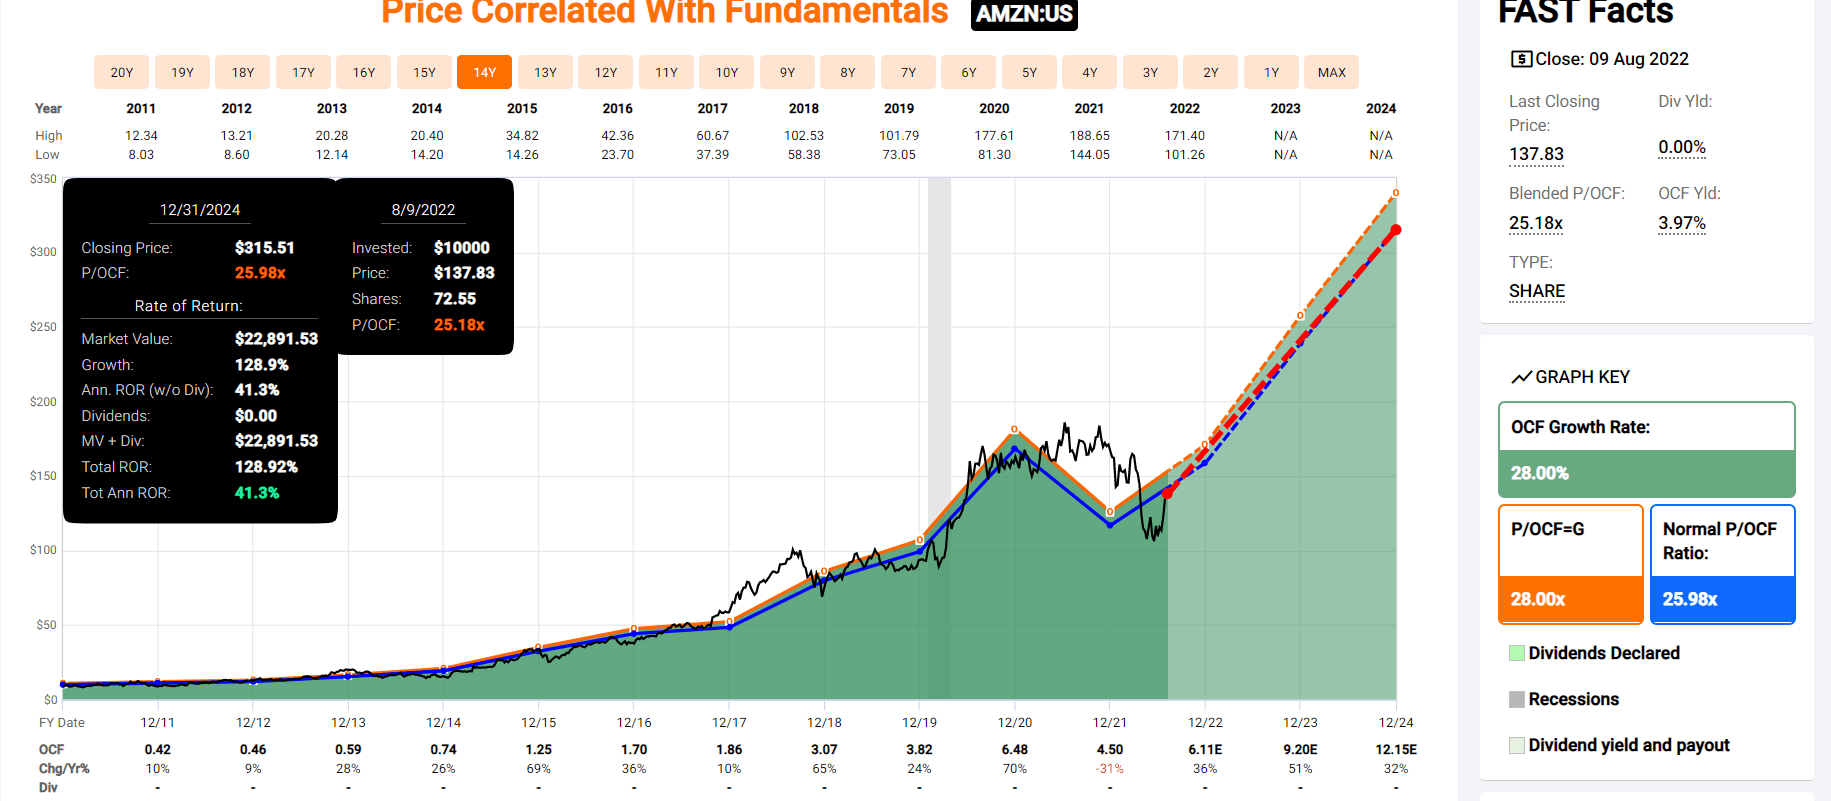
Amazon’s explosive growth could deliver 41% annual returns through the end of 2024.
S&P 500 2024 Consensus Total Return Potential
(FAST Graphs, FactSet)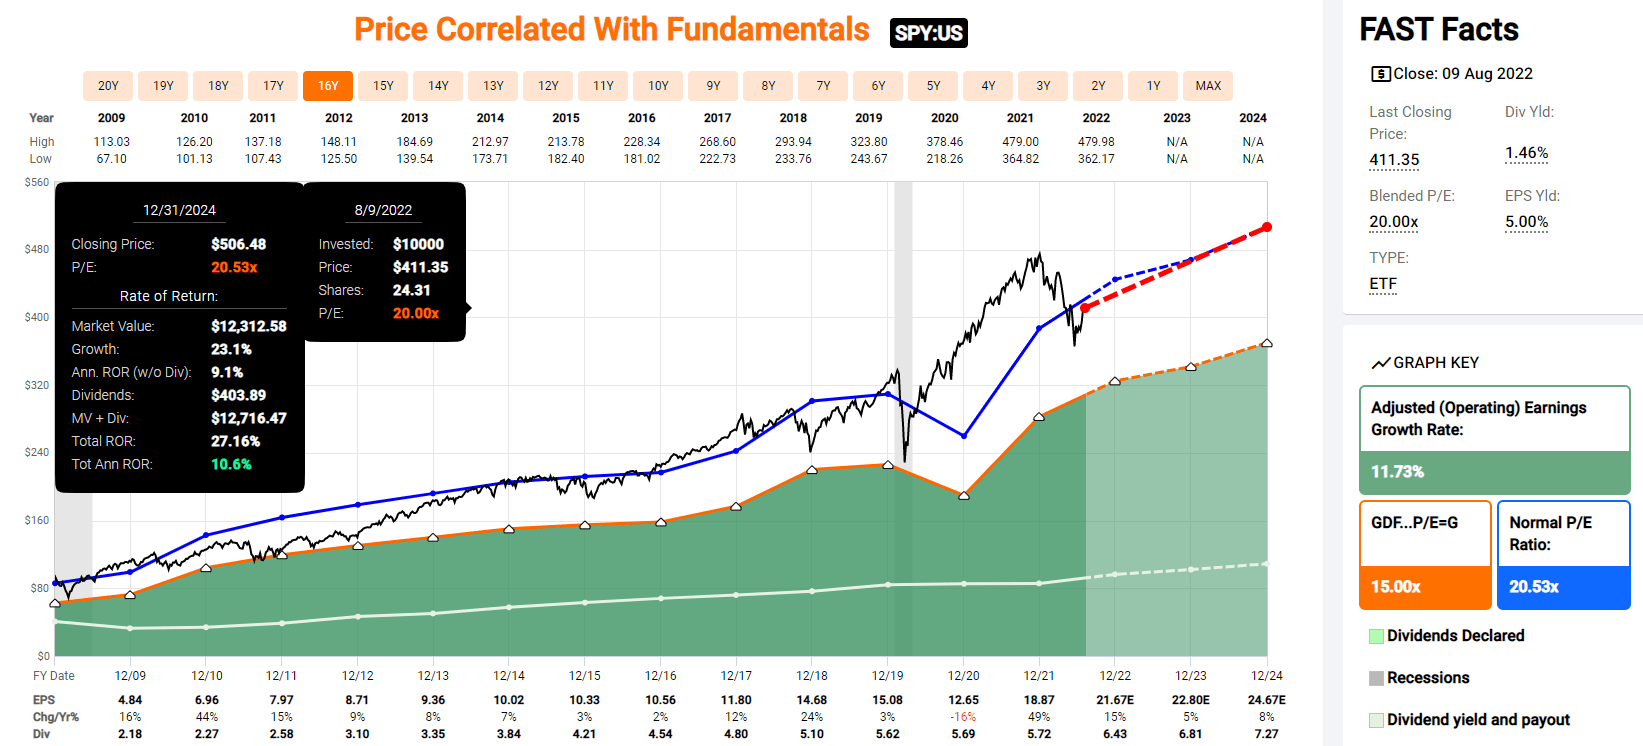
The market is expected to deliver about 11% annual returns, similar to Microsoft.
S&P 500 2027 Consensus Total Return Potential
| Year | Upside Potential By End of That Year | Consensus CAGR Return Potential By End of That Year | Probability-Weighted Return (Annualized) |
Inflation And Risk-Adjusted Expected Returns |
| 2027 | 47.21% | 8.04% | 6.03% | 3.75% |
(Source: DK S&P 500 Valuation & Total Return Potential Tool)
Over the next five years, analysts expect about 8% annual returns, a modest but still decent 4% real expected return.
Microsoft 2028 Consensus Total Return Potential
(FAST Graphs, FactSet)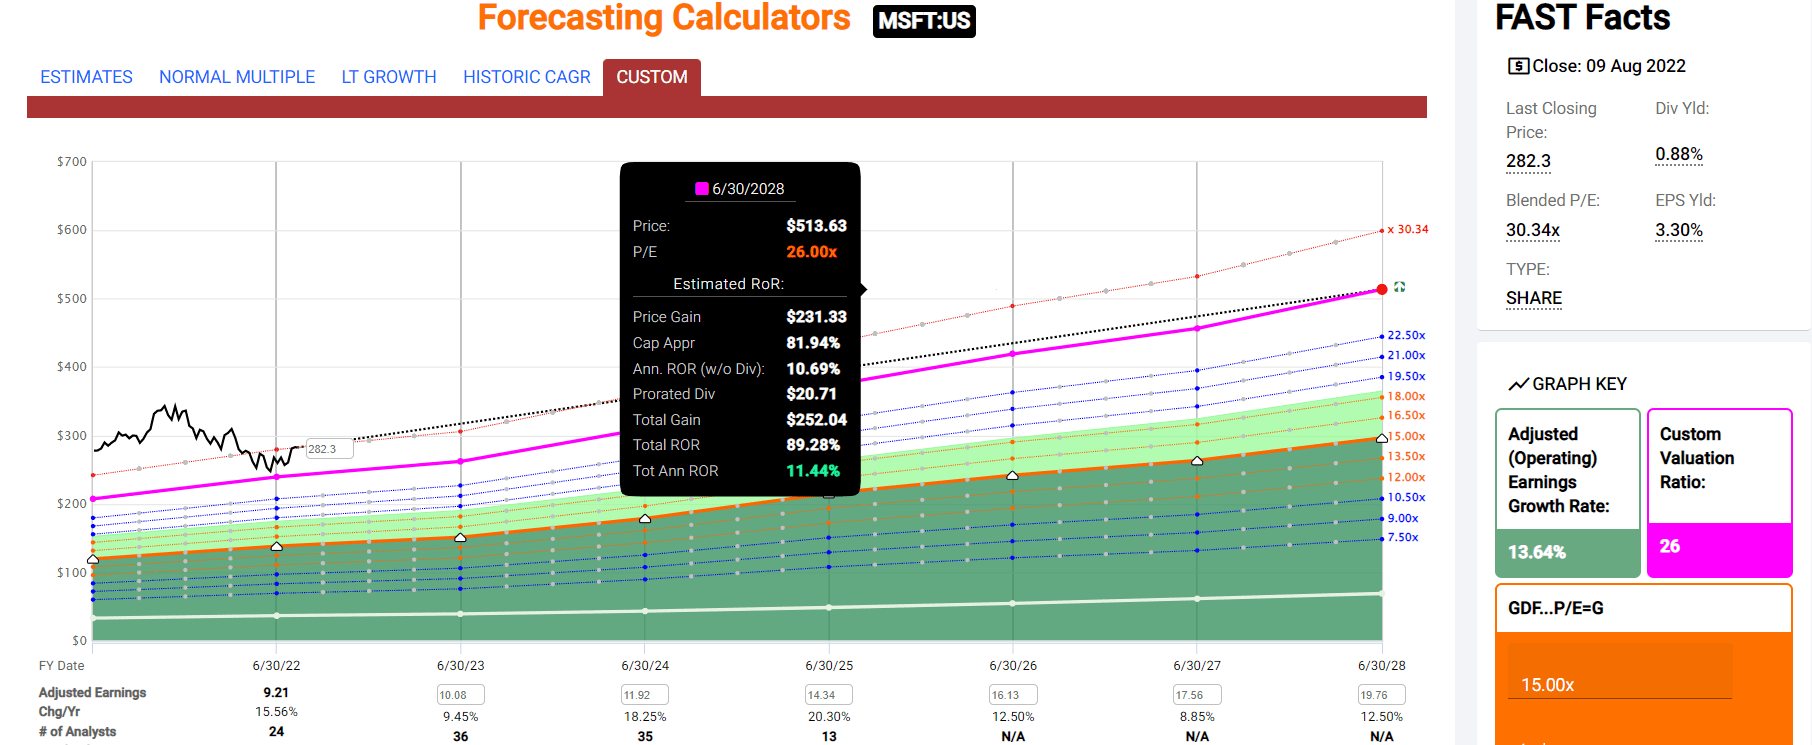
Microsoft could deliver about 90% total returns or 11% per year, about 2X that of the S&P 500.
Amazon 2028 Consensus Total Return Potential
(FAST Graphs, FactSet)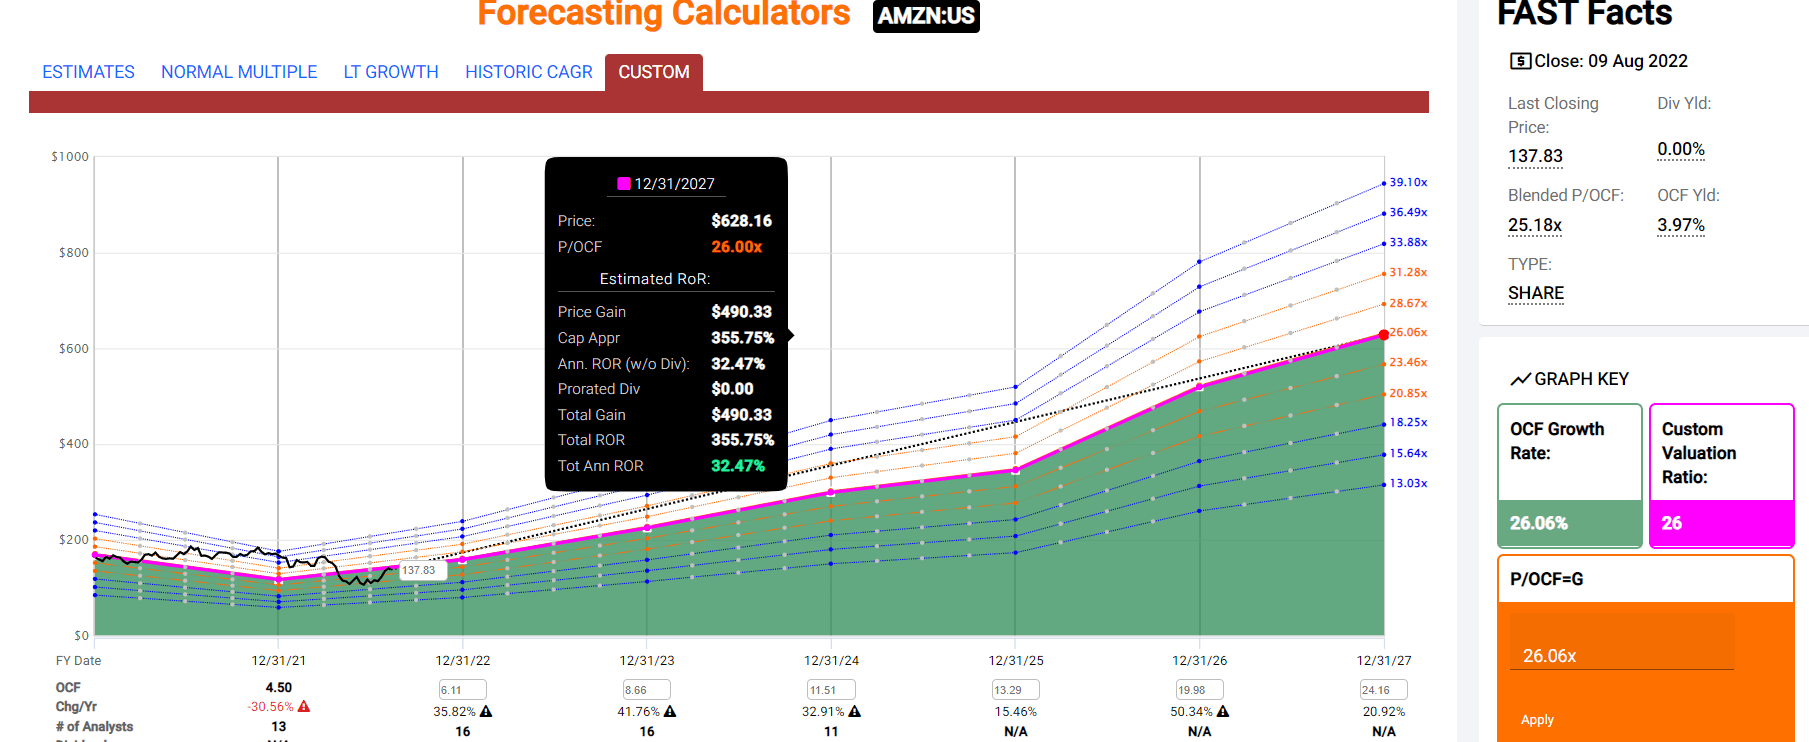
Amazon’s combination of deep value and hyper-growth could deliver 355% returns over the next five years, a Buffett-like 33% annual return.
- 7X more than the S&P 500 and 4X more than Microsoft
Fact Five: Neither Is Likely To Be Affected Much By The Inflation Reduction Act Of 2022
The Inflation Reduction Act of 2022 has passed the Senate and is expected to be passed by the House this week and signed into law days later.
Two key provisions in the bill have some tech investors worried.
- the 15% minimum corporate tax
- the 1% tax on buybacks
Here is why this new law is unlikely to hurt MSFT or AMZN.
Microsoft Tax Consensus Forecast
| Fiscal Year | Pre-Tax Profit | Tax Costs | Tax Rate |
| 2021 | $71,102 | $9,831 | 13.83% |
| 2022 | $83,716 | $10,978 | 13.11% |
| 2023 (The calendar year 2022) | $93,062 | $17,354 | 18.65% |
| 2024 | $108,179 | $19,574 | 18.09% |
| 2025 | $128,614 | $23,003 | 17.89% |
| 2026 | $137,164 | $23,318 | 17.00% |
| 2027 | $152,727 | $25,964 | 17.00% |
| Annualized Growth | 13.59% | 17.57% | 3.50% |
|
Total Taxes 2022 through 2027 |
$109,213 |
(Source: FactSet Research Terminal)
At first glance, you might think the IRA will increase MSFT’s taxes by $6 billion in the first year. However, the law won’t take effect until next year, which will be fiscal 2024 for MSFT.
In other words, MSFT’s effective tax rate was already expected to rise to 17% to 18.7% in the next few years. A 15% minimum tax will not affect MSFT, which now pays more than this in taxes.
In fact, through fiscal 2027 (our 2026), it’s expected to pay $109 billion in taxes, one of the biggest global taxpayers in history.
What about Amazon? For years politicians have railed against Amazon paying no taxes, so surely a 15% minimum tax will hammer it, right?
Amazon Tax Consensus Forecast
| Year | Pre-Tax Profit | Tax Costs | Tax Rate |
| 2021 | $38,151 | $4,791 | 12.56% |
| 2022 | $3,577 | -$136 | -3.80% |
| 2023 | $32,560 | $5,335 | 16.39% |
| 2024 | $51,911 | $9,234 | 17.79% |
| 2025 | $71,792 | $12,353 | 17.21% |
| 2026 | $101,295 | $18,894 | 18.65% |
| 2027 | $140,787 | $25,894 | 18.39% |
| Annualized Growth | 24.31% | 32.47% | 6.57% |
|
Total Taxes 2022 through 2027 |
$71,574 |
(Source: FactSet Research Terminal)
Amazon’s consensus tax rate for this year is -3.8% due to high growth spending.
But by next year, it will be 16% and climbing because Amazon’s GAAP profits are growing quickly.
In other words, a 15% minimum tax won’t affect AMZN since its tax rate was expected to go above 15% anyway.
None of the big tech giants are expected to be affected by the new 15% minimum tax.
What About The 1% tax on buybacks? Well, that will hit Microsoft and, to a smaller extent Amazon.
Microsoft Buyback Consensus Forecast
| Year | Consensus Buybacks ($ Millions) | % Of Shares (At Current Valuations) | Market Cap |
| 2022 (Last Year) | $32,696 | 1.6% | $2,100,047 |
| 2023 (This Year) | $33,252 | 1.6% | $2,100,047 |
| 2024 | $37,122 | 1.8% | $2,100,047 |
| 2025 | $38,994 | 1.9% | $2,100,047 |
| 2026 | $41,645 | 2.0% | $2,100,047 |
| 2027 | $44,477 | 2.1% | $2,100,047 |
| Total 2023 through 2027 | $195,490 | 9.3% | $2,100,047 |
| Annualized Rate | 1.93% | Average Annual Buybacks | $39,098 |
| 1% Buyback Tax | $1,955 | Average Annual Buyback Tax | $391 |
(Source: FactSet Research Terminal)
MSFT is expected to spend almost $200 billion over the next five years, buying back about 9% of its stock (at current valuations). That’s a $2 billion tax bill or $391 million per year.
- a 1% buyback tax is a rounding error for MSFT
- “couch cushion” money
Amazon Buyback Consensus Forecast
| Year | Consensus Buybacks ($ Millions) | % Of Shares (At Current Valuations) | Market Cap |
| 2022 | $6,750 | 0.5% | $1,401,807 |
| 2023 | $1,333 | 0.1% | $1,401,807 |
| 2024 | $755 | 0.1% | $1,401,807 |
| Total 2022 through 2024 | $8,838 | 0.6% | $1,401,807 |
| Annualized Rate | 0.2% | Average Annual Buybacks | $2,946 |
| 1% Buyback Tax | $88 | Average Annual Buyback Tax | $29 |
(Source: FactSet Research Terminal)
At the moment, Amazon is so focused on growth that analysts think it won’t even tap its entire $10 billion buyback authorization by 2024. I fully expect Amazon will spend a lot more on buybacks than this forecast.
- most likely, 2023’s buybacks will be larger than 2022’s
- and Amazon could easily spend more each year on repurchases without sacrificing growth spending
But at the moment, analysts estimate AMZN’s total three-year tax bill on buybacks at $88 million, or $29 million per year. This is such an insignificant amount that investors can safely ignore it.
Bottom Line: Both Amazon And Microsoft Could Make You Rich, But Amazon Is The Better Buy Today
Amazon and Microsoft are incredible tech titans, cloud kings, and world-beater blue-chips.
Both deserve a spot in almost every diversified and prudently risk-managed portfolio.
Both delivered good earnings, far better than many investors feared. Both are executing well, and their cloud businesses, the core of their future dominance, are firing on all cylinders.
The Inflation Reduction Act of 2022 is likely to have very little impact on either of these tech giants since both were already expected to pay more than 15% tax rates before it passed. The 1% buyback tax is a rounding error for all of corporate America (about $8 billion annually).
Microsoft is the higher quality company, but Amazon is still one of the world’s premier blue-chips. Losing to Microsoft on quality is not a negative, since MSFT is a 100% quality very-low risk 13/13 ultra-SWAN and arguably the greatest company on earth.
MSFT is modestly overvalued today but growing fast enough that it’s likely to still deliver solid market-level 11% potential returns over the next three years and almost double in the next five.
But Amazon is the growth king of ultra-SWANs, with 32% consensus growth, driven by a 4X increase in cash flow margins, potentially helping it deliver 41% annual returns through 2024 and 350% through 2027.
On pure growth prowess and valuation, Amazon is the better buy today, but I can say with 80% confidence that anyone buying MSFT today will likely be happy with the results in 5+ years.
Both Amazon and Microsoft can potentially make you rich, but Amazon is the better buy today.
But if you own them both within a diversified and prudently risk-managed portfolio, then over the long-term you are likely to retire in comfort and possibly safety and splendor.
Be the first to comment